. 2022 Jan 15;91(2):202-215.
doi: 10.1016/j.biopsych.2021.07.024. Epub 2021 Aug 10.

Computational Modeling of Electroencephalography and Functional Magnetic Resonance Imaging Paradigms Indicates a Consistent Loss of Pyramidal Cell Synaptic Gain in Schizophrenia

Affiliations

Computational Modeling of Electroencephalography and Functional Magnetic Resonance Imaging Paradigms Indicates a Consistent Loss of Pyramidal Cell Synaptic Gain in Schizophrenia

Rick A Adams et al. Biol Psychiatry. .

Abstract

Background: Diminished synaptic gain-the sensitivity of postsynaptic responses to neural inputs-may be a fundamental synaptic pathology in schizophrenia. Evidence for this is indirect, however. Furthermore, it is unclear whether pyramidal cells or interneurons (or both) are affected, or how these deficits relate to symptoms.

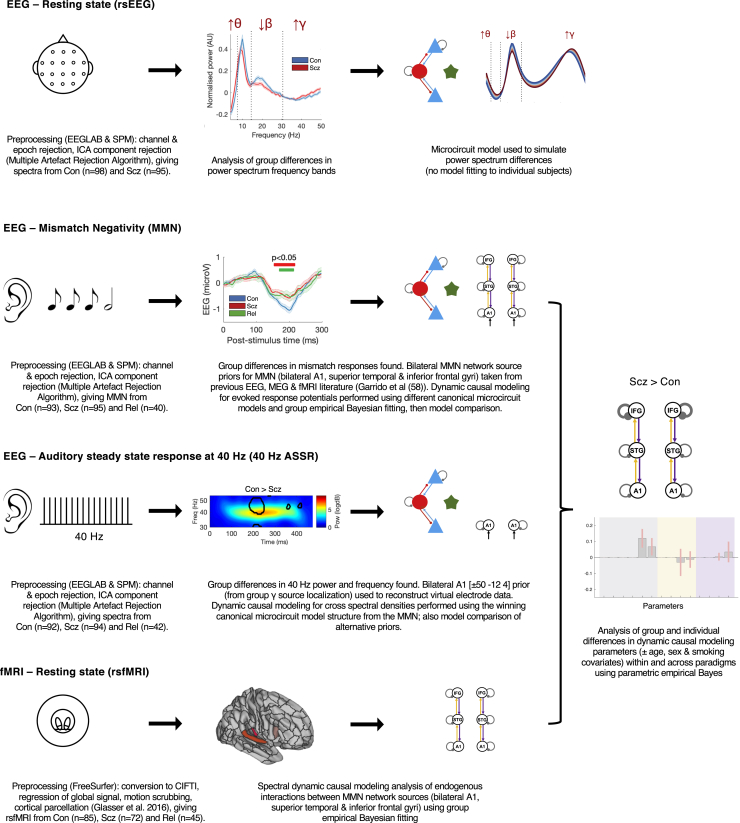
Methods: People with schizophrenia diagnoses (PScz) (n = 108), their relatives (n = 57), and control subjects (n = 107) underwent 3 electroencephalography (EEG) paradigms-resting, mismatch negativity, and 40-Hz auditory steady-state response-and resting functional magnetic resonance imaging. Dynamic causal modeling was used to quantify synaptic connectivity in cortical microcircuits.

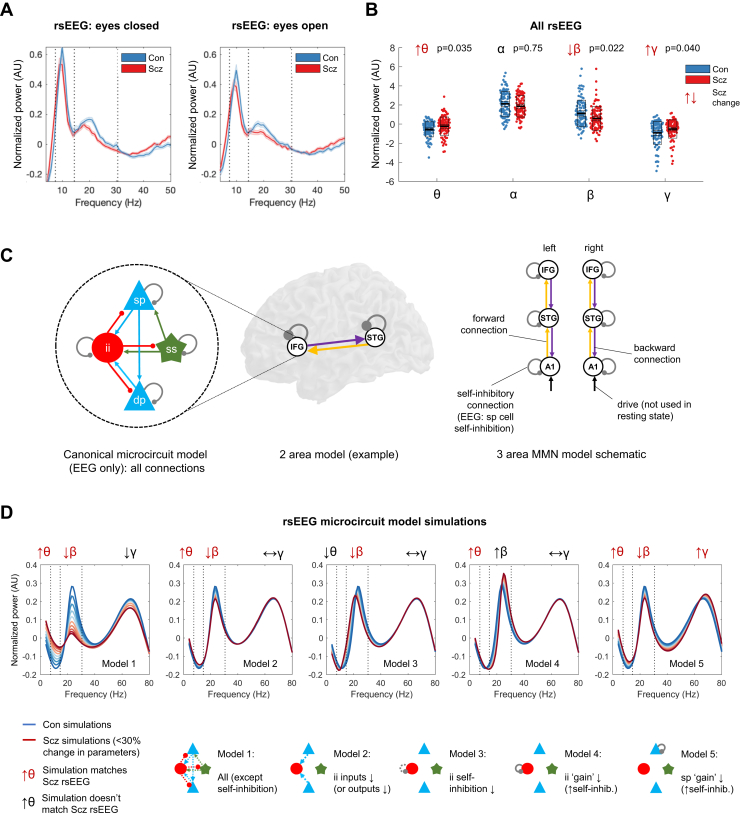
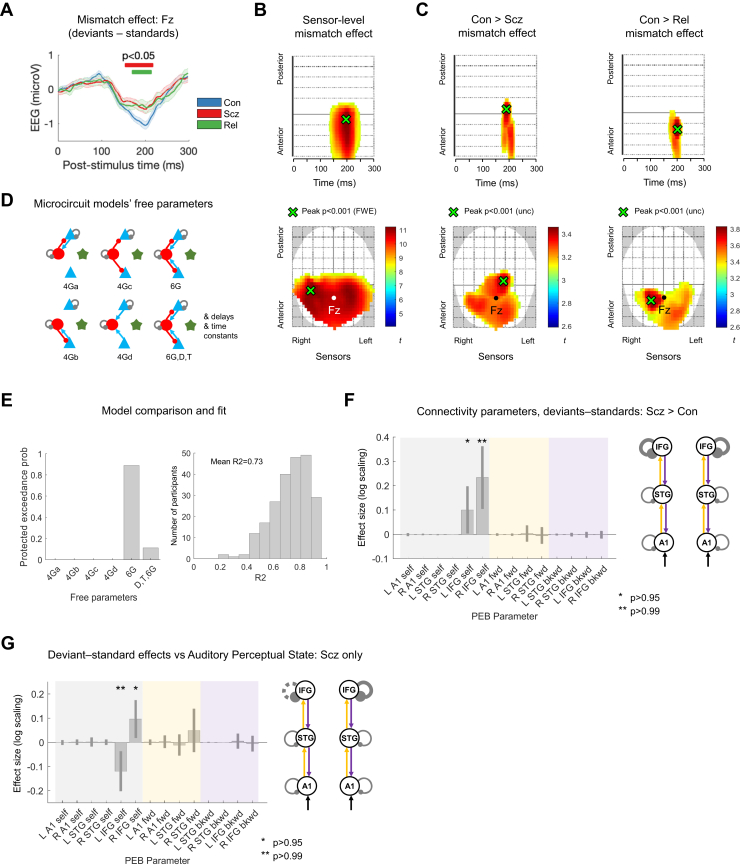
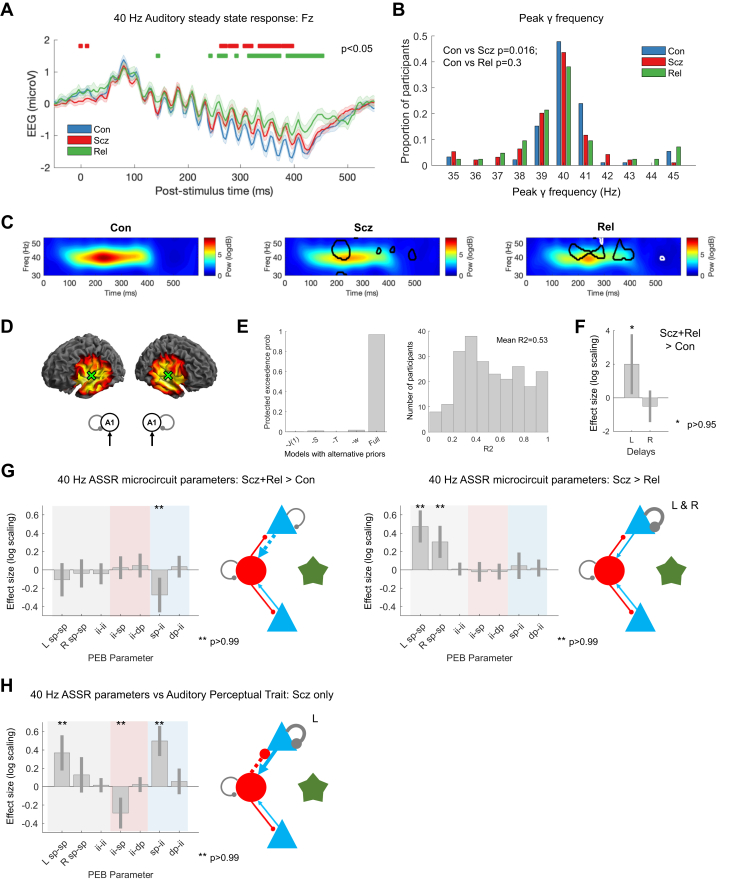
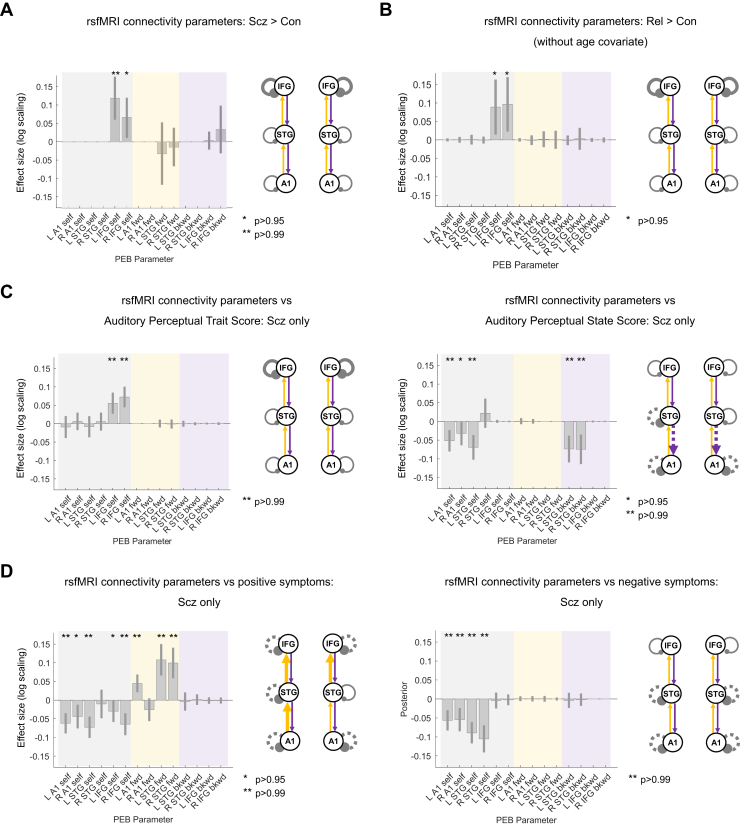
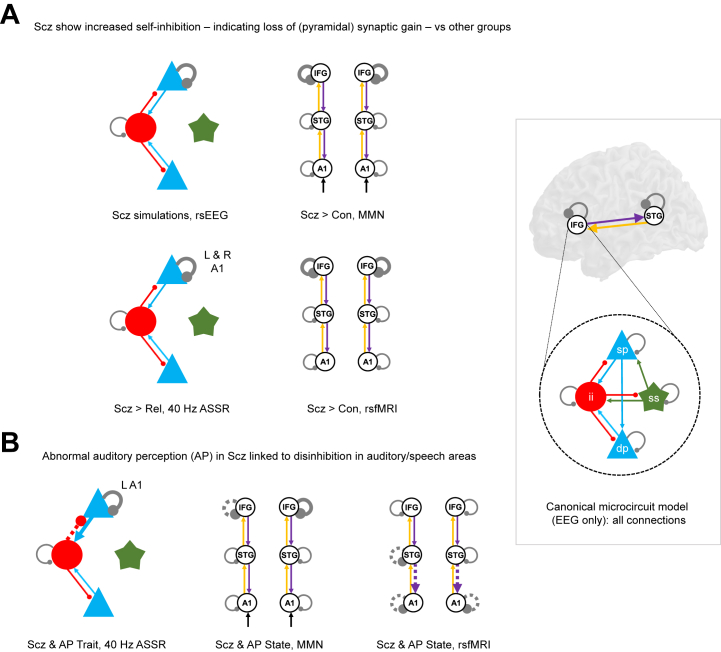
Results: Classic group differences in EEG features between PScz and control subjects were replicated, including increased theta and other spectral changes (resting EEG), reduced mismatch negativity, and reduced 40-Hz power. Across all 4 paradigms, characteristic PScz data features were all best explained by models with greater self-inhibition (decreased synaptic gain) in pyramidal cells. Furthermore, disinhibition in auditory areas predicted abnormal auditory perception (and positive symptoms) in PScz in 3 paradigms.

Conclusions: First, characteristic EEG changes in PScz in 3 classic paradigms are all attributable to the same underlying parameter change: greater self-inhibition in pyramidal cells. Second, psychotic symptoms in PScz relate to disinhibition in neural circuits. These findings are more commensurate with the hypothesis that in PScz, a primary loss of synaptic gain on pyramidal cells is then compensated by interneuron downregulation (rather than the converse). They further suggest that psychotic symptoms relate to this secondary downregulation.

Keywords: Auditory steady-state; Dynamic causal model; Mismatch negativity; Psychosis; Resting state; Schizophrenia.


Figures

Figure 1
Figure 1
An overview of the analysis. This schematic illustrates the key steps in the preprocessing of the electroencephalography (EEG) (resting state [rs], mismatch negativity [MMN], and 40-Hz auditory steady-state response [ASSR]) and resting-state functional magnetic resonance imaging (rsfMRI) paradigms and their subsequent analysis using dynamic causal modeling (DCM) and parametric empirical Bayes. Simplified depictions of the paradigms are shown in the first column (see the Supplement for details), with group differences in EEG data features in the second column (first 3 rows) and DCM in the third column. The EEG data control group (Con) versus people with schizophrenia diagnoses (PScz) group differences are (from first to third rows) in rsEEG θ, β, and γ frequency band power (Figure 2A), MMN responses (Figure 3A), and 40-Hz ASSR power (Figure 4C). The second column of the final row (rsfMRI) shows the Glasser parcellation areas primary auditory cortex (A1) (middle), A4 (left), and 44 (right) containing the MMN sources A1, superior temporal gyrus (STG), and inferior frontal gyrus (IFG), respectively; these were used as nodes in the rsfMRI analysis, so that results could be compared across data modalities. Key preprocessing and analysis steps are described below the illustrations. DCM for EEG uses a cortical microcircuit model, shown on the left in the third column (also see Figure 2C). It contains superficial and deep pyramidal cells (blue triangles), inhibitory interneurons (red circles), and spiny stellate cells (green stars). The lower three DCM illustrations include macroscopic model structures, i.e., the cortical areas involved: A1, STG, and IFG (58). In the rsEEG analysis (top row), a single-area DCM was used to reproduce power spectra characteristic of each group. In the remaining paradigms, models were fitted to the data and parametric empirical Bayes was used to analyze group and individual differences. The final column depicts an example analysis (from Figure 3F) of group differences in DCM parameters between Con and PScz in the MMN. ICA, independent component analysis; MEG, magnetoencephalography; Rel, first-degree relative.
Figure 2
Figure 2
Resting-state electroencephalography (rsEEG) results, dynamic causal modeling (DCM) model structure, and rsEEG simulations. (A) Mean normalized eyes closed and eyes open rsEEG power spectra (± SEM) across all channels for control subjects (Con) (n = 98; blue) and people with schizophrenia diagnoses (PScz) (n = 95; red) groups, divided into 4 frequency bands (dotted lines): θ (3–7 Hz), α (8–14 Hz), β (15–30 Hz), and γ (>31 Hz). (B) Group comparisons in mean power across both eyes closed and eyes open conditions in the θ, α, β, and γ bands are shown. The box plots show the mean, SEM, and SD. p values are Bonferroni-corrected for 4 comparisons. (C) EEG DCMs used the current version of the canonical microcircuit model (59) (also see Figure S1A). This microcircuit (left) consists of superficial pyramidal (sp) and deep pyramidal (dp) cells, inhibitory interneuron (ii), and spiny stellate (ss) cells. They are interconnected with excitatory (arrowheads) and inhibitory (beads) connections; their self-inhibitory connections parameterize their responsiveness to their inputs, i.e., synaptic gain. In EEG DCM, each modeled cortical area contains a microcircuit (middle); functional magnetic resonance imaging DCM uses a much simpler neuronal model. Both DCMs have self-inhibition parameters (round gray beads), which—in EEG—inhibit superficial pyramidal cells specifically. A schematic DCM diagram is explained on the right. (D) The top row shows the results of 5 sets (models 1–5) of simulations of microcircuit parameter changes and their similarity to the rsEEG changes in θ, β, and γ bands in PScz (the model does not produce an α peak). The parameters changed in each model are illustrated in the microcircuit schematics for models 1–5 (bottom row); parameter increases are denoted by whole lines and decreases by dotted lines. Each model is used to produce 10 simulations, starting with standard parameter values (to simulate Con) plotted in dark blue, and then reducing or increasing the parameters illustrated below in increments of 3% to simulate PScz (up to the most extreme change, plotted in dark red). Only model 5, an increase in superficial pyramidal self-inhibition, i.e., a loss of synaptic gain, reproduces the changes seen in all 3 frequency bands. IFG, inferior frontal gyrus; MMN, mismatch negativity; STG, superior temporal gyrus.
Figure 3
Figure 3
Mismatch negativity data and modeling analysis. (A) Mismatch difference waves (i.e., deviant–standard, mean ± SEM) for control subjects (Con) (n = 94; blue), people with schizophrenia diagnoses (PScz) (n = 96; red), and first-degree relatives (Rel) (n = 42; green) at electrode Fz. Group differences are computed using t tests (uncorrected [unc]) at each time point and are marked with red (PScz vs. Con) and green (Rel vs. Con) bars above the difference waves. There were no significant PScz vs. Rel differences. (B) The lower plot shows the location of the mismatch effect (i.e., deviants—standard) at sensor level across all Con and PScz, displayed at p < .05 (familywise error [FWE]). Fz is shown in white. The peak effect is shown in green (p < .001 [FWE], t376 = 11.23). The upper plot shows sensors vs. time; the peak effect occurs at 198 ms. (C) These plots show the interaction of condition and group for the Con > PScz contrast (left) and Con > Rel contrast (right) in the same format as Figure 2B, at the lower threshold of p < .005 (unc) for display purposes. Both groups demonstrate similar differences from Con in the mismatch contrast in frontocentral sensors just before 200 ms. (D) Microcircuit models were compared, differing only in which parameters were allowed to change from their priors (estimated G connectivity parameters are shown, as in Figure 2C). These models’ free G parameters included various combinations of superficial pyramidal and/or deep pyramidal cell (blue) connections to or from inhibitory interneurons (red) and self-inhibition of superficial pyramidal and inhibitory interneuron cells. Note that each parameter within each microcircuit could differ between subjects but was constrained to be the same in every cortical area within subjects, except for superficial pyramidal self-inhibition, which could differ throughout. The final model also estimated delay (D) and time constant (T) parameters (these were fixed in the other five models). (E) Model comparison and evaluation. Left: the protected exceedance probability is the probability a particular model is more likely than any other tested model, above and beyond chance, given the group data. The model with most free parameters is at the far right; it comes second to the 6G model with fixed delays and time constants and 6 microcircuit connectivity parameters estimated. Right: a histogram of R2 values for all participants for the winning model; it fits most participants well. (F) A parametric empirical Bayes (PEB) analysis of mismatch negativity model parameters (i.e., connections) that contribute to the PScz > Con mismatch effect. The results are plotted on the left (with 95% Bayesian confidence intervals) and shown in schematic form on the right; parameters with posterior probabilities of p > .95 or p > .99 of contributing to the group difference effect are indicated with 1 (∗) or 2 asterisks (∗∗), respectively. On the plot, self-inhibitory connections are shaded gray, forward (fwd) connections shaded yellow, and backward (bkwd) connections shaded purple (matching the colors in the schematic). The y-axis denotes log-scaling of the effect size; changes of exp (±0.2) are of roughly ±20%. Some parameters have been eliminated during Bayesian model reduction (see Supplement). The analysis indicates that PScz showed greater self-inhibition (or reduction in synaptic gain) in bilateral inferior frontal gyrus (IFG) in the mismatch contrast. The Rel > Con contrast did not show significant effects. (G) PEB analysis of mismatch negativity mismatch effect model parameters that correlate with current (state) abnormal auditory percepts within PScz only, plotted in the same format as Figure 3F. Within PScz, abnormal auditory percepts relate to reduced self-inhibition in right (R) IFG but disinhibition in left (L) IFG (in Broca area). All effects shown in (F) and (G) are also present without the addition of age, sex, and smoking covariates (p > .95). Inclusion of a chlorpromazine dose equivalent covariate renders the analysis in (F) nonsignificant (p > .75), but it makes the overall effect of PScz on L and R IFG self-inhibition become significant (Figure S4C). STG, superior temporal gyrus.
Figure 4
Figure 4
40-Hz auditory steady-state response (ASSR) data and modeling analysis. (A) 40-Hz ASSR time courses at electrode Fz for control subjects (Con) (n = 92; blue), people with schizophrenia diagnoses (PScz) (n = 94; red), and first-degree relatives (Rel) (n = 42; green). Sixteen clicks were played at 40 Hz, starting at 0 ms. Group differences in the baseline deflection (not modeled subsequently) emerge after around 250 ms, shown with red bars (Con vs. PScz) and green bars (Con vs. Rel), both p < .05 (t tests per time point, uncorrected). (B) γ (35–45 Hz) frequencies with the strongest power (in the normalized spectrum) in each participant are shown in a histogram. (C) These normalized time frequency plots show the ∼40 Hz responses around 100 to 400 ms. The PScz and Rel plots have areas of difference from Con encircled in black; the Rel plot has areas of difference from PScz encircled in white (p < .05, t tests at each time and frequency). (D) The left plots show the bilateral primary auditory cortex (A1) (transverse temporal gyrus) sources chosen following source localization [±50 -12 4]. The 40-Hz ASSR model structure is on the right: bilateral sources in A1. (E) Left: to improve the dynamic causal modeling fit of the cross spectral densities in bilateral A1 in this nonstandard paradigm, we used empirical priors (also see Figure S1A) for J(1), the contribution spiny stellate cells make to the electroencephalography (EEG) signal; S, the gain of the neuronal activation function; T, population time constants; and w, the width of the ∼40 Hz Gaussian bump. The plot shows that the full model (with all the empirical priors) is superior to other models that used standard values for their respective priors (or for -w, 1 Hz instead of 4 Hz). Right: a histogram of R2s for all participants for the winning model. (F) Parametric empirical Bayes (PEB) analysis indicated that PScz + Rel > Con showed increased neural transmission delays in left (L) A1. (G) Left: PEB analysis (in the same format as Figure 3H) indicated that PScz + Rel > Con (a psychosis genetic risk effect) had decreased superficial pyramidal (sp)–inhibitory interneuron (ii) connectivity. Right: PScz > Rel (a psychosis diagnosis effect) shows decreased sp self-inhibition in bilateral A1. (H) PEB analysis in PScz, showing that abnormal auditory percepts are associated with disinhibition of the sp-ii circuit (and increased sp self-inhibition in L A1). All effects shown in (F), (G), and (H) are also present without the addition of age, sex, and smoking covariates (p > .95) and with inclusion of chlorpromazine dose equivalents as a covariate. dp, deep pyramidal; Freq, frequency; Pow, power; R, right.
Figure 5
Figure 5
Resting-state functional magnetic resonance imaging (rsfMRI) modeling analysis. (A) For comparative purposes, the rsfMRI connectivity analysis was conducted on the same network as the mismatch negativity (MMN) analysis. Results for control subjects (Con) (n = 85) and people with schizophrenia diagnoses (PScz) (n = 72) are shown in the same format as Figure 3F. As in the MMN, PScz showed increased self-inhibition in the bilateral inferior frontal gyrus (IFG). Inclusion of chlorpromazine equivalent dose as a covariate still showed increased self-inhibition in left (L) IFG but only at p > .75. (B) rsfMRI connectivity analysis without covariates for Con (n = 85) and first-degree relatives (Rel) (n = 45) is shown. Similar to PScz, Rel show increased self-inhibition in the bilateral IFG, but this effect disappeared with addition of the age covariate (p < .75). (C) Left: within PScz, abnormal auditory percepts (trait measure) related to increased self-inhibition in the bilateral IFG. Right: conversely, abnormal auditory percepts (state score, i.e., experiences within the last week only) relate to disinhibition in temporal areas and also a loss of top-down connections within the auditory cortex. The right (R) primary auditory cortex (A1) effect was attenuated if age, sex, and smoking covariates were not included and if a chlorpromazine dose equivalent covariate was added. (D) Left: within PScz, Brief Psychiatric Rating Scale positive symptom score related to disinhibition throughout the MMN network and increased forward (fwd) connectivity in 3 of 4 connections. Most effects were robust to addition of chlorpromazine dose equivalents as a covariate (all p > .99 except L IFG self-inhibition, p > .75), removal of the hallucinations score from the Brief Psychiatric Rating Scale positive symptom total (all p > .95 except L IFG and R A1 self-inhibition, p > .75), and analysis without covariates (all p > .99 except L IFG self-inhibition, p > .75). Right: within PScz, Brief Psychiatric Rating Scale negative symptom score related to disinhibition in temporal nodes of the MMN network. All effects shown (except Rel > Con) are also present without the addition of age, sex, and smoking covariates and if participants (2 Con, 8 PScz) with rsfMRI signal-to-noise ratio <25 are excluded (all p > .95). Some rsfMRI results are no longer significant without global signal regression (Figure S7). No results change substantially with inclusion of chlorpromazine dose equivalent as a covariate unless stated. bkwd, backward; PEB, parametric empirical Bayes; STG, superior temporal gyrus.
Figure 6
Figure 6
Summary of key findings across paradigms. This figure illustrates similar dynamic causal modeling findings across paradigms using the schematic illustrations from previous analyses. The inset at bottom right shows the canonical microcircuit model for electroencephalography (EEG) (below), which exists in each modeled cortical area (above). The microcircuit consists of superficial pyramidal (sp) and deep pyramidal (dp) cells (blue), inhibitory interneuron (ii) (red), and spiny stellate (ss) cells (green), interconnected with excitatory (arrowheads) and inhibitory (beads) connections. (A) Crucially, the people with schizophrenia diagnoses (Scz) group consistently exhibited increased self-inhibition (as expected from a loss of synaptic gain) in superficial pyramidal cells in particular (i.e., in the EEG paradigms). This was the case (from left to right) in primary auditory cortex (A1) in the 40-Hz auditory steady-state response (ASSR) (when compared with first-degree relatives [Rel]), in the bilateral inferior frontal gyrus (IFG) in both the mismatch negativity (MMN) (deviant–standard contrast) and the resting-state functional magnetic resonance imaging (rsfMRI), and in the rsEEG simulations. (B) Within the PScz group, abnormal auditory percepts were linked with disinhibition in A1 in both the 40-Hz ASSR paradigm and the rsfMRI and with disinhibition in left (L) IFG—i.e., Broca area—in the MMN (deviant–standard contrast). Con, control subjects; R, right; STG, superior temporal gyrus.

Comment in

References

    1. Krystal J.H., Anticevic A., Yang G.J., Dragoi G., Driesen N.R., Wang X.J., Murray J.D. Impaired tuning of neural ensembles and the pathophysiology of schizophrenia: A translational and computational neuroscience perspective. Biol Psychiatry. 2017;81:874–885. - PMC - PubMed
    1. Stephan K.E., Friston K.J., Frith C.D. Dysconnection in schizophrenia: From abnormal synaptic plasticity to failures of self-monitoring. Schizophr Bull. 2009;35:509–527. - PMC - PubMed
    1. Lewis D.A., Hashimoto T., Volk D.W. Cortical inhibitory neurons and schizophrenia. Nat Rev Neurosci. 2005;6:312–324. - PubMed
    1. Chung D.W., Fish K.N., Lewis D.A. Pathological basis for deficient excitatory drive to cortical parvalbumin interneurons in schizophrenia. Am J Psychiatry. 2016;173:1131–1139. - PMC - PubMed
    1. Dienel S.J., Lewis D.A. Alterations in cortical interneurons and cognitive function in schizophrenia. Neurobiol Dis. 2019;131:104208. - PMC - PubMed

Publication types