

Factors associated with COVID-19 viral and antibody test positivity and assessment of test concordance: a retrospective cohort study using electronic health records from the USA
- PMID: 34598988
- PMCID: PMC8488284
- DOI: 10.1136/bmjopen-2021-051707
Factors associated with COVID-19 viral and antibody test positivity and assessment of test concordance: a retrospective cohort study using electronic health records from the USA
Abstract
Objectives: To identify factors associated with COVID-19 test positivity and assess viral and antibody test concordance.
Design: Observational retrospective cohort study.
Setting: Optum de-identified electronic health records including over 700 hospitals and 7000 clinics in the USA.
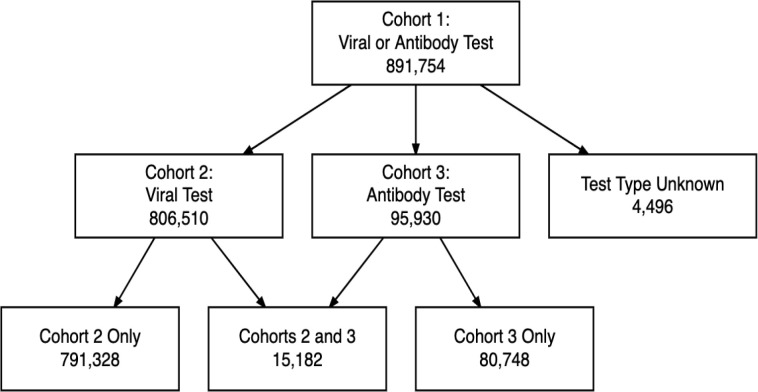
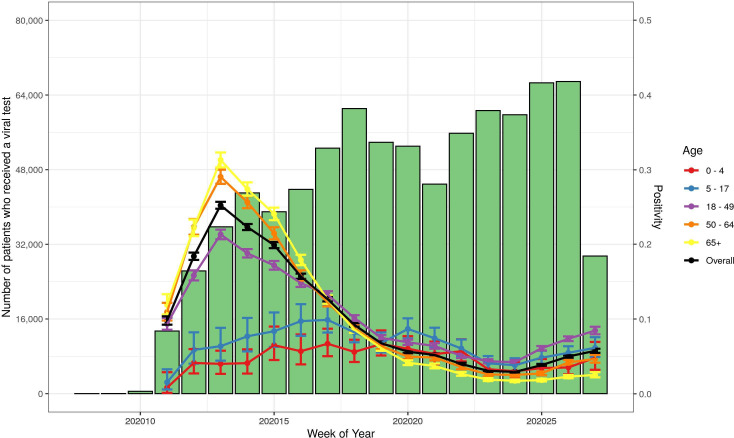
Participants: There were 891 754 patients who had a COVID-19 test identified in their electronic health record between 20 February 2020 and 10 July 2020.
Primary and secondary outcome measures: Per cent of viral and antibody tests positive for COVID-19 ('positivity rate'); adjusted ORs for factors associated with COVID-19 viral and antibody test positivity; and per cent concordance between positive viral and subsequent antibody test results.
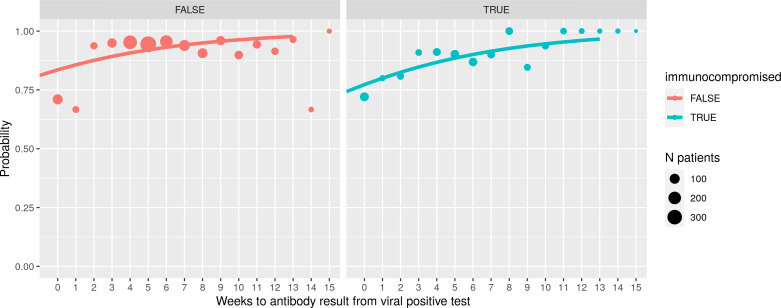
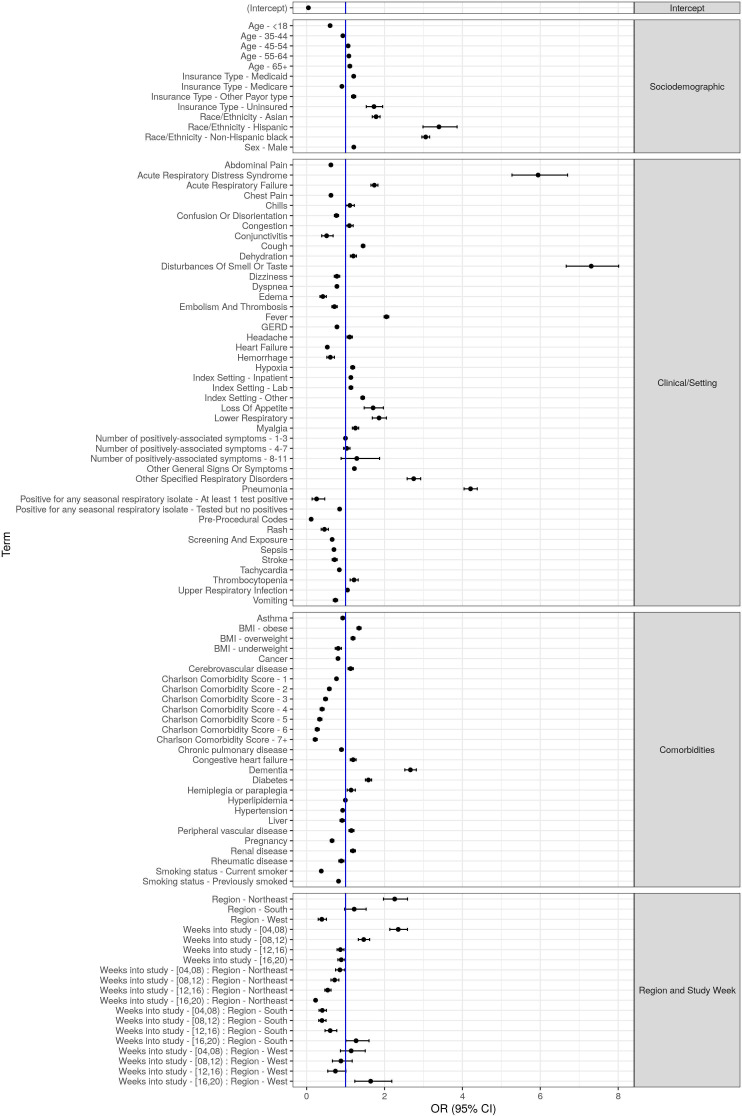
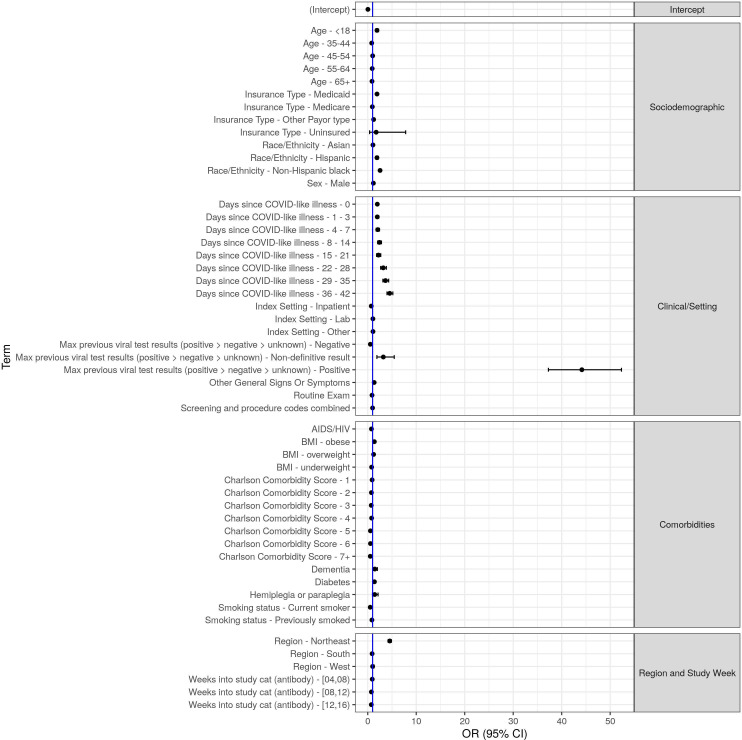
Results: Overall positivity rate was 9% (70 472 of 771 278) and 12% (11 094 of 91 741) for viral and antibody tests, respectively. Positivity rate was inversely associated with the number of individuals tested and decreased over time across regions and race/ethnicities. Antibody test concordance among patients with an initial positive viral test was 91% (71%-95% depending on time between tests). Among tests separated by at least 2 weeks, discordant results occurred in 7% of patients and 9% of immunocompromised patients. Factors associated with increased odds of viral and antibody positivity in multivariable models included: male sex, Hispanic or non-Hispanic black or Asian race/ethnicity, uninsured or Medicaid insurance and Northeast residence. We identified a negative dose effect between the number of comorbidities and viral and antibody test positivity. Paediatric patients had reduced odds (OR=0.60, 95% CI 0.57 to 0.64) of a positive viral test but increased odds (OR=1.90, 95% CI 1.62 to 2.23) of a positive antibody test compared with those aged 18-34 years old.
Conclusions: This study identified sociodemographic and clinical factors associated with COVID-19 test positivity and provided real-world evidence demonstrating high antibody test concordance among viral-positive patients.
Keywords: COVID-19; epidemiology; infectious diseases; molecular diagnostics; public health.
© Author(s) (or their employer(s)) 2021. Re-use permitted under CC BY-NC. No commercial re-use. See rights and permissions. Published by BMJ.
Conflict of interest statement
Competing interests: LL, MHS, SR, DSK and LT are employed by and hold shares in Genentech. FY is employed by and holds shares in Roche Diagnostics.
Figures
Similar articles
-
Ethnic disparities in the prevalence of SARS-CoV-2 testing positivity comparing Hispanic and non-Hispanic populations.Ann Fam Med. 2022 Apr 1;20(20 Suppl 1):2977. doi: 10.1370/afm.20.s1.2977. Ann Fam Med. 2022. PMID: 36696235 Free PMC article.
-
Assessment of 135 794 Pediatric Patients Tested for Severe Acute Respiratory Syndrome Coronavirus 2 Across the United States.JAMA Pediatr. 2021 Feb 1;175(2):176-184. doi: 10.1001/jamapediatrics.2020.5052. JAMA Pediatr. 2021. PMID: 33226415 Free PMC article.
-
Association of Maternal Perinatal SARS-CoV-2 Infection With Neonatal Outcomes During the COVID-19 Pandemic in Massachusetts.JAMA Netw Open. 2021 Apr 1;4(4):e217523. doi: 10.1001/jamanetworkopen.2021.7523. JAMA Netw Open. 2021. PMID: 33890989 Free PMC article.
-
Seroprevalence of Novel Coronavirus SARS-CoV-2 at a Community Hospital Emergency Department and Outpatient Laboratory in Northern Orange County, California.J Racial Ethn Health Disparities. 2021 Dec;8(6):1551-1555. doi: 10.1007/s40615-020-00918-0. Epub 2020 Nov 23. J Racial Ethn Health Disparities. 2021. PMID: 33230735 Free PMC article.
-
Disparities in Seroprevalence of SARS-CoV-2 Immunoglobulin Antibodies in a Large Midwestern Health Care System.Public Health Rep. 2021 May;136(3):361-367. doi: 10.1177/0033354921999168. Epub 2021 Mar 5. Public Health Rep. 2021. PMID: 33673779 Free PMC article.
Cited by
-
Assessing Smoking Status and Risk of SARS-CoV-2 Infection: A Machine Learning Approach among Veterans.Healthcare (Basel). 2022 Jul 4;10(7):1244. doi: 10.3390/healthcare10071244. Healthcare (Basel). 2022. PMID: 35885771 Free PMC article.
-
Burden of long COVID among adults experiencing sheltered homelessness: a longitudinal cohort study in King County, WA between September 2020-April 2022.BMC Public Health. 2023 Jun 6;23(1):1079. doi: 10.1186/s12889-023-16026-7. BMC Public Health. 2023. PMID: 37277786 Free PMC article.
-
Epidemiology and clinical features of SARS-CoV-2 infection in children and adolescents in the pre-Omicron era: A global systematic review and meta-analysis.J Glob Health. 2024 Mar 1;14:05003. doi: 10.7189/jogh.14.05003. J Glob Health. 2024. PMID: 38419461 Free PMC article.
-
COVID-19 Surveillance in the Biobank at the Colorado Center for Personalized Medicine: Observational Study.JMIR Public Health Surveill. 2022 Jun 13;8(6):e37327. doi: 10.2196/37327. JMIR Public Health Surveill. 2022. PMID: 35486493 Free PMC article.
-
Ethno-demographic disparities in humoral responses to the COVID-19 vaccine among healthcare workers.J Med Virol. 2023 Sep;95(9):e29067. doi: 10.1002/jmv.29067. J Med Virol. 2023. PMID: 37675796 Free PMC article.
References
-
- Centers for Disease Control and Prevention . CDC data covid tracker. Available: https://covid.cdc.gov/covid-data-tracker/#cases_casesper100klast7days [Accessed 22 Jun 2021].
-
- Johns Hopkins University Medicine Coronavirus Resource Center . COVID-19 data in motion: current date. Available: https://coronavirus.jhu.edu/ [Accessed 22 Jun 2021].
-
- U.S Food and Drug Administration . In vitro diagnostics EUAs. individual EUAs for molecular diagnostic tests for SARS-CoV-2. Available: https://www.fda.gov/medical-devices/coronavirus-disease-2019-covid-19-em... [Accessed 10 Dec 2020].
Publication types
MeSH terms
LinkOut - more resources
Full Text Sources
Medical