. 2021 Oct 5;118(40):e2108155118.
doi: 10.1073/pnas.2108155118.

Listeriolysin S: A bacteriocin from Listeria monocytogenes that induces membrane permeabilization in a contact-dependent manner

Affiliations

Listeriolysin S: A bacteriocin from Listeria monocytogenes that induces membrane permeabilization in a contact-dependent manner

Jazmín Meza-Torres et al. Proc Natl Acad Sci U S A. .

Abstract

Listeriolysin S (LLS) is a thiazole/oxazole-modified microcin (TOMM) produced by hypervirulent clones of Listeria monocytogenes LLS targets specific gram-positive bacteria and modulates the host intestinal microbiota composition. To characterize the mechanism of LLS transfer to target bacteria and its bactericidal function, we first investigated its subcellular distribution in LLS-producer bacteria. Using subcellular fractionation assays, transmission electron microscopy, and single-molecule superresolution microscopy, we identified that LLS remains associated with the bacterial cell membrane and cytoplasm and is not secreted to the bacterial extracellular space. Only living LLS-producer bacteria (and not purified LLS-positive bacterial membranes) display bactericidal activity. Applying transwell coculture systems and microfluidic-coupled microscopy, we determined that LLS requires direct contact between LLS-producer and -target bacteria in order to display bactericidal activity, and thus behaves as a contact-dependent bacteriocin. Contact-dependent exposure to LLS leads to permeabilization/depolarization of the target bacterial cell membrane and adenosine triphosphate (ATP) release. Additionally, we show that lipoteichoic acids (LTAs) can interact with LLS and that LTA decorations influence bacterial susceptibility to LLS. Overall, our results suggest that LLS is a TOMM that displays a contact-dependent inhibition mechanism.

Keywords: Listeria monocytogenes (Lm); Listeriolysin S (LLS); bacteriocin; contact-dependent inhibition (CDI); microfluidic microscopy.


Conflict of interest statement

The authors declare no competing interest.

Figures

Fig. 1.
Fig. 1.
LLS is not actively secreted and is located at the cell membrane. (A) Localization of LLS by fractionation experiments. Western blot analysis was performed on a strain expressing LLS+ (negative control) and a strain expressing LLS+-FLAG (FLAG at the C terminus). Proteins were fractionated into four compartments: supernatant (SN), cell wall (CW), membrane (M), and cytoplasm (CY). InlA, ActA, EF-Tu, and InlC were used as controls for fractionation. Equivalent amounts of each fraction, corresponding to 100 μL of bacterial culture, were separated by sodium dodecyl sulfate–polyacrylamide gel electrophoresis (SDS-PAGE) and submitted to immunodetection using the indicated antibodies. Data from one representative experiment out of the three performed are shown. Pre-LLS FLAG, unmodified LLS peptide. (B) LLS SN and M fractions were immunoprecipitated on a strain expressing LLS+ (negative control) and a strain expressing LLS+-FLAG by using magnetic beads coupled to anti-FLAG antibodies. Equivalent amounts of each fraction, corresponding to 2.5 mL of bacterial culture, were separated by SDS-PAGE and submitted to immunodetection using the anti-FLAG antibody. Input (In) was from the membrane fraction. Data from one representative experiment out of the three performed are shown. The prestained protein standards (Stds) are shown (Left) with the respective molecular mass in kDa. (C) Location of LLS by TEM. An anti-HA colloidal gold-coupled antibody was used to detect LLS on a strain expressing LLS+-HA (HA at the C terminus). (C, Insets) Enlargement of areas of LLS detected at the internal side of the membrane (arrows) and external side of the membrane (arrowheads) and cytoplasm (asterisks). (Scale bars, 200 nm.) (D) Quantification of the total labeling (%) of LLS+ (negative control) and LLS+-HA in the CW, M, and CY compartments obtained from TEM shown in C. Positive signals in the M and CY of the LLS+-HA sample are significantly different from background noise present in the LLS+ sample. Error bars show SEM. Multiple t tests were performed to compare different compartments. M: ***P = 0.000143; CY: ****P = 0.000069. LLS+ n = 106; LLS+-HA n = 59.
Fig. 2.
Fig. 2.
Superresolution imaging of LLS+-HA distribution at the cell membrane. Dual-color superresolution PAINT/dSTORM microscopy was performed on a strain expressing LLS+ (negative control; Left) and a strain expressing LLS+-HA (Right). (A) Protoplasts were fixed and imaged in the DAPI channel (blue). The bacterial membrane was imaged using PAINT with Nile red dye (green). LLS was imaged using dSTORM microscopy with an AF647-conjugated anti-HA monoclonal antibody (red). The images show a large field of view (scale bars, 5 μm) and a magnified view of the dashed white box (scale bars, 1 μm). (B) Ellipses are fitted to Nile red localizations to outline the membrane of manually selected cells. LLS clusters and their centroids were determined from A647 localizations. (Scale bars, 500 nm.) (C) Distribution of signed Euclidian distances between AF647 clusters and ellipses (clusters inside the ellipse have negative distances; clusters outside have positive distances). Mean signed distance is 3 nm. (D) Distribution of the number of LLS clusters per cell: 71% of cells have no LLS cluster; 22, 5, and 1% of bacteria have 1, 2, and 3 LLS clusters, respectively. Data are from n = 357 cells in three fields of view.
Fig. 3.
Fig. 3.
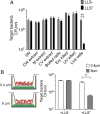
LLS bactericidal activity requires cell–cell contact between a producer and target bacteria. (A) Survival of target bacteria when cocultured with Lm fractions with erythromycin (Ery) or UV light–killed bacteria, and with live Lm. Target bacteria were incubated for 24 h in BHI with LLS-producer bacteria (LLS+) or LLS mutant bacteria (LLS) live cells or fractions, or inactivated bacteria. CFU, colony-forming unit. (B) A coculture was performed using the split-well setup shown (Left). The membrane separating the producer bacteria (LLS+ or LLS) from the target bacteria had a pore size of 8 or 0.4 μm. Data from one representative experiment out of the three performed are shown. Error bars show SEM. Multiple two-tailed unpaired t tests were performed. **P = 0.004066 (A), **P = 0.002921 (B); n = 3.
Fig. 4.
Fig. 4.
LLS inhibits the growth of target cells over time. (A) Schematic representation of microfluidics experiments. Top and side views of the assembled microfluidic device used for single-cell time-lapse microscopy (1). Lm LLS-producer bacteria (LLS+) and Lm LLS mutant bacteria (LLS) express tdTomato constitutively and Lm target bacteria express GFP constitutively from an integrative plasmid (2). Bacteria are trapped between the coverslip and a semipermeable membrane, fed by diffusion of medium, and imaged every 15 min during 10 h (3). Microcolonies of the target and producer bacteria are segmented (mask 1 and mask 2) to obtain the intersection between them (mask 3) which is the signal region of interest (sROI). The reference ROI (ROI, mask 4) includes the target bacteria not in contact with LLS+ or LLS bacteria. The ratio (R) between the ROIs (R = sROI/rROI) was analyzed over time. (B) Time-lapse microscopy snapshots of LLS+ or LLS (tdTomato) and target bacteria (GFP) over time. Data from one representative experiment out of the two performed are shown. (B, Insets) Enlargement of areas of LLS+ in contact with target bacteria; arrowheads show areas where the GFP fluorescence increased. (Scale bars, 3 0μm.) (C) Quantification of green fluorescence intensity of target bacteria in contact with LLS+ or LLS bacteria obtained from R (shown in A) represented as max ratio. Multiple unpaired t tests with Holm–Sidak correction were performed. P values are significant from 8 h, 15 min (**P < 0.01); LLS n = 7; LLS+ n = 13. (D) Quantification of the target cell total area over time. The area is normalized according to the area occupied by LLS+ or LLS bacteria. The area is represented as a percentage of the snapshot total area. Multiple unpaired t tests with Holm–Sidak correction were performed. P values are significant from 6 h, 45 min (**P < 0.01) and from 8 h, 30 min (****P < 0.0001); LLS n = 26; LLS+ n = 33. Error bars show SEM.
Fig. 5.
Fig. 5.
LLS arrests the cell division of target cells in a contact-dependent manner. (A) Growth rate of target bacteria in contact or not with LLS+ bacteria or in contact with LLS bacteria represented in min−1 (k constant). (B) Growth rate of target bacteria in contact with one LLS+ bacterium (one contact site) or more LLS+ bacteria (more than one contact site) represented in min−1 (k constant). The bacteria in contact with one LLS+ bacterium represent 30.5% of the population and do not die. The bacteria in contact with more LLS+ bacteria represent 69.5% of the population and die. The bacterial growth rate (k constant) was calculated by fitting an exponential curve to size measurements over the lifetime of the cells. Data from one representative experiment out of the two performed are shown. Error bars show SEM. Multiple two-tailed unpaired t tests were performed. ****P < 0.0001 (A), **P = 0.0053 (B). (C) Representative time-lapse microscopy snapshots of LLS+ or LLS (tdTomato) and target bacteria (GFP) over time showing the shrinking (arrowheads and white squares) and lysis (arrows) of target cells in contact with LLS+.
Fig. 6.
Fig. 6.
LLS induces cell-membrane permeabilization of the target bacteria that are in contact with LLS-producer bacteria. (A) Time-lapse microscopy enlarged snapshots of LLS+ or LLS and target bacteria over time. Lm LLS-producer bacteria (LLS+) and Lm LLS mutant bacteria (LLS) express tdTomato constitutively and Lm target bacteria express GFP constitutively from an integrative plasmid. BHI medium was perfused for 3 h and then SYTOX blue dye was diluted in PBS and added after 2 h to label dying bacteria. (B) Quantification of SYTOX fluorescence intensity of target bacteria in contact with LLS+ or LLS bacteria obtained from R (shown in Fig. 3A) represented as mean of the SYTOX signal. Data from one representative experiment out of the two performed are shown. (Scale bars, 2 μm.) Error bars show SEM. Multiple unpaired t tests with Holm–Sidak correction were performed. P values are significant from 4 h, 15 min (****P < 0.0001); LLS n = 26; LLS+ n = 32.
Fig. 7.
Fig. 7.
LLS causes cell-membrane depolarization of target bacteria. (A) Three-dimensional reconstructed snapshots showing target bacteria (L. lactis) cultivated alone or with nisin (5 μM), and target bacteria cocultivated with LLS or LLS+ bacteria after different times of coculture. DiBAC4(3) (2.5 μM) was added to BHI when bacteria were inoculated. (B) Percentages of depolarized target cells over time represent the % of target cells that yielded higher DiBAC4(3) fluorescence intensity levels compared with target cells cultivated alone. (C) Quantification of DiBAC4(3) fluorescence intensity of target bacteria is represented as a mean ratio (normalized to the background DiBAC4[3] fluorescence levels). Data from one representative experiment out of three performed are shown. (Scale bars, 1 μm.) Error bars show SEM. Multiple unpaired t tests were performed. Significant P values are indicated by asterisks (*P < 0.05, ***P < 0.001, ****P < 0.0001).

References

    1. Cossart P., Illuminating the landscape of host-pathogen interactions with the bacterium Listeria monocytogenes. Proc. Natl. Acad. Sci. U.S.A. 108, 19484–19491 (2011). - PMC - PubMed
    1. Radoshevich L., Cossart P., Listeria monocytogenes: Towards a complete picture of its physiology and pathogenesis. Nat. Rev. Microbiol. 16, 32–46 (2018). - PubMed
    1. Cotter P. D., et al. ., Listeriolysin S, a novel peptide haemolysin associated with a subset of lineage I Listeria monocytogenes. PLoS Pathog. 4, e1000144 (2008). - PMC - PubMed
    1. Orsi R. H., den Bakker H. C., Wiedmann M., Listeria monocytogenes lineages: Genomics, evolution, ecology, and phenotypic characteristics. Int. J. Med. Microbiol. 301, 79–96 (2011). - PubMed
    1. Clayton E. M., Hill C., Cotter P. D., Ross R. P., Real-time PCR assay to differentiate Listeriolysin S-positive and -negative strains of Listeria monocytogenes. Appl. Environ. Microbiol. 77, 163–171 (2011). - PMC - PubMed

Publication types

MeSH terms

LinkOut - more resources