

Structural origins of Escherichia coli RNA polymerase open promoter complex stability
- PMID: 34599106
- PMCID: PMC8501879
- DOI: 10.1073/pnas.2112877118
Structural origins of Escherichia coli RNA polymerase open promoter complex stability
Abstract
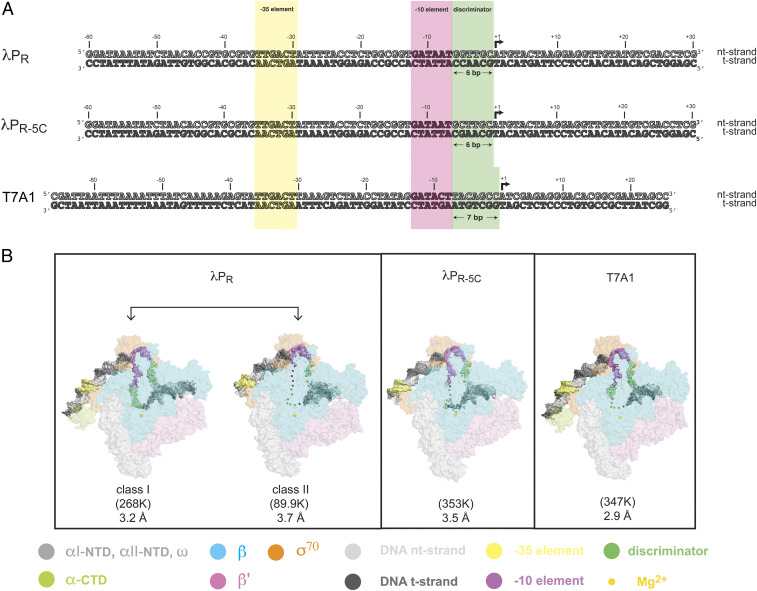
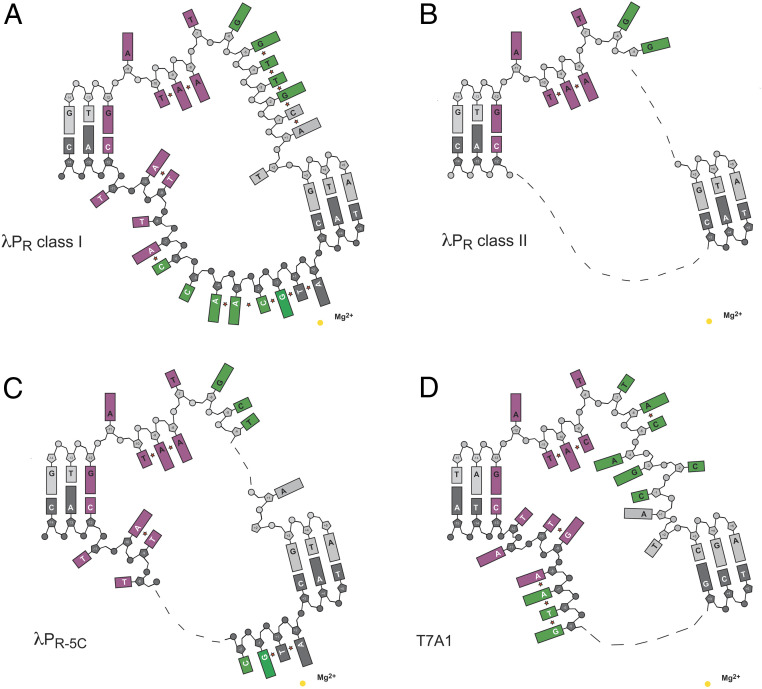
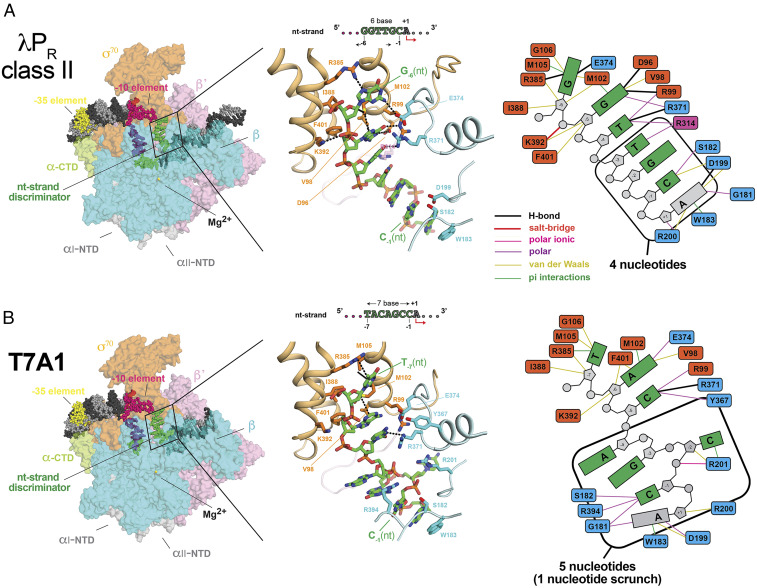
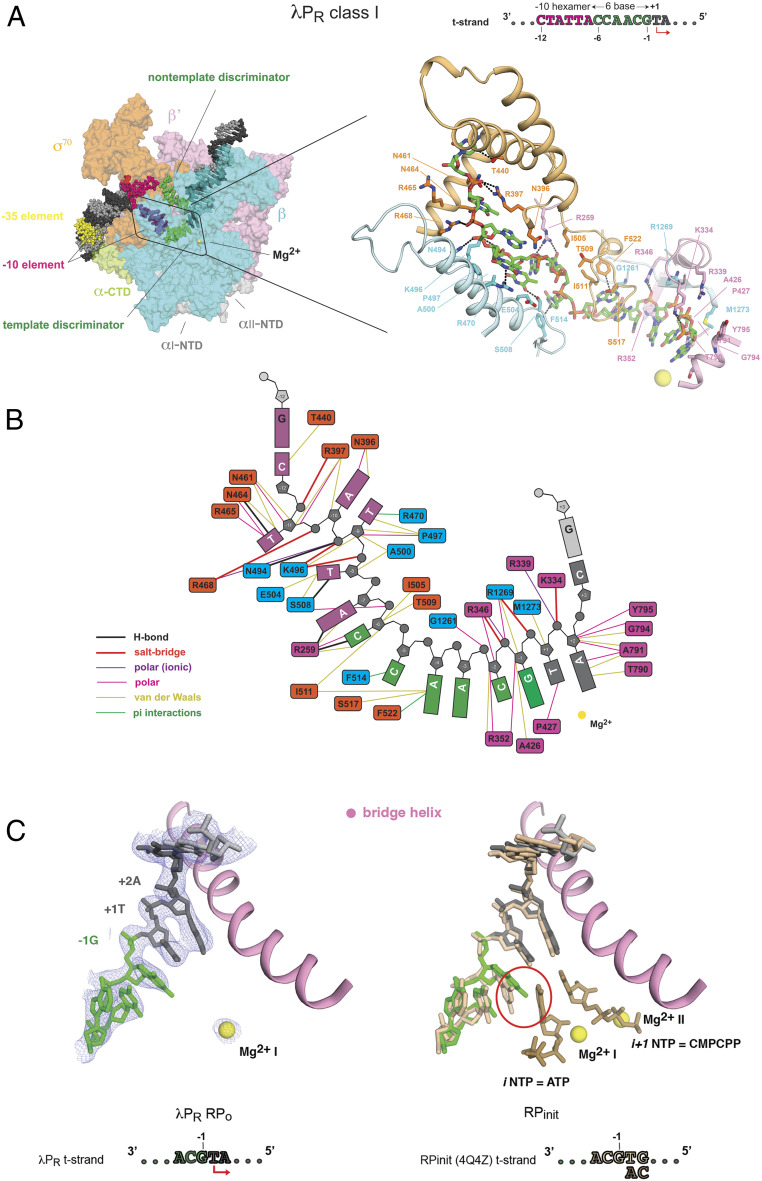
The first step in gene expression in all organisms requires opening the DNA duplex to expose one strand for templated RNA synthesis. In Escherichia coli, promoter DNA sequence fundamentally determines how fast the RNA polymerase (RNAP) forms "open" complexes (RPo), whether RPo persists for seconds or hours, and how quickly RNAP transitions from initiation to elongation. These rates control promoter strength in vivo, but their structural origins remain largely unknown. Here, we use cryoelectron microscopy to determine the structures of RPo formed de novo at three promoters with widely differing lifetimes at 37 °C: λPR (t1/2 ∼10 h), T7A1 (t1/2 ∼4 min), and a point mutant in λPR (λPR-5C) (t1/2 ∼2 h). Two distinct RPo conformers are populated at λPR, likely representing productive and unproductive forms of RPo observed in solution studies. We find that changes in the sequence and length of DNA in the transcription bubble just upstream of the start site (+1) globally alter the network of DNA-RNAP interactions, base stacking, and strand order in the single-stranded DNA of the transcription bubble; these differences propagate beyond the bubble to upstream and downstream DNA. After expanding the transcription bubble by one base (T7A1), the nontemplate strand "scrunches" inside the active site cleft; the template strand bulges outside the cleft at the upstream edge of the bubble. The structures illustrate how limited sequence changes trigger global alterations in the transcription bubble that modulate the RPo lifetime and affect the subsequent steps of the transcription cycle.
Keywords: RNA polymerase; cryo-EM; open complex; promoter DNA; transcription.
Conflict of interest statement
The authors declare no competing interest.
Figures

Similar articles
-
E. coli RNA Polymerase Determinants of Open Complex Lifetime and Structure.J Mol Biol. 2015 Jul 31;427(15):2435-2450. doi: 10.1016/j.jmb.2015.05.024. Epub 2015 Jun 6. J Mol Biol. 2015. PMID: 26055538 Free PMC article.
-
Temperature effects on RNA polymerase initiation kinetics reveal which open complex initiates and that bubble collapse is stepwise.Proc Natl Acad Sci U S A. 2021 Jul 27;118(30):e2021941118. doi: 10.1073/pnas.2021941118. Proc Natl Acad Sci U S A. 2021. PMID: 34290140 Free PMC article.
-
Real-Time Single-Molecule Studies of RNA Polymerase-Promoter Open Complex Formation Reveal Substantial Heterogeneity Along the Promoter-Opening Pathway.J Mol Biol. 2022 Jan 30;434(2):167383. doi: 10.1016/j.jmb.2021.167383. Epub 2021 Dec 1. J Mol Biol. 2022. PMID: 34863780 Free PMC article.
-
Initial events in bacterial transcription initiation.Biomolecules. 2015 May 27;5(2):1035-62. doi: 10.3390/biom5021035. Biomolecules. 2015. PMID: 26023916 Free PMC article. Review.
-
Open complex DNA scrunching: A key to transcription start site selection and promoter escape.Bioessays. 2017 Feb;39(2):10.1002/bies.201600193. doi: 10.1002/bies.201600193. Epub 2017 Jan 4. Bioessays. 2017. PMID: 28052345 Free PMC article. Review.
Cited by
-
Alteration of the -35 and -10 sequences and deletion the upstream sequence of the -35 region of the promoter A1 of the phage T7 in dsDNA confirm the contribution of non-specific interactions with E. coli RNA polymerase to the transcription initiation process.Front Mol Biosci. 2024 Jan 8;10:1335409. doi: 10.3389/fmolb.2023.1335409. eCollection 2023. Front Mol Biosci. 2024. PMID: 38259683 Free PMC article.
-
Structural basis of promoter recognition by Staphylococcus aureus RNA polymerase.Nat Commun. 2024 Jun 6;15(1):4850. doi: 10.1038/s41467-024-49229-6. Nat Commun. 2024. PMID: 38844782 Free PMC article.
-
Mechanism of mammalian transcriptional repression by noncoding RNA.Nat Struct Mol Biol. 2025 Apr;32(4):607-612. doi: 10.1038/s41594-024-01448-7. Epub 2025 Jan 6. Nat Struct Mol Biol. 2025. PMID: 39762629 Free PMC article.
-
Step-by-Step Regulation of Productive and Abortive Transcription Initiation by Pyrophosphorolysis.J Mol Biol. 2022 Jul 15;434(13):167621. doi: 10.1016/j.jmb.2022.167621. Epub 2022 May 6. J Mol Biol. 2022. PMID: 35533764 Free PMC article.
-
Towards a rational approach to promoter engineering: understanding the complexity of transcription initiation in prokaryotes.FEMS Microbiol Rev. 2024 Mar 1;48(2):fuae004. doi: 10.1093/femsre/fuae004. FEMS Microbiol Rev. 2024. PMID: 38383636 Free PMC article. Review.
References
-
- Record M. T. Jr., Reznikoff W. S., Craig M. L., McQuade K. L., Schlax P. J., “Escherichia coli RNA polymerase (Eσ70), promoters, and the kinetics of the steps of transcription initiation” in Escherichia coli and Salmonella typhimurium: Cellular and Molecular Biology (ASM Press, ed. 2, 1996), 1, pp. 792–821.
-
- McClure W. R., Mechanism and control of transcription initiation in prokaryotes. Annu. Rev. Biochem. 54, 171–204 (1985). - PubMed
Publication types
MeSH terms
Substances
Grants and funding
LinkOut - more resources
Full Text Sources
Medical
