. 2021 Oct 1;12(1):5763.
doi: 10.1038/s41467-021-25959-9.

Circadian neurons in the paraventricular nucleus entrain and sustain daily rhythms in glucocorticoids

Affiliations

Circadian neurons in the paraventricular nucleus entrain and sustain daily rhythms in glucocorticoids

Jeff R Jones et al. Nat Commun. .

Abstract

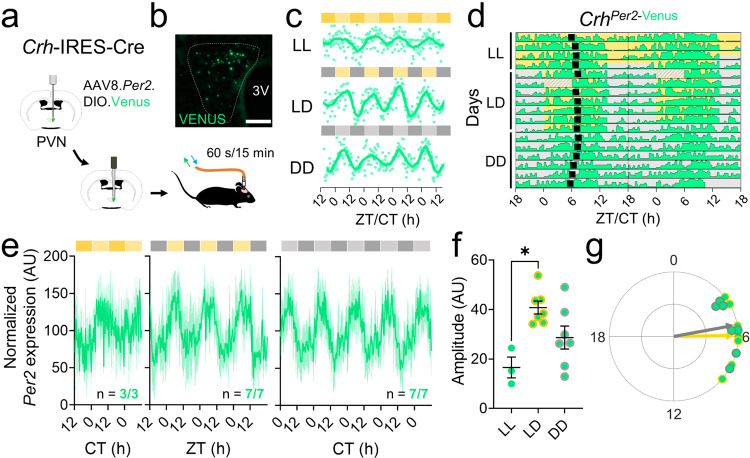
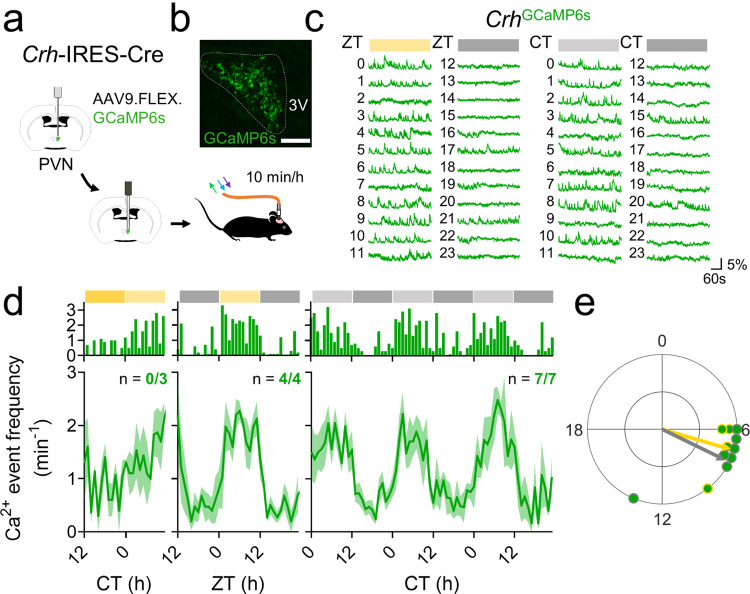
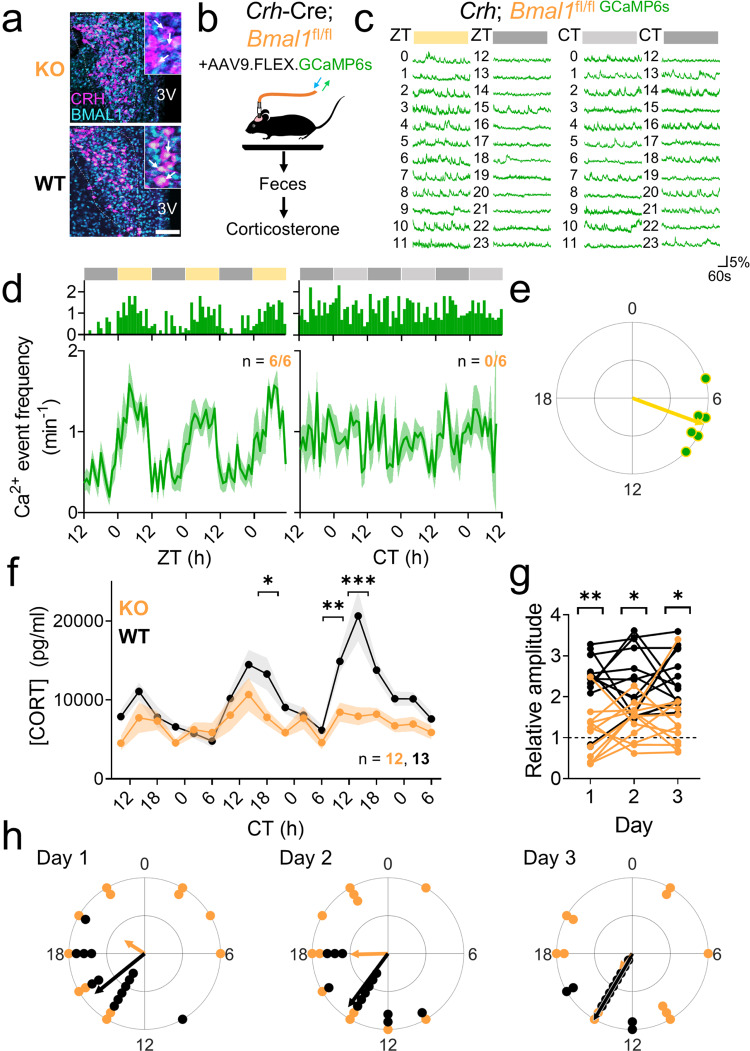
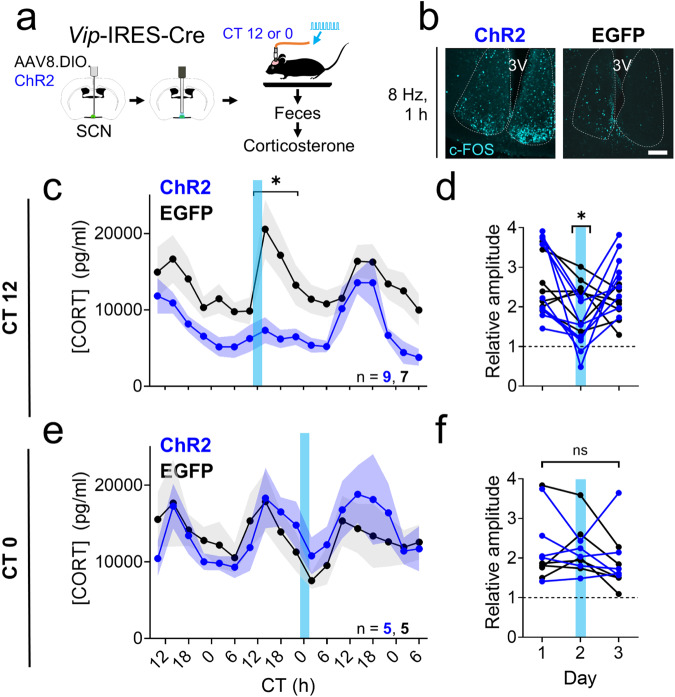
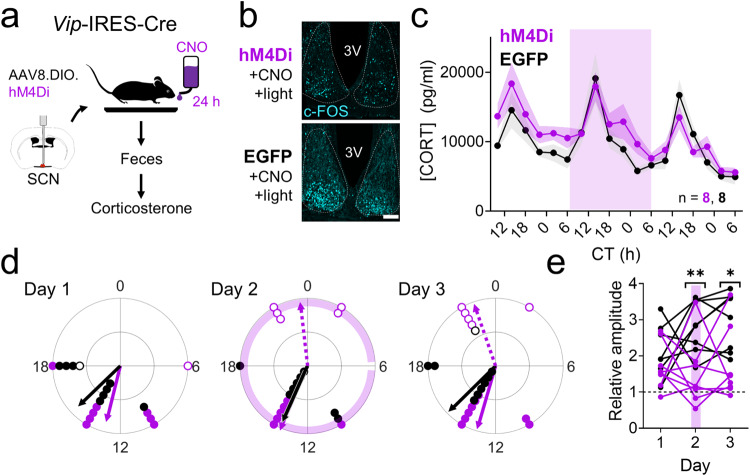
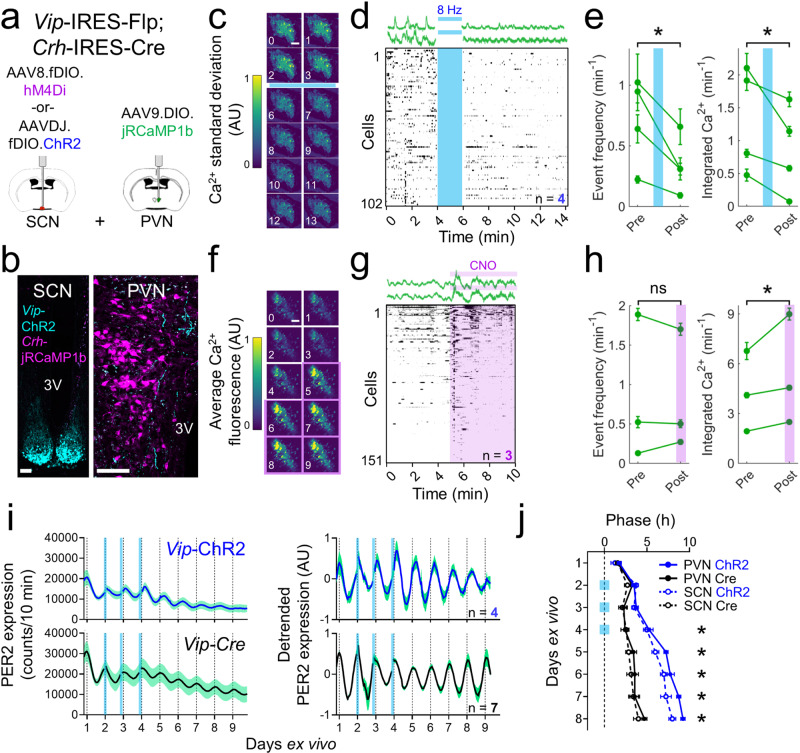
Signals from the central circadian pacemaker, the suprachiasmatic nucleus (SCN), must be decoded to generate daily rhythms in hormone release. Here, we hypothesized that the SCN entrains rhythms in the paraventricular nucleus (PVN) to time the daily release of corticosterone. In vivo recording revealed a critical circuit from SCN vasoactive intestinal peptide (SCNVIP)-producing neurons to PVN corticotropin-releasing hormone (PVNCRH)-producing neurons. PVNCRH neurons peak in clock gene expression around midday and in calcium activity about three hours later. Loss of the clock gene Bmal1 in CRH neurons results in arrhythmic PVNCRH calcium activity and dramatically reduces the amplitude and precision of daily corticosterone release. SCNVIP activation reduces (and inactivation increases) corticosterone release and PVNCRH calcium activity, and daily SCNVIP activation entrains PVN clock gene rhythms by inhibiting PVNCRH neurons. We conclude that daily corticosterone release depends on coordinated clock gene and neuronal activity rhythms in both SCNVIP and PVNCRH neurons.


Conflict of interest statement

The authors declare no competing interests.

Figures

Fig. 1
Fig. 1. PVNCRH neurons exhibit daily rhythms in clock gene expression that peak at midday.
a Schematic of in vivo fiber photometry recording of Per2 expression from targeted cells in the hypothalamic paraventricular nucleus (PVN) of CrhCre/+ mice. b Representative (n = 4 replicates) PVN (dashed line) image depicting Cre-dependent Venus expression (light green). 3 V, third ventricle. Scale bar = 100 µm. c Representative in vivo Per2-Venus fluorescence from PVNCRH neurons averaged over 60 s every 15 min (light green dots) for 4 days from mice housed in constant light (LL), a 12 h:12 h light:dark cycle (LD), or constant darkness (DD). Data were smoothed with a 4 h Savitzky–Golay filter (light green line). ZT zeitgeber time; CT circadian time. d Representative double-plotted actogram of Per2-Venus fluorescence (light green) recorded from PVNCRH neurons in a mouse over 17 days in LL, LD, and DD. Black squares depict daily Per2 acrophases. Recording was interrupted for part of day 6 (hatched rectangle). e Normalized levels of Per2 expression from PVNCRH neurons in mice recorded in LL (dark yellow and yellow bars; n = 3/3 mice rhythmic, JTK cycle, p < 0.020 or less, see Supplementary Table 1 for p-values of individual mice), LD (gray and yellow bars; n = 7/7 mice rhythmic, JTK cycle, p < 0.001 for all mice), and DD (gray and light gray bars; n = 7/7 mice rhythmic, JTK cycle, p < 0.001 for all mice). Light green lines and shading depict mean ± SEM. f The peak-to-trough amplitudes of PVNCRH Per2 rhythms in LL, LD, and DD. n = 3, 7, 7 mice. Brown–Forsythe ANOVA with post-hoc Dunnett’s multiple comparison’s test, p = 0.007. Lines depict mean ± SEM. g Rayleigh plots of Per2 expression in PVNCRH neurons from mice housed in LD (light green dots with yellow outlines; peak time ZT 5.9, Rayleigh test, p = 0.001) and in DD (gray outlines; peak time CT 5.3, Rayleigh test, p = 0.001). In this and other Rayleigh plots, arrows point to the mean time of day when the rhythm peaked, and the length of the arrow indicates variability in the data ranging from 0 (peaked at random times) to 1 (all recordings peaked at the same time). Source data are provided as a Source Data file.
Fig. 2
Fig. 2. PVNCRH neurons exhibit daily rhythms in calcium activity that peak at mid-afternoon.
a Schematic for in vivo fiber photometry recording of calcium activity in the PVN of CrhCre/+ mice. b Representative (n = 4 replicates) PVN (dashed line) image depicting Cre-dependent GCaMP6s expression (green). 3V third ventricle. Scale bar = 100 µm. c Representative GCaMP6s traces (in ΔF/F) from PVNCRH neurons recorded hourly from a mouse in LD (12 h:12 h light:dark cycle; left plot, where yellow = light phase) and another in DD (constant darkness; right plot, where light gray = subjective day). ZT zeitgeber time; CT circadian time. d Calcium event frequency rhythms from PVNCRH neurons in mice recorded in LL (constant light; n = 0/3 mice rhythmic, JTK cycle, p > 0.050 for all mice, see Supplementary Table 1 for p-values of individual mice), LD (n = 4/4 mice rhythmic, JTK cycle, p < 0.001 for all mice) and in DD (n = 7/7 mice rhythmic, JTK cycle, p < 0.030 or less, see Supplementary Table 1 for p-values of individual mice). Top, event frequency rhythms from a representative mouse; bottom, event frequency rhythms averaged from multiple mice. Green lines and shading depict mean ± SEM. e Rayleigh plots of calcium event frequency rhythms in PVNCRH neurons from mice housed in LD (green dots with yellow outlines; peak time ZT 7.1, p = 0.019) and in DD (gray outlines; peak time CT 7.7, Rayleigh test, p = 0.003). Source data are provided as a Source Data file.
Fig. 3
Fig. 3. Ablation of BMAL1 in CRH neurons blunts and desynchronizes circadian rhythms in calcium activity and corticosterone.
a Representative (n = 4 replicates) PVN (dashed line) immunohistochemistry images from CrhCre/Cre; Bmal1fl/fl (KO, top) and CrhCre/+; Bmal1fl/fl (WT, bottom) mice depicting CRH (magenta) and BMAL1 (cyan) expression. 3V third ventricle. Scale bar = 100 µm. Inset, higher magnification image. b Schematic of fiber photometry and fecal corticosterone collection. c Representative GCaMP6s traces (in ΔF/F) from PVNCRH neurons recorded hourly from a KO mouse in LD (12 h:12 h light:dark cycle; left plot, where yellow = light phase) and in DD (constant darkness; right plot, where light gray = subjective day). ZT zeitgeber time, CT circadian time. d Calcium event frequency rhythms from PVNCRH neurons in KO mice recorded in LD (n = 6/6 mice rhythmic, JTK cycle, p < 0.040 or less, see Supplementary Table 1 for p-values of individual mice) and in DD (n = 0/6 mice rhythmic, JTK cycle, p > 0.050 for all mice, see Supplementary Table 1 for p-values of individual mice). Top, event frequency rhythms from a representative mouse; bottom, event frequency rhythms averaged from multiple mice. Green lines and shading depict mean ± SEM. e Rayleigh plots of calcium event frequency rhythms in PVNCRH neurons from KO mice housed in LD (green dots with yellow outlines; peak time ZT 7.3, Rayleigh test, p = 0.001; KO vs. WT peak time Watson–Williams test, p = 0.796). Arrhythmic recordings from KO mice housed in DD are not depicted. f Corticosterone rhythms over 3 days in WT (black, n = 13) and KO mice (orange, n = 12). Lines and shading depict mean ± SEM. Mixed-effects model with post-hoc Sidak’s multiple comparisons test, *p = 0.041, **p = 0.009, ***p < 0.001. g The relative amplitude of the corticosterone rhythm (the ratio of the average level at CT 10-18 divided by the average at CT 22-6) in WT (black) and KO (orange) mice on each day of collection. Two-way repeated-measures ANOVA with post-hoc Sidak’s multiple comparisons test, *p = 0.002, ***p < 0.001. h Rayleigh plots of corticosterone rhythms in WT (black dots, peak times Days 1–3 CTs 15.3, 14.4, 14.2, Rayleigh test, p < 0.001 on each day) and KO (orange, no significant clustering on any day, Rayleigh test, p = 0.427, 0.101, 0.720 on days 1, 2, and 3, respectively) mice on each day of collection. Phases differed significantly between genotypes (two-way circular ANOVA, p < 0.001). Source data are provided as a Source Data file.
Fig. 4
Fig. 4. Acute activation of SCNVIP neurons blunts circadian rhythms in corticosterone depending on the time of day of stimulation.
a Schematic for concurrent SCN stimulation and fecal corticosterone collection. b c-FOS immunoreactivity (n = 4 replicates, cyan) after SCN stimulation at CT (circadian time) 12 in VipCre/+ + ChR2 (ChR2, left) and VipCre/+ + EGFP (EGFP, right) mice. 3V third ventricle. Scale bar = 100 µm. c Corticosterone rhythms over three days in EGFP (black, n = 7) and ChR2 mice (blue, n = 9). Lines and shading depict mean ± SEM. Blue bar, time of optogenetic stimulation (8 Hz, 10 ms, 470 nm, 2 h from CT 11-13). Mixed-effects model with post-hoc Sidak’s multiple comparisons test, *p < 0.001. d The relative amplitude of the corticosterone rhythm (the ratio of the average level at CT 10-18 divided by the average at CT 22-6) in EGFP (black) and ChR2 (blue) mice on each day of collection. Blue line depicts the day of optogenetic stimulation from CT 11-13. Two-way repeated-measures ANOVA with post-hoc Sidak’s multiple comparisons test, p = 0.043. e Corticosterone rhythms over 3 days in EGFP (black, n = 5) and ChR2 mice (blue, n = 5). Lines and shading depict mean ± SEM. Blue bar, time of optogenetic stimulation (8 Hz, 10 ms, 470 nm, 2 h from CT 23-1). Mixed-effects model, p = 0.929. f The peak-trough amplitude of the corticosterone rhythm in EGFP (black) and ChR2 (blue) mice on each day of collection. Blue line depicts the day of optogenetic stimulation from CT 23-1. Two-way repeated-measures ANOVA, p = 0.054. Source data are provided as a Source Data file.
Fig. 5
Fig. 5. Silencing of SCNVIP neurons augments circadian rhythms in corticosterone during the early morning.
a Schematic for fecal corticosterone collection and chemogenetic SCN inhibition. b c-FOS immunoreactivity (n = 4 replicates, cyan) after clozapine-N-oxide (CNO) administration 30 min before a 15 min light pulse at CT (circadian time) 12 in VipCre/+ + hM4Di (hM4Di, top) and VipCre/+ + EGFP (EGFP, bottom) mice. 3V third ventricle. Scale bar = 100 µm. c Corticosterone rhythms over three days in EGFP (black, n = 8) and hM4Di mice (purple, n = 8). Lines and shading depict mean ± SEM. Purple shading, time of ad libitum exposure to CNO in the drinking water. Mixed-effects model, p = 0.066. d Rayleigh plots of the first (filled dots, solid lines) and second (open dots, dashed lines) corticosterone peaks in EGFP (black, first peak times days 1–3 CTs 15.0, 13.5, 14.9, Rayleigh test, p = 0.004, 0.002, <0.001 on days 1, 2, and 3, respectively; no significant second peak times) and hM4Di (purple, first peak times days 1–3 CTs 12.9, 13.5, 13.1, Rayleigh test, p = 0.004, <0.001, <0.001 on days 1, 2, and 3, respectively; second peak times days 2–3 CTs 23.6, 22.7, Rayleigh test, p = 0.013, 0.007 on days 2 and 3, respectively) mice on each day of collection. e The relative amplitude of the corticosterone rhythm (the ratio of the peak level at CT 10-18 divided by the peak level at CT 22-6) in EGFP (black) and hM4Di (purple) mice on each day of collection. Purple line depicts the day of ad libitum exposure to CNO in the drinking water for 24 h. Two-way repeated-measures ANOVA with post-hoc Sidak’s multiple comparisons test, *p = 0.010, **p = 0.006. Source data are provided as a Source Data file.
Fig. 6
Fig. 6. SCNVIP neurons inhibit PVNCRH neuron activity and shift PVN clock gene rhythms.
a Schematic for simultaneous SCNVIP neuron manipulation and PVNCRH neuron calcium imaging. b Representative (n = 4 replicates) images from a VipFlp/+; CrhCre/+ mouse showing concurrent Flp-dependent ChR2 (cyan) and Cre-dependent jRCaMP1b (magenta) expression. 3V third ventricle. Scale bar = 100 µm. c The change in calcium fluorescence over each minute of recording in an individual ex vivo PVN slice before and after stimulation (blue bar; 470 nm, 8 Hz, 10 ms pulse width, 2 min duration) around subjective dusk (circadian time (CT) 11-12). Warmer colors represent a greater change in calcium fluorescence. d Top, representative calcium traces (in ΔF/F) from two PVNCRH neurons recorded before and after stimulation. Bottom, raster plot depicting PVNCRH neuron calcium activity in individual neurons before and after SCNVIP stimulation (n = 102 cells, 4 slices). Raster plot was thresholded to show the upper 50% ΔF/F of each trace for visualization. e Calcium event frequency and integrated calcium levels in PVNCRH neurons in each PVN slice (green lines, mean ± SEM) before and after SCNVIP stimulation (blue line). Two-way repeated-measures ANOVA, p < 0.001 for event frequency and integrated calcium levels. f The average calcium fluorescence over each minute of recording in an individual ex vivo PVN slice before and during clozapine-N-oxide (CNO) treatment (purple shading, 1 µl of 10 µM CNO) around subjective afternoon (CT 6-8). Warmer colors represent increased calcium fluorescence. g Top, representative calcium traces from two PVNCRH neurons recorded before and during CNO treatment. Bottom, raster plot depicting PVNCRH neuron calcium activity in individual neurons before and after CNO treatment (n = 151 cells, 3 slices). h Calcium event frequency and integrated calcium levels in PVNCRH neurons in each PVN slice (green lines, mean ± SEM) before and during SCNVIP inhibition (purple shading). Two-way repeated-measures ANOVA, p < 0.001 for integrated calcium levels, p = 0.345 for event frequency. i (Left) Raw and (right) detrended PER2::LUC bioluminescence traces from the PVN of VipCre/+; PER2LUC/+ (black, n = 6) and VipCre/+; Ai32fl/+; PER2LUC/+ (blue, n = 4) mice stimulated for 1 h per day for 3 d (blue bars, 8 Hz, 470 nm, 10 ms). j Peak times of PER2::LUC bioluminescence in PVN (solid circles and lines) and SCN (open circles, dashed lines) slices from Vip-ChR2 (blue) and Vip-Cre (black) mice before, during, and after daily optogenetic stimulation (blue squares). Peak times between ChR2 and control PVN were significantly different on days 4–8 (Two-way circular ANOVA, p < 0.001 on each day). Source data are provided as a Source Data file.

References

    1. Kalsbeek A, et al. SCN outputs and the hypothalamic balance of life. J. Biol. Rhythms. 2006;21:458–469. doi: 10.1177/0748730406293854. - DOI - PubMed
    1. Neumann AM, Schmidt CX, Brockmann RM, Oster H. Circadian regulation of endocrine systems. Auton. Neurosci. Basic Clin. 2019;216:1–8. doi: 10.1016/j.autneu.2018.10.001. - DOI - PubMed
    1. Colwell CS. Linking neural activity and molecular oscillations in the SCN. Nat. Rev. Neurosci. 2011;12:553–569. doi: 10.1038/nrn3086. - DOI - PMC - PubMed
    1. Herzog, E. D., Hermanstyne, T., Smyllie, N. J., & Hastings, M. H. Regulating the suprachiasmatic nucleus (SCN) circadian clockwork: Interplay between cell- autonomous and circuit-level mechanisms. Cold Spring Harb. Perspect. Biol.9, a027706 (2017). - PMC - PubMed
    1. Abe K, Kroning J, Greer MA, Critchlow V. Effects of destruction of the suprachiasmatic nuclei on the circadian rhythms in plasma corticosterone, body temperature, feeding and plasma thyrotropin. Neuroendocrinology. 1979;29:119–131. doi: 10.1159/000122913. - DOI - PubMed

Publication types

MeSH terms