. 2021 Oct 1;12(1):5759.
doi: 10.1038/s41467-021-25910-y.

Geographical drivers and climate-linked dynamics of Lassa fever in Nigeria

Affiliations

Geographical drivers and climate-linked dynamics of Lassa fever in Nigeria

David W Redding et al. Nat Commun. .

Abstract

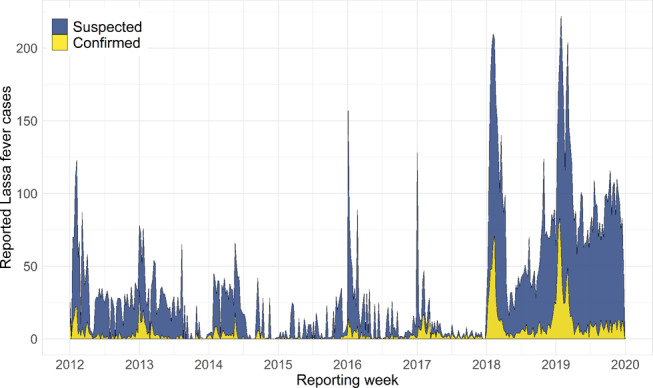
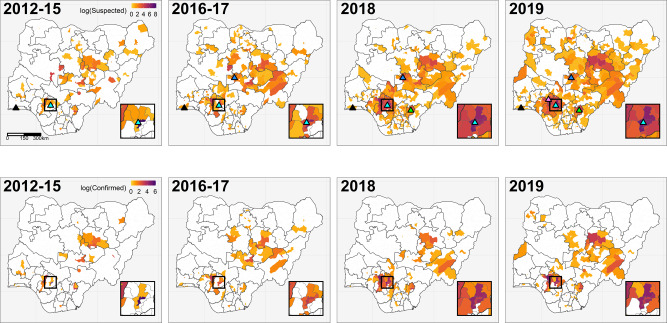
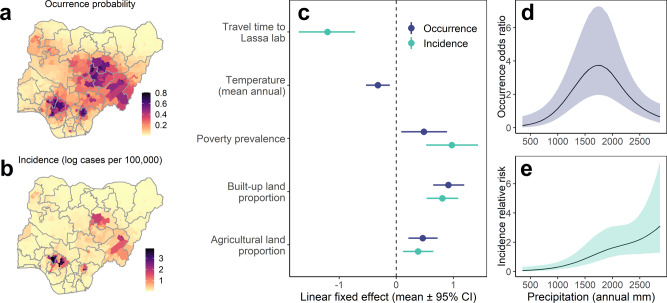
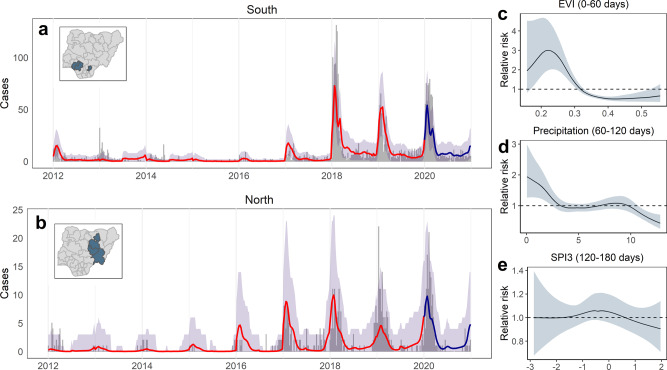
Lassa fever is a longstanding public health concern in West Africa. Recent molecular studies have confirmed the fundamental role of the rodent host (Mastomys natalensis) in driving human infections, but control and prevention efforts remain hampered by a limited baseline understanding of the disease's true incidence, geographical distribution and underlying drivers. Here, we show that Lassa fever occurrence and incidence is influenced by climate, poverty, agriculture and urbanisation factors. However, heterogeneous reporting processes and diagnostic laboratory access also appear to be important drivers of the patchy distribution of observed disease incidence. Using spatiotemporal predictive models we show that including climatic variability added retrospective predictive value over a baseline model (11% decrease in out-of-sample predictive error). However, predictions for 2020 show that a climate-driven model performs similarly overall to the baseline model. Overall, with ongoing improvements in surveillance there may be potential for forecasting Lassa fever incidence to inform health planning.


Conflict of interest statement

The authors declare no competing interests.

Figures

Fig. 1
Fig. 1. Temporal trends in country-wide Lassa fever case reporting from 2012 to 2019.
Polygon height shows the weekly total cases reported across Nigeria, with colour denoting the proportion of cases that were laboratory-confirmed (yellow) or suspected (blue). The full case time series was compiled from two reporting regimes at the Nigeria Centre for Disease Control: Weekly Epidemiological Reports 2012 to 2016, and Lassa Fever Technical Working Group Situation Reports 2017 to 2019 (with case reports followed-up to ensure more accurate counts; datasets shown separately in Supplementary Fig. 1). A full description of case definitions and reporting protocols is provided in Methods.
Fig. 2
Fig. 2. Spatiotemporal trends in Lassa fever surveillance, confirmed cases, and diagnostic laboratory capacity across Nigeria.
Maps show, on the natural log scale, the total reported Lassa fever cases (suspected and confirmed; top row) and laboratory-confirmed cases only (bottom row) in each local government authority during the specified year(s). Triangles in the top row show the locations of laboratories with Lassa fever diagnostic capacity. Irrua Specialist Teaching Hospital (Edo, established 2008; inset box, pale blue) and Lagos University Teaching Hospital (Lagos, southwest; black) were both operational since before 2012. Three further laboratories became operational during the study period: Abuja National Reference Laboratory in 2017 (FCT Abuja, north-central; dark blue), Federal Teaching Hospital Abakaliki in 2018 (Ebonyi, southeast; green), and Federal Medical Centre Owo in 2019 (Ondo, south, purple).
Fig. 3
Fig. 3. Spatial distribution and correlates of annual Lassa fever occurrence and incidence (2016 to 2019) at local government authority level across Nigeria.
Maps show fitted probability of LF occurrence (a) and incidence (b; cases per 100,000 persons, visualised on the natural log scale) for 774 LGAs in 2019. Points and error-bars (c) show socio-ecological linear fixed-effects parameter estimates (posterior mean and 95% credible interval) for best-fitting models of Lassa fever occurrence (dark blue; log odds scale) and incidence (pale green, log scale) (n = 3096 observations). Linear covariates were centred and scaled before fitting, so parameters measure the effect of 1 scaled unit change in the covariate (1 standard deviation) on either log odds of occurrence or log incidence. Curves show nonlinear effects of total annual precipitation on LF occurrence (odds ratio; d) and incidence (relative risk; e), specified and fitted as second-order random walks. Models included spatiotemporally structured random effects (LGA per year) to account for geographical heterogeneity and expansion of reporting effort (Methods) and were robust to cross-validation tests (Supplementary Fig. 3) and modelling at lower spatial resolution (Supplementary Fig. 4).
Fig. 4
Fig. 4. Modelled temporal dynamics and drivers of confirmed Lassa fever cases in the south and north Nigeria.
Case time series show observed and out-of-sample (OOS) predicted weekly case counts from a climate-driven model (n = 2820), summed across all states in the southern (a; Edo and Ondo states) and northern (b; Bauchi, Plateau and Taraba states) endemic areas to visualise regional differences. Time series graphs (a, b) show observed counts from 2012 to 2019 (grey bars), OOS posterior median predicted cases (red line) and OOS 95% (grey shading) posterior predictive intervals (both calculated from 2500 samples drawn from the joint posterior). OOS predictions were made while holding out sequential 6-month windows across the full time series at state-level (Supplementary Fig. 8). The dark blue line and shaded area in 2020 shows prospective predicted cases (median and 95% predictive interval) compared to observed cases from this period, which were not included in model fitting (Methods). Inset maps show states included in the models. Panels show nonlinear fitted effects of Enhanced Vegetation Index (EVI) (c), mean daily precipitation (d), and 3-month Standardised Precipitation Index (SPI3; e) on relative risk, showing posterior mean and 95% credible interval. The marginal contributions of yearly, seasonal and climatic effects are visualised separately in Supplementary Fig. 7.

References

    1. Nigeria Centre for Disease Control. Lassa fever Situation Report, 12 April 2020. (NCDC, 2020).
    1. Ipadeola O, et al. Epidemiology and case-control study of Lassa fever outbreak in Nigeria from 2018 to 2019. J. Infect. 2020;80:578–606. doi: 10.1016/j.jinf.2019.12.020. - DOI - PubMed
    1. Rottingen J, et al. New vaccines against epidemic infectious diseases. N. Engl. J. Med. 2017;376:610–613. doi: 10.1056/NEJMp1613577. - DOI - PubMed
    1. Gibb R, Moses LM, Redding DW, Jones KE. Understanding the cryptic nature of Lassa fever in West Africa. Pathog. Glob. Health. 2017;111:276–288. doi: 10.1080/20477724.2017.1369643. - DOI - PMC - PubMed
    1. Siddle, K. J. et al. Genomic analysis of Lassa virus during an increase in cases in Nigeria in 2018. N. Engl. J. Med. 10.1056/NEJMoa1804498 (2018). - PMC - PubMed

Publication types