. 2021 Oct 1;12(1):5772.
doi: 10.1038/s41467-021-26061-w.

Ring finger protein 213 assembles into a sensor for ISGylated proteins with antimicrobial activity

Affiliations

Ring finger protein 213 assembles into a sensor for ISGylated proteins with antimicrobial activity

Fabien Thery et al. Nat Commun. .

Abstract

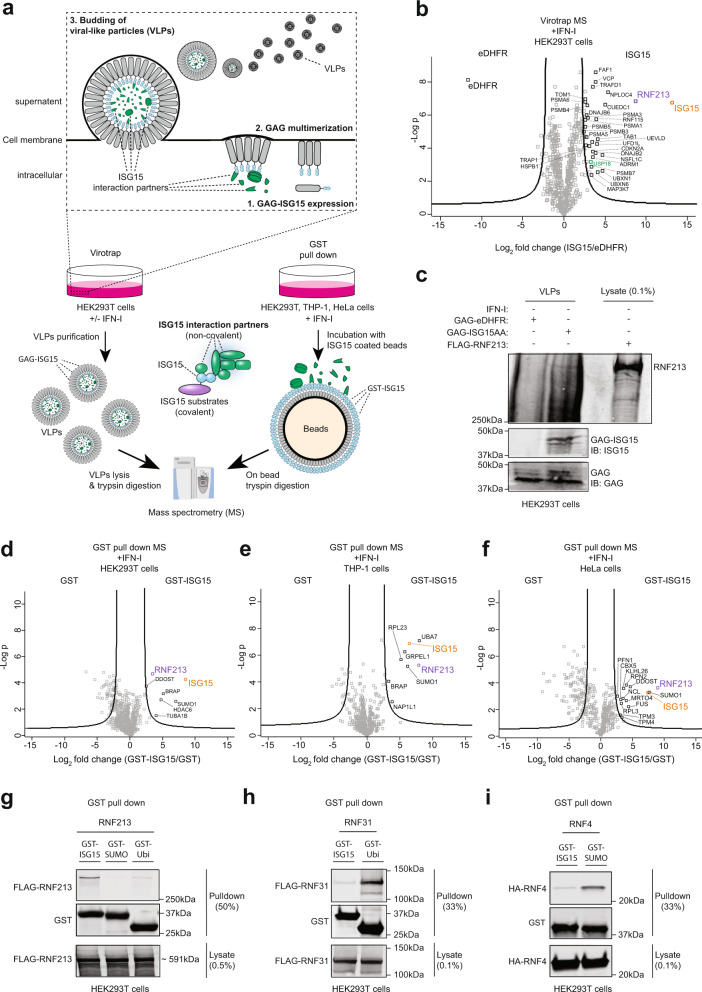
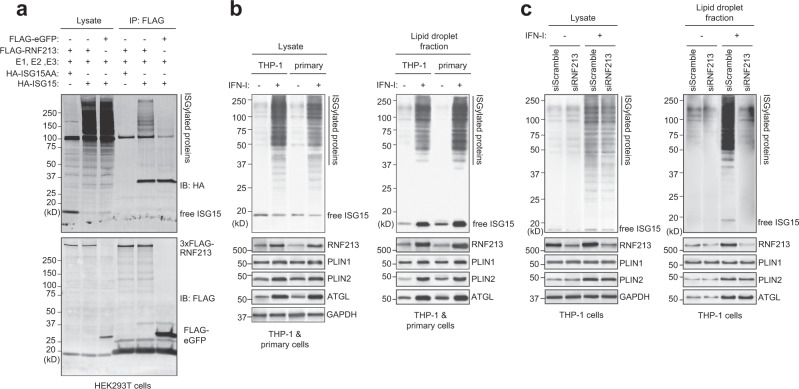
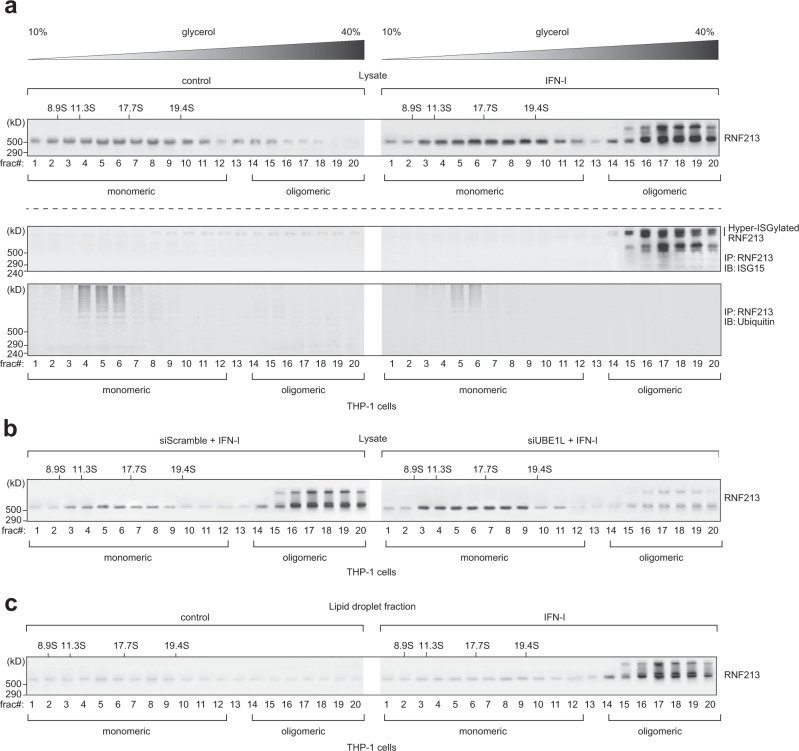
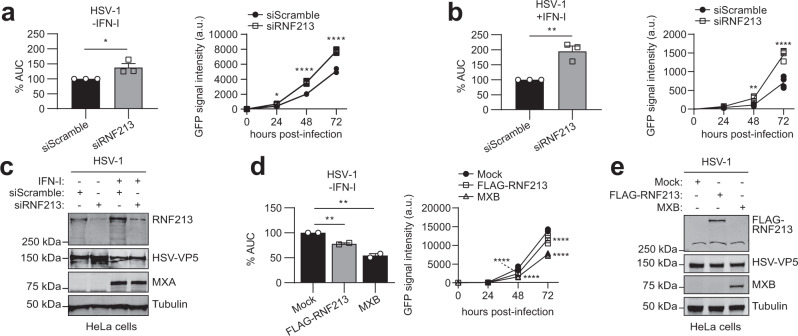
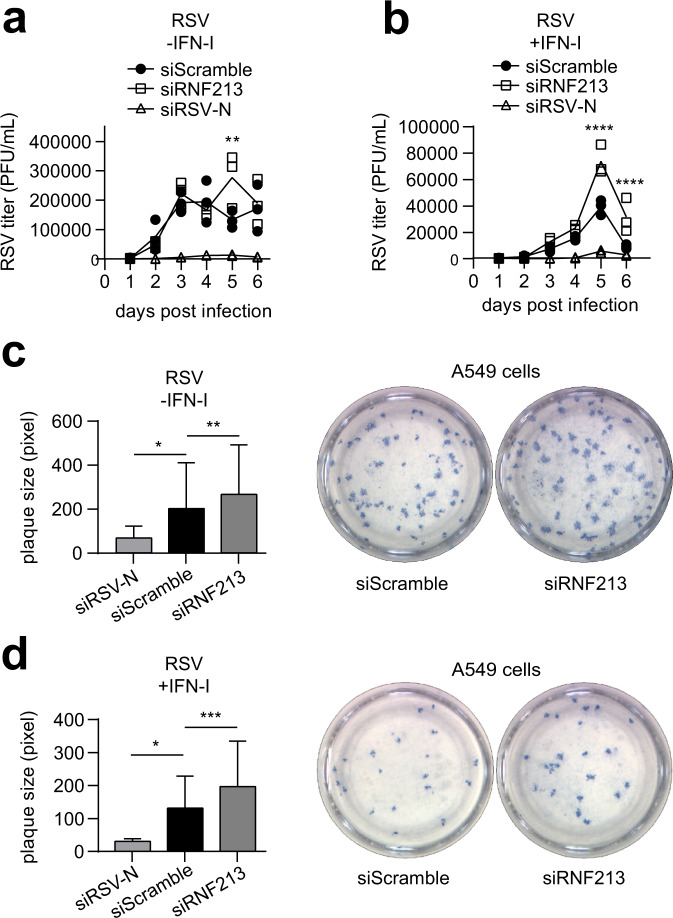
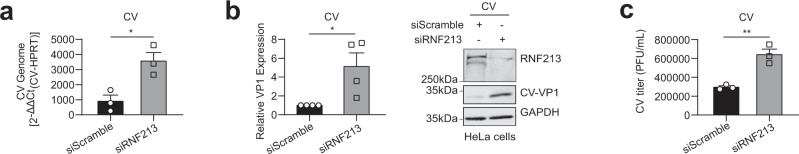
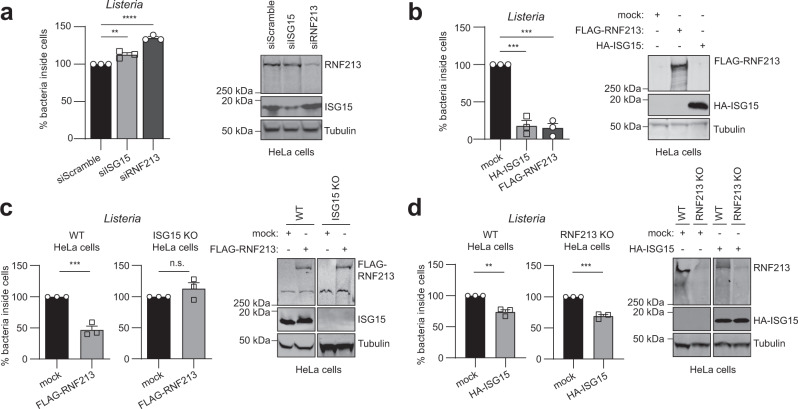
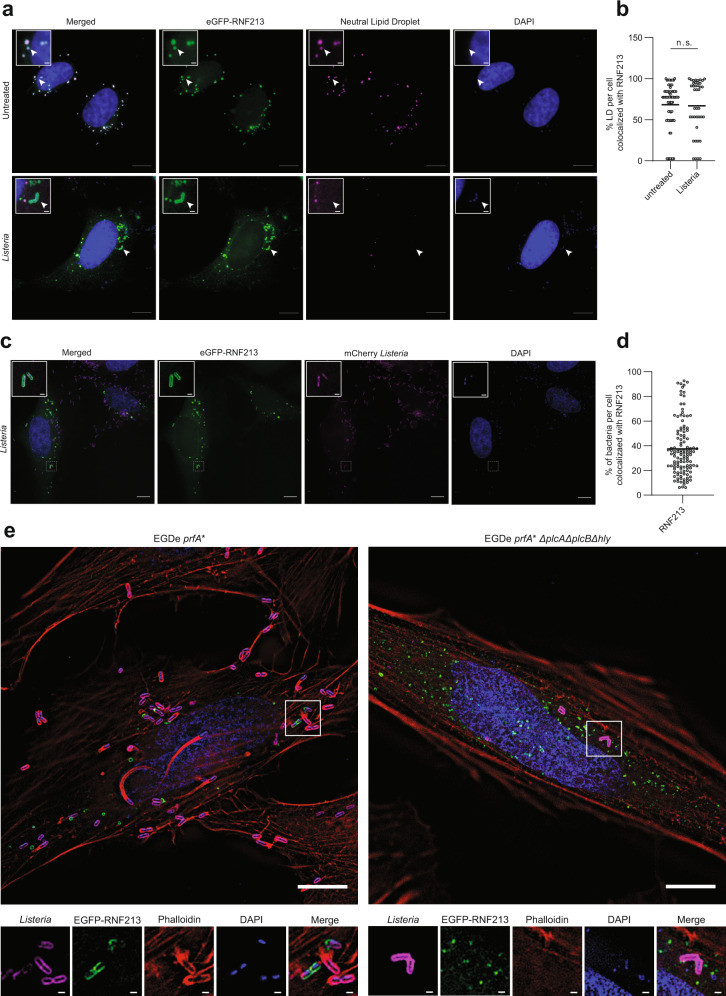
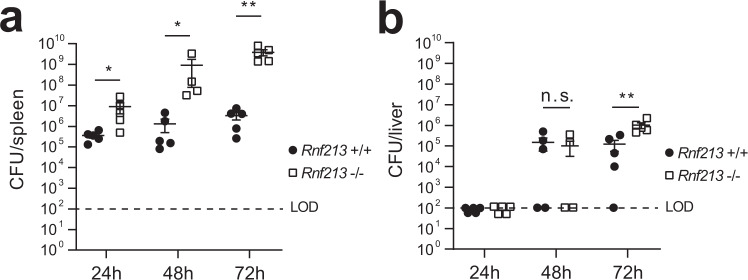
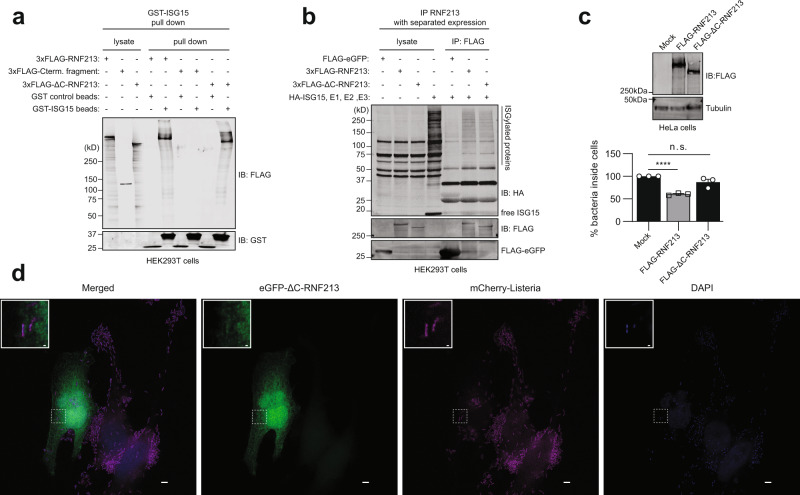
ISG15 is an interferon-stimulated, ubiquitin-like protein that can conjugate to substrate proteins (ISGylation) to counteract microbial infection, but the underlying mechanisms remain elusive. Here, we use a virus-like particle trapping technology to identify ISG15-binding proteins and discover Ring Finger Protein 213 (RNF213) as an ISG15 interactor and cellular sensor of ISGylated proteins. RNF213 is a poorly characterized, interferon-induced megaprotein that is frequently mutated in Moyamoya disease, a rare cerebrovascular disorder. We report that interferon induces ISGylation and oligomerization of RNF213 on lipid droplets, where it acts as a sensor for ISGylated proteins. We show that RNF213 has broad antimicrobial activity in vitro and in vivo, counteracting infection with Listeria monocytogenes, herpes simplex virus 1, human respiratory syncytial virus and coxsackievirus B3, and we observe a striking co-localization of RNF213 with intracellular bacteria. Together, our findings provide molecular insights into the ISGylation pathway and reveal RNF213 as a key antimicrobial effector.


Conflict of interest statement

The authors declare no competing interests.

Figures

Fig. 1
Fig. 1. Identification of RNF213 as ISG15-binding protein.
a Workflow to map ISG15 interaction partners. Virotrap and Glutathione-S-Transferase (GST) pull-down were employed as two orthogonal methods. In Virotrap, GAG-ISG15 was expressed in HEK293T cells. Twenty four hours post-transfection, cells were treated with interferon (IFN)-α for 24 h of left untreated. Budding virus-like particles (VLPs) containing ISG15 and its interaction partners were purified, lysed and digested into peptides prior to LC-MS/MS analysis. In GST pull-down, glutathione beads were decorated with GST-ISG15 and mixed with a cellular lysate from HEK293T, HeLa, or THP-1 cells. Prior to lysis cells were treated for 24 h with interferon-α (HEK293T) or interferon-β (HeLa and THP-1). Following on-bead digestion, the resulting peptides were analyzed by LC-MS/MS. b Volcano plot showing the result of a t-test to compare VLPs containing mature ISG15 versus VLPs containing dihydrofolate reductase from Escherichia coli (eDHFR) as negative control (n = 4 replicates). Proteins outside the curved lines represent specific ISG15 interaction partners. Proteins identified as ISG15 interaction partners in all virotrap screens are annotated (n = 29) and listed in Supplementary Data 1. c VLPs containing ISG15 or eDHFR were collected and analyzed by immunoblot (IB) against RNF213, ISG15, and GAG. FLAG-RNF213 purified from a lysate of HEK293T cells was loaded as a positive control and confirmed the presence of an RNF213 band in the ISG15 VLPs. d–f Volcano plots comparing GST pulldowns using GST-ISG15-coated beads with GST-coated beads as control in lysates of HEK293T, THP-1, and HeLa cells (n = 3). Proteins significantly enriched in PDs with ISG15-coated beads are annotated. g GST PDs with ISG15, ubiquitin, and SUMO followed by immunoblotting show binding of RNF213 to ISG15, but not to ubiquitin or SUMO. Beads coated with each UBL were mixed with a lysate of HEK293T cells expressing FLAG-RNF213 and bound proteins were analyzed by immunoblot against FLAG and GST. h, i Validation of GST PD assays with ubiquitin and SUMO using RNF31 and RNF4 as known binders of these UBLs, respectively. Assays were performed as in g. Source data are provided as a Source Data file.
Fig. 2
Fig. 2. RNF213 binds ISGylated proteins on lipid droplets.
a FLAG immunoprecipitation (IP) was performed from lysates of HEK293T cells expressing FLAG-RNF213 or FLAG-eGFP in combination with HA-ISG15(AA) and the ISGylation machinery (E1, E2, E3). A smear of ISGylated co-immunoprecipitated proteins was detected with FLAG-RNF213, but not with FLAG-eGFP or when nonconjugatable HA-ISG15AA was used. b. THP-1 or primary human monocytes (CD14+) cells were cultured in the presence of 10 mM BSA-conjugated oleic acid and either treated with 10 ng/mL interferon (IFN) -β for 8 h or left untreated. Lipid droplets (LDs)-enriched fractions were isolated by ultracentrifugation floatation assay on a sucrose step-gradient. Immunoblot (IB) against RNF213 and ISG15 revealed an interferon-induced upregulation of both proteins on LDs and a smear of ISGylated proteins associated with LDs. Immunoblots against PLIN1, PLIN2, ATGL, and GAPDH confirmed LD isolation and equal protein loading in the lysate and LD-enriched fraction (1/20th of the lysate and all of the LD-enriched material was loaded). c Similarly, LDs were isolated from THP-1 cells after knockdown of RNF213 by siRNA (siRNF213) treatment for 48 h or using a nontargeting scrambled siRNA (siScramble) as control. Immunoblotting against ISG15 revealed a smear of ISGylated proteins associated with LDs only when RNF213 was present. Immunoblotting against RNF213 confirmed knockdown of RNF213, while PLIN1, PLIN2, ATGL, and GAPDH validated LD isolation and equal protein loading in the lysate and the LD-enriched fraction (1/20th of the lysate and all of the LD-enriched material was loaded). Source data are provided as a Source Data file.
Fig. 3
Fig. 3. Type I interferon induces RNF213 ISGylation and oligomerization on lipid droplets.
a THP-1 cells were treated with interferon (IFN)-β for 8 h or left untreated. Lysates were separated by density gradient ultracentrifugation on glycerol gradients (10–40% (v/v), Svedberg constants of the standard markers are indicated above the blots) to isolate the monomeric versus oligomeric form of RNF213. Twenty fractions (frac#) for each sample were collected, concentrated by TCA precipitation and analyzed by immunoblotting against RNF213, showing the presence of oligomer RNF213 in fraction 14–20 upon interferon treatment (upper panel). Alternatively, RNF213 was immunoprecipitated (IP) from each fraction, first desalted over Amicon columns. Immunoprecipitated material was eluted into loading buffer and analyzed by immunoblotting against ISG15 and ubiquitin, showing (hyper)ISGylation of oligomer RNF213 upon interferon treatment (lower panel). b The monomeric and oligomeric forms of RNF213 were separated by density gradient ultracentrifugation after interferon-β treatment as in a and knockdown of UBE1L by siRNA (siUBE1L) treatment for 48 h, using a nontargeting scrambled siRNA (siScramble) as control. Knockdown of UBE1L strongly reduced RNF213 oligomerization upon interferon treatment. c LDs were isolated by ultracentrifugation floatation assay on a sucrose step-gradient and associated proteins were further separated by density gradient ultracentrifugation to isolate the monomeric and oligomeric form of RNF213 after interferon-β treatment as in a. Fractions were concentrated by TCA precipitation and analyzed by immunoblotting against RNF213, showing association of oligomeric RNF213 with LDs upon interferon treatment. Source data are provided as a Source Data file.
Fig. 4
Fig. 4. RNF213 counteracts HSV-1 infection.
a HeLa cells were infected up to 72 h with eGFP-expressing recombinant herpes simplex virus 1 (HSV-1) at MOI 0.1. Forty eight hours prior to infection, cells were transfected with a pool of siRNAs targeting RNF213 (siRNF213) or a pool of scrambled siRNAs (siScramble) as control. The viral load was determined by monitoring the GFP signal in each condition every 24 h to generate a viral growth curve (right panel, representative viral growth curve from a single experiment, n = 4 technical replicates, curve connecting AVG, two-tailed unpaired t-test comparing siRNF213 to siScramble, a.u. arbitrary units). The area under the curve (AUC) was calculated for each growth curve and the average AUC of three independent experiments is shown relative to the siScramble control (left panel, AVG ± SEM, n = 3 independent experiments, two-tailed unpaired t-test). b HSV-1 infection experiment performed as in a, except that 16 h prior to infection cells were treated with interferon (IFN)-α (right panel, representative viral growth curve from a single experiment, n = 4 technical replicates, curve connecting AVG, two-tailed unpaired t-test comparing siRNF213 to siScramble; left panel, AVG ± SEM, n = 3 independent experiments, two-tailed unpaired t-test). Knockdown of RNF213 leads to significantly higher HSV-1 infection levels. c Immunoblots against RNF213, HSV-VP5, and MXA with tubulin as loading control confirmed knockdown of RNF213, HSV-1 infection and interferon-α treatment, respectively, in the experiments shown in a, b. d HSV-1 infection experiment performed as in a, except that 24 h prior to infection at MOI 0.05 cells were transfected with plasmids encoding 3xFLAG-RNF213 or MXB or with an empty vector (mock) as control (right panel, representative viral growth curve from a single experiment, AVG ± SEM, n = 4 technical replicates, curve connecting AVG, two-tailed unpaired t-test comparing RNF213 or MXB overexpression to mock). The average AUC of two independent experiments is shown relative to the mock control (left panel, AVG ± SEM, n = 2 independent experiments, two-tailed unpaired t-test). Overexpression of RNF213 leads to significantly lower HSV-1 infection levels. e Immunoblots against FLAG, HSV-VP5, and MXB with tubulin as loading control confirmed HSV-1 infection and expression of FLAG-RNF213 and MXB in the experiments shown in d. In a, b, e asterisks indicate p values with *p < 0.05, **p < 0.01, and ****p < 0.0001. Source data are provided as a Source Data file.
Fig. 5
Fig. 5. RNF213 counteracts RSV infection.
a A549 cells were infected with human respiratory syncytial virus (RSV) A2 for up to 6 days at MOI 0.02. Forty eight hours prior to infection, cells were transfected with a pool of siRNAs targeting RNF213 (siRNF213), a single siRNA targeting the RSV-nucleoprotein (siRSV-N) as positive control or a pool of scrambled siRNAs (siScramble) as negative control. The viral titer was determined by counting plaque-forming units (PFUs) after serial dilution (representative results from a single experiment, AVG ± SEM, n = 3 technical replicates, two-tailed unpaired t-test comparing siRNF213 to siScramble). b RSV infection experiment performed as in a, except that 42 h prior to infection cells were treated with interferon (IFN)-β (representative results from a single experiment, AVG ± SEM, n = 3 technical replicates, two-tailed unpaired t-test comparing siRNF213 to siScramble). Knockdown of RNF213 leads to significantly higher RSV titers. c A549 cells were infected with RSV-A2 at MOI 0.005 in combination with knockdown of RNF213 and RSV-N as described in a. Six days post infection, a plaque assay was performed and plaque sizes were quantified in pixels with Fiji (left panel, representative results from a single experiment, AVG ± SD, two-tailed Mann–Whitney test, siRSV-N n = 8, siScramble n = 267, and siRNF213 n = 183). Representative images showing plaques of siRNF213 and siScramble-treated cells (right panel). d RSV infection experiment performed as in c, except that 42 h prior to infection cells were treated with interferon-β (left panel, representative results from a single experiment, AVG ± SD, two-tailed Mann–Whitney test, siRSV-N n = 4, siScramble n = 123, and siRNF213 n = 99). Representative images showing plaques of siRNF213 and siScramble-treated cells (right panel). Knockdown of RNF213 leads to significantly larger RSV plaques. In a–d) asterisks indicate p values with *p < 0.05, **p < 0.01, ***p < 0.001, and ****p < 0.0001. Source data are provided as a Source Data file.
Fig. 6
Fig. 6. RNF213 counteracts CVB3 infection.
a HeLa cells were infected with coxsackievirus (CV) B3 at MOI 0.01. Twenty four hours prior to infection, cells were transfected with a pool of siRNAs targeting RNF213 (siRNF213) or a pool of scrambled siRNAs (siScramble) as control. Twenty four hours post infection, the intracellular viral RNA load was determined by qRT-PCR (AVG ± SEM, n = 3 independent experiments, two-tailed unpaired t-test). b From the same experiment as in a, the intracellular viral protein load was determined by immunoblotting against VP1 and the intensity of the VP1 band is shown relative to the siScramble control (left panel, AVG ± SEM, n = 4 independent experiments, one-tailed t-test). A representative immunoblot for the quantification of VP1 is shown (right panel). c From the same experiment as in a, the viral titer was determined by counting PFUs after serial dilution (representative result from a single experiment, AVG ± SEM, n = 3 technical replicates, two-tailed unpaired t-test). Knockdown of RNF213 leads to a significant increase in CVB3 infection. In a–c asterisks indicate p values with *p < 0.05, **p < 0.01. Source data are provided as a Source Data file.
Fig. 7
Fig. 7. RNF213 counteracts Listeria infection.
a HeLa cells were infected with Listeria monocytogenes EGD (Listeria) for 16 h at MOI 25. Twenty four hours prior to infection, cells were transfected with a pool of siRNAs targeting ISG15 (siISG15), RNF213 (siRNF213), or a pool of scrambled siRNAs (siScramble) as control. Intracellular Listeria were quantified after serial dilution by counting colony-forming units (CFUs) in a gentamycin assay. The percentage of intracellular bacteria relative to siScramble-transfected cells is shown (left panel, AVG ± SEM, n = 3 independent experiments, two-tailed unpaired t-test). Immunoblots against RNF213 and ISG15 with tubulin as loading control (right panel). b HeLa cells were infected with Listeria for 4 h at MOI 25. Twenty four hours prior to infection, HeLa cells were transfected with plasmids encoding 3xFLAG-RNF213 or HA-ISG15 or with an empty vector (mock) as control. Intracellular Listeria were quantified as in a and the percentage of intracellular bacteria relative to mock plasmid-transfected cells is shown (left panel, AVG ± SEM, n = 3 independent experiments, two-tailed unpaired t-test). Immunoblots against FLAG and HA with tubulin as loading control (right panel). c Wild-type (WT) or ISG15 knockout (KO) HeLa cells were infected with Listeria for 16 h at MOI 25 after transfection of FLAG-RNF213 as in b. Intracellular Listeria were quantified as in a and the percentage of intracellular bacteria relative to mock plasmid-transfected cells is shown (left panel, AVG ± SEM, n = 3 independent experiments, two-tailed unpaired t-test, n.s. not significant). Immunoblots against FLAG and ISG15 with tubulin as loading control (right panel). d Wild-type (WT) or RNF213 KO HeLa cells were infected with Listeria for 16 h at MOI 25 after transfection of HA-ISG15 as in b. Intracellular Listeria were quantified as in a and the percentage of intracellular bacteria relative to mock plasmid-transfected cells is shown (left panel, AVG ± SEM, n = 3 independent experiments, two-tailed unpaired t-test). Immunoblots against RNF213 and HA with tubulin as loading control (right panel). In a–d asterisks indicate p values with **p < 0.01, ***p < 0.001, and ****p < 0.0001. Source data are provided as a Source Data file.
Fig. 8
Fig. 8. RNF213 decorates intracellular Listeria.
a Representative images of HeLa cells transfected with eGFP-RNF213 and counterstained for lipid droplets (LDs). Following transfection cells were left untreated or infected with Listeria monocytogenes EGD for 24 h at MOI 25. Scale bars in the pictures and insets are respectively 10 microns and 1 micron. White arrows indicate colocalization between RNF213 and lipid droplets or instances of RNF213 colocalization with intracellular bacteria (DAPI = 4′,6-diamidino-2-phenylindole). b LDs in uninfected (n = 66 cells) and Listeria-infected cells (n = 40 cells) from a were quantified with Fiji and the percentage of LDs per cell that colocalized with RNF213 was calculated (representative results from a single experiment, two-tailed unpaired t-test, AVG uninfected = 68.29%, AVG Listeria-infected = 67.14%, n.s. = not significant). c Representative images of HeLa cells transfected with eGFP-RNF213 and infected for 18 h with Listeria monocytogenes EGD stably expressing mCherry. Scale bars in the pictures and insets are respectively 10 microns and 0.5 micron. d Intracellular Listeria from c were quantified with Imaris 9.6 and the percentage of Listeria that was decorated by eGFP-RNF213 was calculated for each field by mapping the cell surface, enumerating intracellular bacteria and quantifying bacteria that colocalized with GFP-RNF213 (defined as bacteria within 0.5 µm of RNF213, see methods for more detail). At least 200 cells were counted per experiment, and data were compiled from three independent experiments indicating that on average 37.44% of Listeria was decorated by RNF213. e (left panel) Representative image of HeLa cells transfected with eGFP-RNF213 and infected with Listeria monocytogenes EGDe prfA* at MOI 1 for 6 h. Scale bar in the picture and insets is 10 microns. Inset demonstrates colocalization of RNF213 to the surface of cytosolic bacteria. Nuclei are shown in blue, RNF213 in green, actin in red, and bacteria in magenta. Scale bar is 1 micron. (right panel) Representative image of HeLa cells transfected with eGFP-RNF213 and infected with Listeria monocytogenes EGDe prfA*∆plcA∆plcB∆hly at MOI 75 for 6 h. Scale bars in the picture and insets are respectively 10 microns and 1 micron. Source data are provided as a Source Data file.
Fig. 9
Fig. 9. RNF213 counteracts Listeria infection in vivo.
a, bRnf213−/− and Rnf213+/+ mice were infected intravenously with 5 × 105 Listeria monocytogenes EGD. Spleen (a) and liver (b) were isolated following 24 h (n = 5 for both genotypes), 48 h (n = 4 for Rnf213−/− and n = 5 for Rnf213+/+), and 72 h of infection (n = 5 for both genotypes). Colony-forming Units (CFUs) per organ were counted by serial dilution and replating; dots and squares depict individual animals (representative results of a single experiment, AVG ± SEM, two-tailed Mann–Whitney test, n.s. not significant, LOD limit of detection). Rnf213−/− mice are dramatically more susceptible to Listeria as evidenced by significantly higher CFUs at all three timepoints in the spleen and at 72 h in the liver. The results of two independent repeat experiments are shown in Supplementary Fig. 12. Asterisks indicate p values with *p < 0.05 and **p < 0.01. Source data are provided as a Source Data file.
Fig. 10
Fig. 10. The RNF213 E3 module is required for its antimicrobial activity.
a Glutathione-S-Transferase (GST) pull-down with ISG15 followed by immunoblotting shows that 3xFLAG-RNF213ΔC binds to ISG15 similar to full-length 3xFLAG-RNF213. Beads coated with GST-ISG15 were mixed with a lysate of HEK293T cells expressing full-length 3xFLAG-RNF213, 3xFLAG-RNF213ΔC, or the complementary C-terminal fragment of RNF213 and bound proteins were analyzed by immunoblot (IB) against FLAG and GST. b FLAG immunoprecipitation (IP) was performed from lysates of HEK293T cells expressing 3xFLAG-RNF213, 3xFLAG-RNF213ΔC, or FLAG-eGFP as control. After immunoprecipitation, beads were mixed with a lysate of HEK293T cells expressing HA-ISG15 and the ISGylation machinery (E1, E2, E3). 3xFLAG-RNF213ΔC was capable of pulling down ISGylated proteins similar to 3xFLAG-RNF213, while FLAG-eGFP was not. c HeLa cells were infected with Listeria monocytogenes EGD for 4 h at MOI 25. Twenty four hours prior to infection, HeLa cells were transfected with plasmids encoding 3xFLAG-RNF213 or 3xFLAG-RNF213ΔC or with an empty vector (mock) as control. Intracellular Listeria were quantified after serial dilution by counting colony-forming units (CFUs) in a gentamycin assay. The percentage of intracellular bacteria relative to mock plasmid-transfected cells is shown (lower panel, AVG ± SEM, n = 3 independent experiments, two-tailed unpaired t-test, n.s. not significant). Immunoblots against FLAG with tubulin as loading control confirmed expression of FLAG-RNF213, FLAG-RNF213ΔC (upper panel). d Representative images of HeLa cells transfected with eGFP-RNF213ΔC and infected for 18 h with Listeria monocytogenes EGD stably expressing mCherry. Scale bars in the pictures and insets are respectively 10 microns and 0.5 micron. eGFP-RNF213ΔC showed a diffused cellular staining, not decorating intracellular Listeria (DAPI = 4′,6-diamidino-2-phenylindole). In c asterisks indicate p values with ****p < 0.0001. Source data are provided as a Source Data file.

References

    1. Yuan W, Krug RM. Influenza B virus NS1 protein inhibits conjugation of the interferon (IFN)-induced ubiquitin-like ISG15 protein. EMBO J. 2001;20:362–371. doi: 10.1093/emboj/20.3.362. - DOI - PMC - PubMed
    1. Zhao C, et al. The UbcH8 ubiquitin E2 enzyme is also the E2 enzyme for ISG15, an IFN-alpha/beta-induced ubiquitin-like protein. Proc. Natl Acad. Sci. USA. 2004;101:7578–7582. doi: 10.1073/pnas.0402528101. - DOI - PMC - PubMed
    1. Dastur A, Beaudenon S, Kelley M, Krug RM, Huibregtse JM. Herc5, an interferon-induced HECT E3 enzyme, is required for conjugation of ISG15 in human cells. J. Biol. Chem. 2006;281:4334–4338. doi: 10.1074/jbc.M512830200. - DOI - PubMed
    1. Zou W, Zhang DE. The interferon-inducible ubiquitin-protein isopeptide ligase (E3) EFP also functions as an ISG15 E3 ligase. J. Biol. Chem. 2006;281:3989–3994. doi: 10.1074/jbc.M510787200. - DOI - PubMed
    1. Okumura F, Zou W, Zhang DE. ISG15 modification of the eIF4E cognate 4EHP enhances cap structure-binding activity of 4EHP. Genes Dev. 2007;21:255–260. doi: 10.1101/gad.1521607. - DOI - PMC - PubMed

Publication types

MeSH terms