. 2021 Oct 1;12(1):5764.
doi: 10.1038/s41467-021-26091-4.

CD177 modulates the function and homeostasis of tumor-infiltrating regulatory T cells

Affiliations

CD177 modulates the function and homeostasis of tumor-infiltrating regulatory T cells

Myung-Chul Kim et al. Nat Commun. .

Abstract

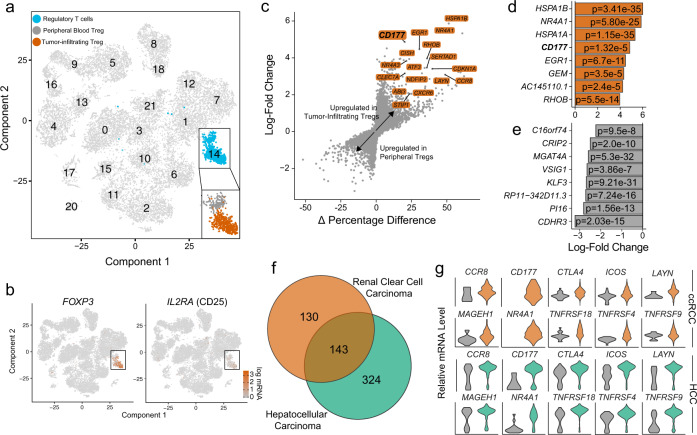
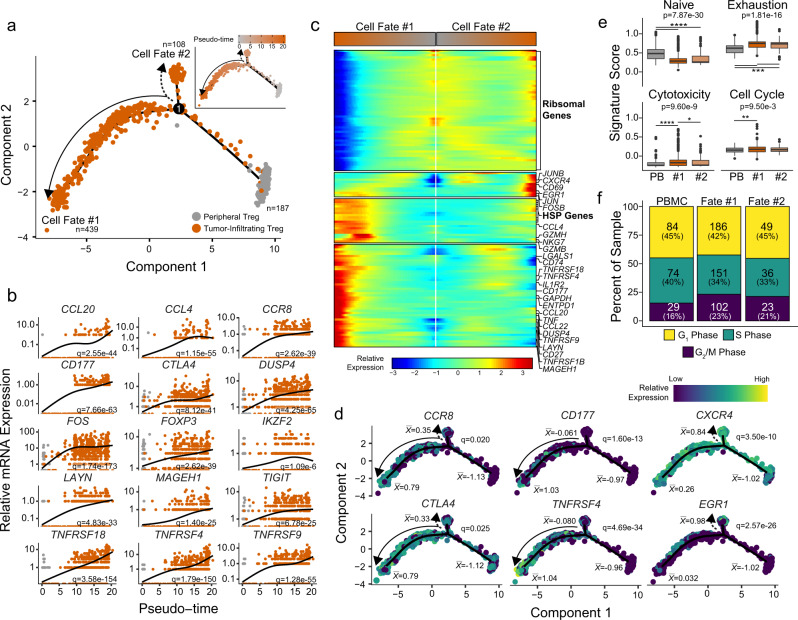
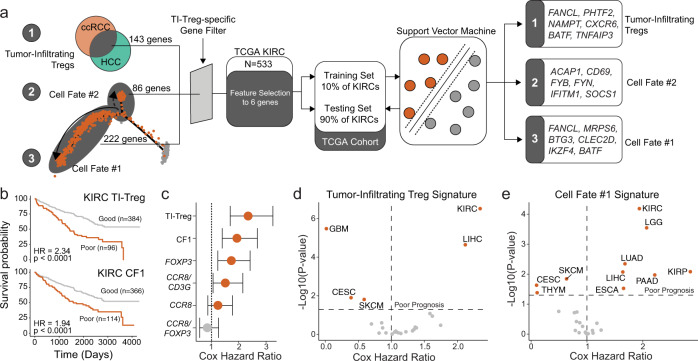
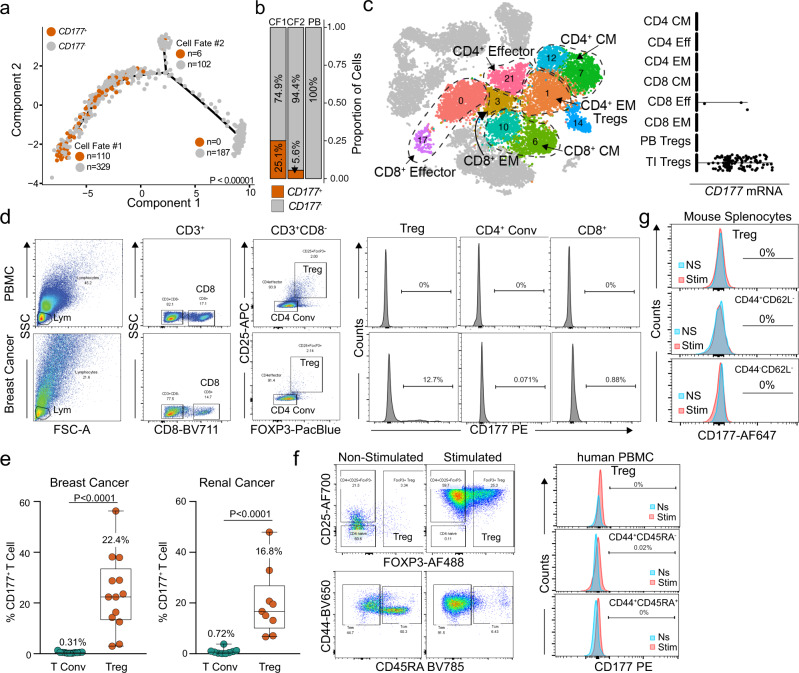
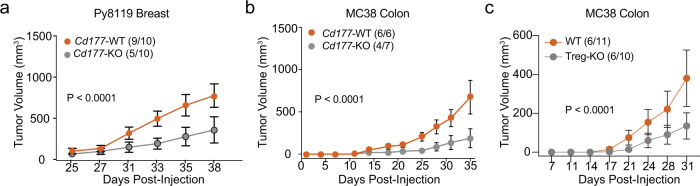
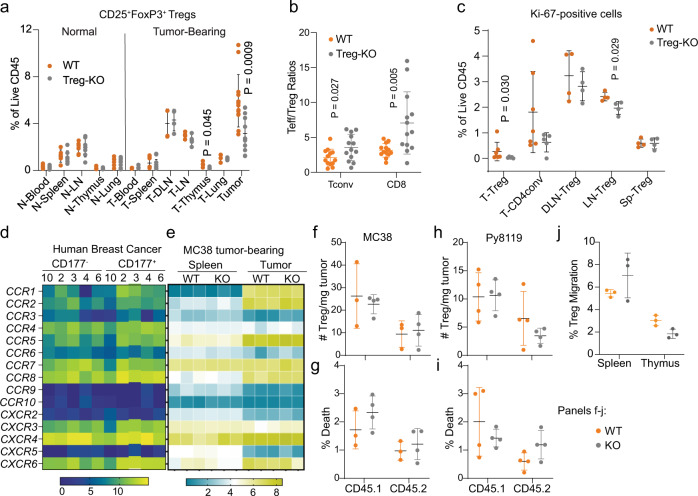
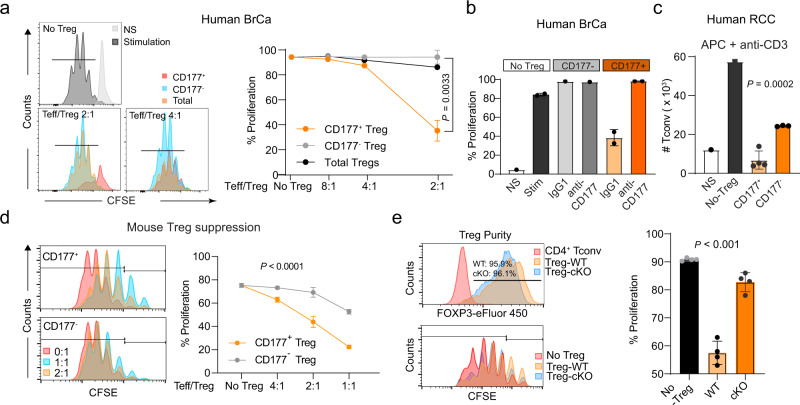
Regulatory T (Treg) cells are one of the major immunosuppressive cell types in cancer and a potential target for immunotherapy, but targeting tumor-infiltrating (TI) Treg cells has been challenging. Here, using single-cell RNA sequencing of immune cells from renal clear cell carcinoma (ccRCC) patients, we identify two distinct transcriptional fates for TI Treg cells, Fate-1 and Fate-2. The Fate-1 signature is associated with a poorer prognosis in ccRCC and several other solid cancers. CD177, a cell surface protein normally expressed on neutrophil, is specifically expressed on Fate-1 TI Treg cells in several solid cancer types, but not on other TI or peripheral Treg cells. Mechanistically, blocking CD177 reduces the suppressive activity of Treg cells in vitro, while Treg-specific deletion of Cd177 leads to decreased tumor growth and reduced TI Treg frequency in mice. Our results thus uncover a functional CD177+ TI Treg population that may serve as a target for TI Treg-specific immunotherapy.


Conflict of interest statement

X.Z. and D.Z. are inventors of two pending patent applications for the use of BCL-XL PROTACs as senolytic and antitumor agents. D.Z. is the co-founder of, and D.Z. and W.Z. have equity in, Dialectic Therapeutics, which develops BCL-XL PROTACs for the treatment of cancer. The other authors have no competing interests.

Figures

Fig. 1
Fig. 1. TI Treg cells display a distinct expression program compared to PB controls in the ccRCC single cell RNA sequencing dataset.
a tSNE projection of immune cells from three ccRCC patients with normal PB cells (n = 13,433) and TI cells (n = 12,239). Treg population (blue) was isolated and separated as TI (orange) versus PB Treg cells (gray). b tSNE projection with the highlighted expression of Treg markers, FOXP3 and IL2RA (CD25). c Differential gene expression analysis using the log-fold change expression versus the difference in the percentage of cells expressing the gene comparing TI versus PB Treg cells (Δ Percentage Difference). Genes labeled have log-fold change > 1, Δ Percentage Difference > 20% and adjusted P-value from Wilcoxon rank sum test <0.05. d Top eight upregulated genes by log-fold change in TI Treg cells with adjusted P-value <0.05. e Top eight downregulated genes by log-fold change in TI Treg cells with adjusted P-value <0.05. d, e Wilcoxon rank sum test with p-values adjusted using the Bonferroni method. f Comparison of differential genes in TI Treg cells in ccRCC (orange) and HCC (green) compared to PB Treg cells. Significant genes were defined as log-fold change >1 or <−1 with adjusted P-values <0.05. g Violin plots showing relative mRNA level of Treg markers in PB (gray) and TI Treg cells in ccRCC (top) and HCC (bottom).
Fig. 2
Fig. 2. Bifurcation in the transcriptional state of TI Treg cells reveals a more suppressive cell fate.
a Trajectory manifold of Treg cells from the ccRCC using the Monocle 2 algorithm. Solid and dotted lines represent distinct cell trajectories/fates defined by expression profiles. b Pseudotime projections of transcriptional changes in immune genes based on the manifold. The significance was determined based on differential testing relative to the site of origin which was also used to generate pseudotime and adjusted for multiple comparisons. c Expression heatmap of significant (q < 1e-6) genes based on branch expression analysis comparing the two TI cell fates. The genes in the heatmap were also used in the ordering of the pseudotime variable. d Cell trajectory projections of transcriptional changes in immune genes based on the manifold. Significance based on differential testing between the first and second cell fates of TI Treg cells. x¯ denotes the scaled mean mRNA levels at each pole of the manifold. e Gene set enrichment analysis of the poles of the trajectory manifold. Boxplots were drawn for values between 25th and 75th percentile with median value lines. Outlier values were graphed as individual points for values 1.5 times the interquartile range. P-values are based on one-way ANOVA with individual comparisons corrected for multiple hypothesis testing using the Tukey HSD method. f Results of the cell cycle regression analysis of single cells for each cell fate using the Seurat R package.
Fig. 3
Fig. 3. Improved prognostic prediction is associated with a signature from the suppressive TI Treg cell fate.
a Schematic of signature development using feature selection from: (1) 143 common differential genes of TI Treg in ccRCC and HCC, (2) 86 genes differentially expressed in CF2, and (3) 222 genes differentially expressed in CF1 using the 10% of the TCGA KIRC/ccRCC dataset for feature selection. Gene signatures generated after feature selection were used to predict prognosis in the remaining 90% TCGA KIRC/ccRCC, as well as 23 other TCGA cancer datasets. b Kaplan–Meier curves for overall survival in TCGA KIRC/ccRCC using the TI-Treg common gene signature (upper panel) and CF1-Treg gene signature (lower panel). c Prognostic prediction for Treg signatures compared to other proposed signatures for TI Treg cells. Hazard ratios with the bars representing the 95% confidence intervals, and P values derived from Cox proportional hazard regression modeling. d, e Overall survival prediction with Cox proportional hazard ratio and −log10(P value) based on two-sided log-rank testing across the 24 largest TCGA datasets using d the TI Treg signature and e the CF1 signature. CESC, Cervical squamous cell carcinoma and endocervical adenocarcinoma; ESCA, esophageal carcinoma; GBM, glioblastoma multiforme; KIRC, kidney renal clear cell carcinoma, KIRP, kidney renal papillary cell carcinoma; LGG, low-grade glioma; LIHC, liver hepatocellular carcinoma; LUAD, lung adenocarcinoma; PAAD, pancreatic adenocarcinoma; SKCM, skin-cutaneous melanoma; THYM, thymoma.
Fig. 4
Fig. 4. CD177 is a marker for a subpopulation of TI Treg cells.
a Trajectory manifold of Treg cells from the ccRCC TI Treg cells with the number of CD177+ and CD177 Treg cells for each respective cell fate. The significance is based on χ2 testing comparing the three poles of the manifold. b Proportional distribution of CD177+ Treg cells by cell fate across the manifold. c CD177 mRNA expression on different effector/memory T cell subpopulations within ccRCC dataset defined by a gene signature including CD27, CD28, CCR7, CCR5, SELL and FAS. CM: central memory; Eff, effector; EM, effector memory. d Schematic flow cytometry data gating on lymphocytes (lym) were further analyzed for CD177 expression on Treg cells (CD4+CD25+FOXP3+), conventional CD4 T cells (CD4 conv, CD4+CD25) and CD8 T cells (CD8) isolated from TI lymphocytes in breast cancer or PBMC. e Percent CD177+ cells within TI CD4 Tconv or TI Treg cells in breast cancer (n = 13, mean ± SD) and renal cancer (n = 9, mean ± SD). Two-sided unpaired T-test was used. f CD177 protein expression on different T cell subpopulations defined by CD44 and CD45RA from PBMC of breast cancer patients. Treg cells (CD4+CD25+CD127low) and CD4 conv cells (CD4 conv, CD4+CD25) were purified from human PBMC of breast cancer patients, either non-stimulated or stimulated (anti-CD3/CD28 + IL-2). Left: gating of Treg cells (top) or effector/memory population for CD4 Tconv (bottom); Right: CD177 expression on the gated populations. g CD177 protein expression on different effector/memory T cell subpopulations defined by CD44 and CD62L from mouse spleens. Treg cells (CD4+CD25+GITR+) and CD4 conv cells (Tconv, CD4+CD25) were purified from spleens of WT mouse, either non-stimulated or stimulated (anti-CD3/CD28 + IL-2). f, g CD177 expression was determined by flow cytometry.
Fig. 5
Fig. 5. Cd177-deficiency in Treg cells leads to reduced tumorigenesis.
a Py8119 tumor growth is significantly reduced in Cd177-KO mice compared to WT, P < 0.0001 in female mice challenged with 5×10² cells per inoculation, n = 10 bilateral tumors. b MC38 tumor growth is significantly reduced in Cd177-KO mice compared to WT, P < 0.0001 in male mice challenged with 5×10⁴ cells per inoculation (n = 6 WT and 7 KO). c MC38 tumor growth is significantly reduced in Treg-specific Cd177-KO (Cd177fl/fl/Foxp3-Cre) male mice compared to control male mice either carrying floxed Cd177 allele (Cd177fl/fl) or Cd177fl/+/Foxp3-Cre. P < 0.0001 in mice challenged with 5×10⁴ cells per inoculation (n = 10 WT and 11 Treg-KO). ac Numbers in parenthesis equates to the number of mice that developed palpable tumors/total mice inoculated. Data are presented as mean ± SEM. Two-way ANOVA was used for ac.
Fig. 6
Fig. 6. Cd177-deficiency in Treg cells leads to reduced frequency of TI Treg cells.
a Impact of Treg-specific Cd177-KO on the frequency of Treg cells within different tissues of normal or MC38-tumor-bearing mice (n = 6 for normal WT and n = 7 for KO mice; n = 13 for tumor TI-Treg cells and n = 4 for other tissues from tumor-bearing mice, T: tumor. b The ratios between TI Teff cells – including CD4 Tconv and CD8 T cells – and TI Treg cells in MC38 Tumors (n = 13 biological repeats). c Percentage of Ki-67+ T cells relative to total CD45+ leukocytes within different tissues from WT or Treg-specific Cd177-KO mice bearing MC38 tumors. Tissues were from similar experiments as in Fig. 5c tumor bearing mice (n = 7 WT and 5 Treg-KO). P-values are indicated when less than 0.05. T, tumor; DLN, draining lymph nodes; LN, non-draining lymph nodes; Sp, Spleen. d, e Heatmap showing gene expression of chemokine receptors within CD177+ and CD177 TI Treg cells, using flow-sorted CD177+ and CD177 TI Treg cells from 5 human breast cancer specimens (d data adapted from GSE89225 with patient number included), or RNA sequencing of splenic or TI Treg cells from MC-38 tumor bearing WT or Treg-specific Cd177-KO mice (e GSE150420, n = 3 each group; tumor KO group, n = 2). fi Impact of CD177 on Treg recruitment into tumors. Splenic and thymic Treg cells (1:1 combined) from WT or germline CD177-KO mice of C57BL/6 background were purified (CD4+CD25+GITR+) and adoptively transferred into tumor-bearing congenic CD45.1 mice (fg MC38; hi Py8119). The frequency (f, h the number of Treg cells per mg tumor tissues) or viability (g, i percent death determined by Fixable Viability Dye eFluor780) of the recipient (CD45.1+) or donor (CD45.2+) TI Treg cells was determined using flow cytometry after 72 hrs of transfer (n = 3 WT and 4 KO tumor per group for f, g; n = 4 each group for h, i). j Impact of CD177 on Treg migration towards tumor lysates. Total splenocytes and thymocytes from littermates of WT or germline KO mice were seeded into Boyden chamber with 3 μm pore size, using 10% MC38 tumor homogenate as chemoattractant. Percent Treg migration was calculated using the number of migrated Treg cells divided by the sum of migrated and non-migrated Treg cells, determined by flow cytometry (n = 3 biological repeats). All data are presented mean ± s.t.d. Two-sided unpaired T-test was used for all group comparisons.
Fig. 7
Fig. 7. CD177+ TI Treg cells are highly suppressive to effector T cells.
a Suppressive capacity of CD177+ or CD177 TI Treg cells isolated from breast cancer specimens. CD4 Tconv cells were stimulated by anti-CD3/CD28 co-stimulation. CD4+CD25+CD127low total, CD177+ or CD177 TI Treg cells were purified from 3 individual breast cancer specimens and combined for the suppression assay. Left: Histograms showing CFSE dilution peaks indicating Teff cell proliferation and Right: Percentages of proliferative CD4 Teff cells co-cultured with total, CD177+ or CD177 TI Treg cells at ratios of 2:1, 4:1, 8:1 or no Treg (Combined data from a and b: n = 3 biological replicates for CD177+ TI Treg cells and n = 2 for CD177 TI Treg cells at 2:1 ratio; n = 1 biological replicate for other data point). P value is for comparison between CD177+ or CD177 TI Treg cells at 2:1 ratio Teff/Treg, using two-sided T-test. b Impact of CD177 blockade on the immune suppressive function of CD177+ TI Treg cells, using a monoclonal antibody (MEM166). Similar suppression experiments were performed as in a. CD177+ or CD177 TI Treg cells were purified from fresh human breast cancer specimens (combined from 5 patients) using flow cytometry and co-cultured with effector CD4 T (CD4+CD25) cells from PBMC for ex vivo suppression assay, with or without the addition of 2 μg/ml isotype control (IgG) or anti-CD177 antibody (MEM166). Percent of proliferating cells were included and the total number of CD4 Tconv cells were enumerated after 4 days of incubation (n = 2 biological replicates for CD177+ Treg group, n = 1 for other data points). c Suppressive capacity of CD177+ or CD177 TI Treg cells isolated from renal cell cancer specimens (RCC). CD4 Tconv cells were stimulated by anti-CD3 and APC (monocyte derived dendritic cells). A total of 7 RCC specimens were combined (n = 1 for NS, non-stimulated or no Treg; n = 4 for CD177+ TI Treg cells; n = 3 biological replicates for CD177 TI Treg cells). The total number of CD4 Tconv cells were counted after 4 days of incubation. d Suppressive capacity of CD177+ or CD177 TI Treg cells isolated from mouse MC38 tumors. Effector CD4 T cells were stimulated by anti-CD3 and APC (derived from T-cell depleted splenocytes of tumor bearing mice) and combined with TI Treg cells at different ratios. Left: Histograms showing the CFSE dilution as an indicator of T cell proliferation and right: Percent proliferation as defined by the histogram (n = 3 biological replicates except n = 6 for no Treg group). Two-way ANOVA was used. e Impact of Treg-specific Cd177-KO on the suppressive capacity of TI Treg cells from MC38 tumors similar as shown in Fig. 5c. Upper left: post-sorting Treg purify was determined by intracellular staining of FoxP3; Lower left: histogram showing CFSE dilution peaks indicating CD4+ Teff cell proliferation; right: summary of percent proliferating cells (n = 4 biological replicates from 14 tumors from cKO group and 20 tumors from WT group, with 4 tumors combined in one biological replicate). All data are presented mean ± s.t.d. c, e one-way ANOVA was used.

References

    1. Schmidt AM, et al. Regulatory T cells require TCR signaling for their suppressive function. J. Immunol. 2015;194:4362–4370. doi: 10.4049/jimmunol.1402384. - DOI - PMC - PubMed
    1. Tanaka A, Sakaguchi S. Regulatory T cells in cancer immunotherapy. Cell Res. 2017;27:109–118. doi: 10.1038/cr.2016.151. - DOI - PMC - PubMed
    1. Simpson TR, et al. Fc-dependent depletion of tumor-infiltrating regulatory T cells co-defines the efficacy of anti–CTLA-4 therapy against melanoma. J. Exp. Med. 2013;210:1695–1710. doi: 10.1084/jem.20130579. - DOI - PMC - PubMed
    1. Zou W, Wolchok JD, Chen L. PD-L1 (B7-H1) and PD-1 pathway blockade for cancer therapy: Mechanisms, response biomarkers, and combinations. Sci. Transl. Med. 2016;8:328rv324. doi: 10.1126/scitranslmed.aad7118. - DOI - PMC - PubMed
    1. Fontenot JD, Gavin MA, Rudensky AY. Foxp3 programs the development and function of CD4+CD25+ regulatory T cells. Nat. Immunol. 2003;4:330–336. doi: 10.1038/ni904. - DOI - PubMed

Publication types

MeSH terms