. 2022 Feb;22(2):414-426.
doi: 10.1111/ajt.16861. Epub 2021 Oct 15.

Genetically targeting the BATF family transcription factors BATF and BATF3 in the mouse abrogates effector T cell activities and enables long-term heart allograft survival

Affiliations

Genetically targeting the BATF family transcription factors BATF and BATF3 in the mouse abrogates effector T cell activities and enables long-term heart allograft survival

Yixuan Wang et al. Am J Transplant. 2022 Feb.

Abstract

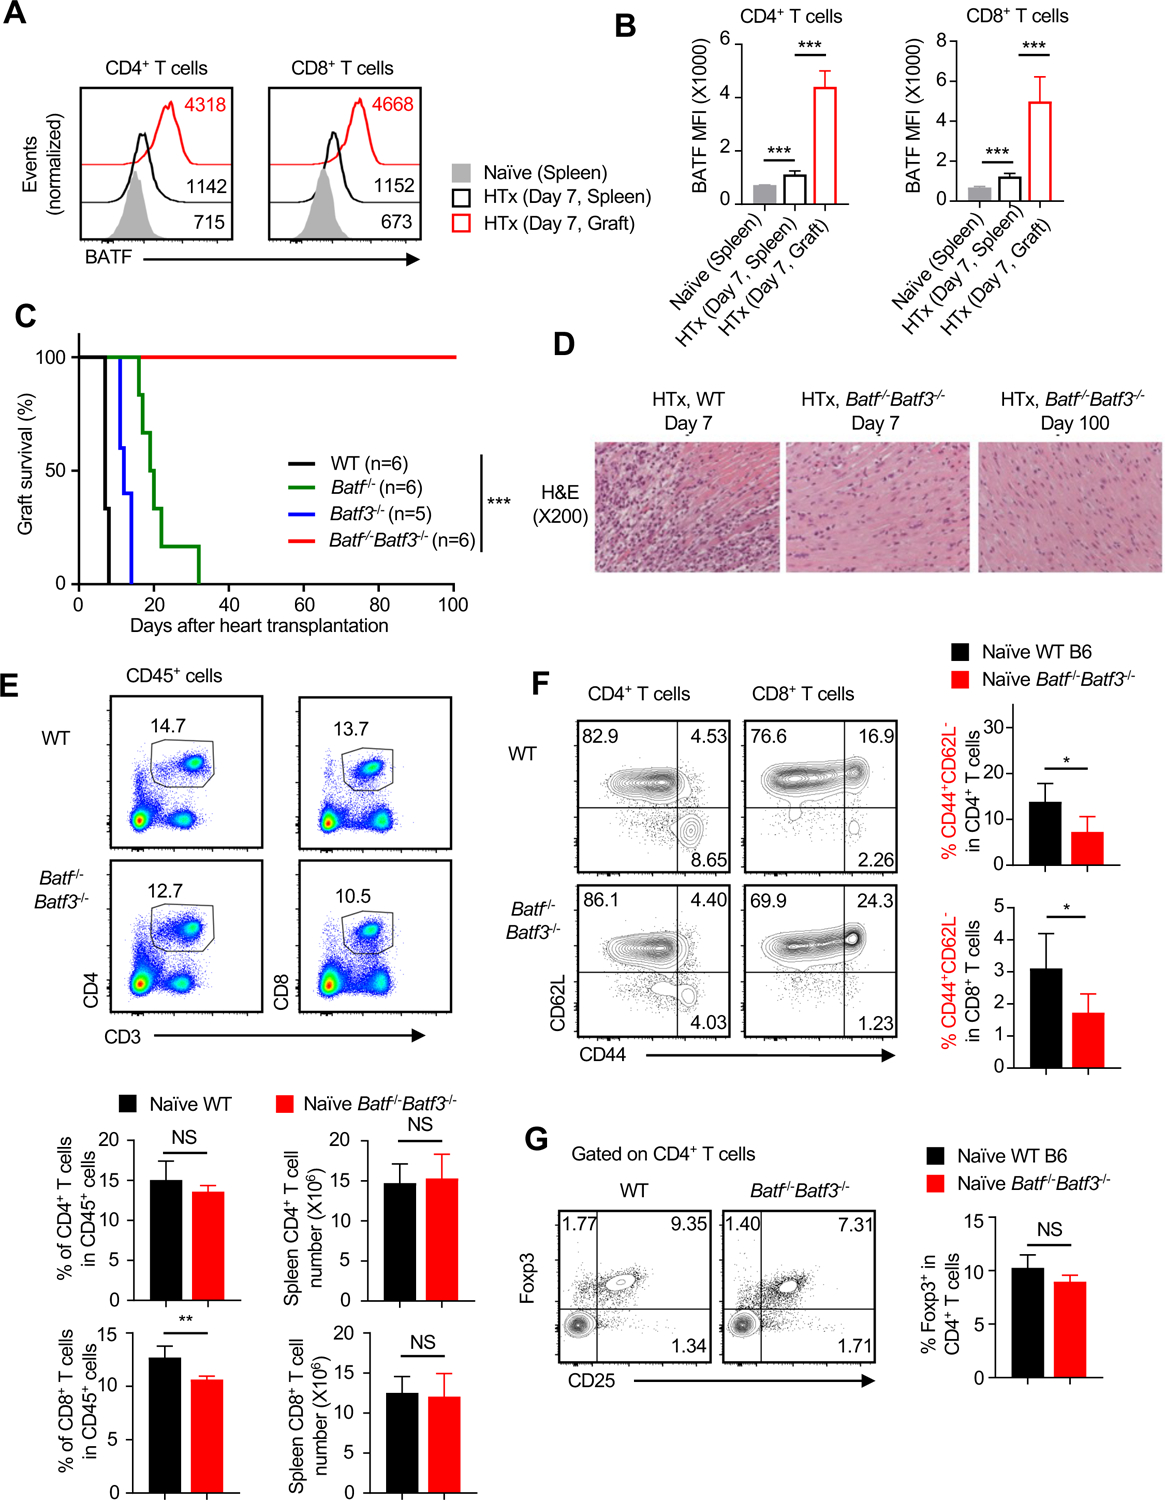
T cells must be activated and become effectors first before executing allograft rejection, a process that is regulated by diverse signals and transcription factors. In this study, we studied the basic leucine zipper ATF-like transcription factor (BATF) family members in regulating T cell activities in a heart transplant model and found that mice deficient for both BATF and BATF3 (Batf-/- Batf3-/- mice) spontaneously accept the heart allografts long-term without tolerizing therapies. Similarly, adoptive transfer of wild type T cells into Rag1-/- hosts induced prompt rejection of heart and skin allografts, whereas the Batf-/- Batf3-/- T cells failed to do so. Analyses of graft-infiltrating cells showed that Batf-/- Batf3-/- T cells infiltrate the graft but fail to acquire an effector phenotype (CD44high KLRG1+ ). Co-transfer experiments in a T cell receptor transgenic TEa model revealed that the Batf-/- Batf3-/- T cells fail to expand in vivo, retain a quiescent phenotype (CD62L+ CD127+ ), and unable to produce effector cytokines to alloantigen stimulation, which contrasted sharply to that of wild type T cells. Together, our data demonstrate that the BATF and BATF3 are critical regulators of T effector functions, thus making them attractive targets for therapeutic interventions in transplant settings.

Keywords: T cell biology; basic (laboratory) research/science; immunobiology; tolerance: experimental.


Conflict of interest statement

Disclosure

The authors of this manuscript have no conflicts of interest to disclose as described by the American Journal of Transplantation.

Figures

Figure 1.
Figure 1.. Batf−/−Batf3−/− mice accept the fully MHC mismatched heart allografts indefinitely.
(A and B) Analysis of BATF expression in recipients’ spleen and graft-infiltrating CD4+ and CD8+ T cells 7 days after grafting BALB/c heart into C57BL/c recipients. CD4+ and CD8+ T cells from naïve B6 mice were used as controls. Data are presented as mean fluorescence intensity (MFI) ± SD (n=5) and are representative of two independent experiments. ***, p < 0.001; unpaired Student’s t test. (C) Survival of BALB/c heart allografts in WT B6, Batf−/−, Batf3−/−, and Batf−/−Batf3−/− double deficient recipients. ***, p < 0.001; log-rank test. (D) Representative images of H&E staining of heart allografts sections harvested from recipient mice at day 7 and day 100 post-transplant. X200 magnification. (E) Representative FACS plots and bar graphs showing relative % and absolute number of CD4+ or CD8+ T cells among CD45+ cells in the spleen of naïve WT B6 and Batf−/−Batf3−/− mice. Data are presented as means ± SD (n=5) and are representative of three independent experiments. NS, p > 0.05, **, p < 0.01; unpaired Student’s t test. (F) Representative contour plots and bar graphs showing the phenotypes CD4+ and CD8+ T cells in the spleen of naïve WT B6 and Batf−/−Batf3−/− mice. Data are presented as means ± SD (n=5) and are representative of three independent experiments. *, p < 0.05, ***, p < 0.001; unpaired Student’s t test. (G) Representative plots and bar graphs showing the relative % of CD25+Foxp3+ Tregs CD4+ T cells in the spleen of naïve WT B6 and Batf−/−Batf3−/− mice. Data are presented as means ± SD (n=3) and are representative of three independent experiments. *, p < 0.05, ***, p < 0.001; unpaired Student’s t test.
Figure 2.
Figure 2.. Batf−/−Batf3−/− T cells adoptively transferred into Rag1−/− hosts fail to reject heart and skin allografts.
(A) Heart allograft survival curve in Rag1−/− recipients transferred with either 1 million wt B6 T cells or Batf−/−Batf3−/− T cells followed by grafting BALB/c heart. ***, p < 0.001; log-rank test. (B) Representative images of H&E-stained heart allografts sections harvested from Rag1−/− recipients transferred with either 1 million wt B6 T cells and Batf−/−Batf3−/− T cells at day 100 post-transplant. X200 magnification. (C and E) Skin allograft survival curve in Rag1−/− recipients transferred with either 0.01 million wt B6 T cells or Batf−/−Batf3−/− T cells or wtB6 CD4+ T cells (CD4+CD25) and Batf−/−Batf3−/− CD4+ T cells (CD4+CD25). **, p < 0.01, ***, p < 0.001; log-rank test. (D and F) Representative images of rejected and accepted tail skin allografts post-transplantation corresponding to (C) and (E).
Figure 3.
Figure 3.. The graft-infiltrating Batf−/−Batf3−/− T cells exhibit compromised effector phenotypes.
(A) Top: Gating strategy of graft-infiltrating T cells 7 days after heart transplantation. Bottom: Representative contour plots for % CD4+, % CD8+ T cells among CD45+ cells, and % CD44+CD62L among CD4+ or CD8+ T cells. (B) Bar graphs of graft-infiltrating T cells number and % CD44+CD62L among CD4+ or CD8+ T cells. Data are presented as means ± SD (n=6–8). ***, p < 0.001; unpaired Student’s t test. (C and D) Representative contour plots and bar graphs of % CD44+CD62L, % TNF-α+IFN-γ+ among spleen CD4+ T cells, % CD44+CD62L, % CD44+Granzyme B+ among spleen CD8+ T cells. Data are presented as means ± SD (n=5–8). *, p < 0.05, ***, p < 0.001; unpaired Student’s t test.
Figure 4.
Figure 4.. Batf−/−Batf3−/− T cells fail to acquire effector features in the Rag1−/− hosts in response to alloantigens.
(A) Schematic of experimental design involving 1:1 WT and Batf−/−Batf3−/− T cells adoptively transferred to Rag1−/− recipients. (B) Representative contour plots showing percent transferred CD45.1+ WT and CD45.2 Batf−/−Batf3−/− T cells (CD4+ or CD4. Gated on TCR-β+ cells) in spleen on day −1 (left) and day 9 (right). (C) The left plot showing % CD4+ and % CD8+ among TCR-β+ graft-infiltrating cells on day 9, the right plot showing CD45.1+ WT and CD45.2 Batf−/−Batf3−/− cell populations among those CD4+ and CD8+ infiltrating T cells. (D) Expression of CD44, CD62L, CD127, KLRG1 on CD4+ (top) and CD8+ (bottom) of transferred CD45.1+ WT and CD45.2 Batf−/−Batf3−/− cells in spleen on day 9. (E, F, G, H) Representative contour plots and bar graphs of % TNF-α+, % IFN-γ+, % IL-2+ for CD4+ T cells and % Granzyme B+, % Granzyme A+, % IL-2+ for CD8+ T cells in co-transferred CD45.1+ WT and CD45.2 Batf−/−Batf3−/− cells in spleen on day 9. Data are presented as means ± SD (n=3) and are representative of two independent experiments. NS, p > 0.05, *, p < 0.05, **, p < 0.01; unpaired Student’s t test.
Figure 5.
Figure 5.. Adoptively transferred Batf−/−Batf3−/− TEa T cells exhibit impaired effector gene signature.
(A) Experimental design involving CD45.1+ congenic mice adoptively co-transferred with equal numbers of WT TEa CD4+ T cells and Batf−/−Batf3−/− TEa CD4+ T cells and grafted with BALB/c heart allografts. (B) Six days after cell transfer according to Figure 5A, TEa cells were FACS sorted for RNA-seq analysis. Totally eight CD45.1+ mice were used for WT TEa and Batf−/−Batf3−/− TEa sample preparations. The volcano plot shows up- and down- regulated genes in WT (blue dots) and Batf−/−Batf3−/− TEa cells (red dots). The STAR program was used to align the reads to the mouse reference file (GENCODE mouse reference GRCm38). Differential expression was analyzed by R package (edgeR) with raw read count of each gene adjusted by trimmed mean of M values (TMM). The significant differentially expressed genes are both padjust < 0.05 and |log2(FoldChange)| > 1. (C) Heatmap of selected differentially expressed genes. Read count of each gene were normalized to Fragments Per Kilobase of transcript sequence per Millions base pairs sequenced (FPKM), which takes into consideration the effects of both sequencing depth and gene length on counting of fragments. Log2 (FPKM+1) was performed to obtain the expression of each gene cross each sample. Color is proportional to the relative abundance of gene expression cross each sample, that is blue stands for low expression and red stands for high expression. Effector- and naïve-related genes were highlighted in a bigger font size. (D) Gene set enrichment analysis plots showing differential expression of signature genes in the NF-kB pathway and the cell adhesion pathway in WT TEa cells and Batf−/−Batf3−/− TEa cells based on the RNA-seq data sets.
Figure 6.
Figure 6.. Deficiency of both BATF and BATF3 in effector differentiation of donor-specific TEa cells in vivo.
(A and B) Representative contour plots and bar graphs showing the % of CD44+CD62L, IL-2+IFN-γ+, CD38+, ICOS+ among CD4+TCRVβ6+ cells in co-transferred CD45.1+CD45.2+ WT (top) and CD45.2 Batf−/−Batf3−/− (bottom) TEa CD4+ T cells 6 days after heart transplants. Data are presented as means ± SD (n=5) and are representative of three independent experiments. **, p < 0.01, ***, p < 0.001; unpaired Student’s t test. (C) The co-transferred TEa cells were labeled with CellTrace Violet (CTV) and analyzed for proliferation on day 6 after transplantation by gating onto the CD4+TCRVβ6+ population. Data are representative of three independent experiments. (D) Bar graphs of spleen CD4+TCRVβ6+ TEa cells showing co-transferred CD45.1+CD45.2+ WT and CD45.2 Batf−/−Batf3−/− TEa T cells in relative proportions. Data are presented as means ± SD (n=5) and are representative of three independent experiments. ***, p < 0.001; unpaired Student’s t test. (E) FACS plots showing CD69 and annexin V expression by co-transferred WT TEa and Batf−/−Batf3−/− TEa T cells by gating onto the the CD4+TCRVβ6+ fraction from heart transplant recipients. Data are representative of three independent experiments.

Similar articles

Cited by

References

    1. Siu JHY, Surendrakumar V, Richards JA, Pettigrew GJ. T cell Allorecognition Pathways in Solid Organ Transplantation. Front Immunol. 2018;9:2548. - PMC - PubMed
    1. Chang JT, Wherry EJ, Goldrath AW. Molecular regulation of effector and memory T cell differentiation. Nat Immunol. 2014;15(12):1104–1115. - PMC - PubMed
    1. Murphy TL, Tussiwand R, Murphy KM. Specificity through cooperation: BATF-IRF interactions control immune-regulatory networks. Nat Rev Immunol. 2013;13(7):499–509. - PubMed
    1. Yukawa M, Jagannathan S, Vallabh S, et al. AP-1 activity induced by co-stimulation is required for chromatin opening during T cell activation. J Exp Med. 2020;217(1): e20182009. - PMC - PubMed
    1. Pollizzi KN, Powell JD. Integrating canonical and metabolic signalling programmes in the regulation of T cell responses. Nat Rev Immunol. 2014;14(7):435–446. - PMC - PubMed

Publication types

Substances