. 2021 Dec 8;11(12):jkab349.
doi: 10.1093/g3journal/jkab349.

Genome-wide phenotypic RNAi screen in the Drosophila wing: phenotypic description of functional classes

Affiliations

Genome-wide phenotypic RNAi screen in the Drosophila wing: phenotypic description of functional classes

Ana López-Varea et al. G3 (Bethesda). .

Abstract

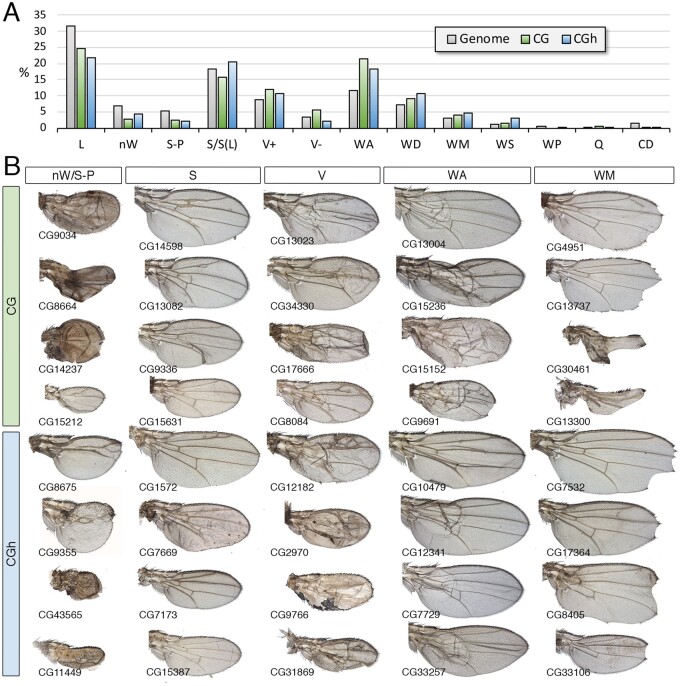
The Drosophila genome contains approximately 14,000 protein-coding genes encoding all the necessary information to sustain cellular physiology, tissue organization, organism development, and behavior. In this manuscript, we describe in some detail the phenotypes in the adult fly wing generated after knockdown of approximately 80% of Drosophila genes. We combined this phenotypic description with a comprehensive molecular classification of the Drosophila proteins into classes that summarize the main expected or known biochemical/functional aspect of each protein. This information, combined with mRNA expression levels and in situ expression patterns, provides a simplified atlas of the Drosophila genome, from housekeeping proteins to the components of the signaling pathways directing wing development, that might help to further understand the contribution of each gene group to wing formation.

Keywords: RNAi; phenotype; screen; wing.


Conflict of interest statement

The authors declare that there is no conflict of interest.

Figures

Figure 1
Figure 1
Ribosomal class. (A) Distribution of the 235 genes included in the ribosomal class. Cytoplasmic large and small ribosomal subunits (CLRP and CSRP), Mitochondrial large and small ribosomal subunits (MLRP and MSRP) and Ribosomal-associated proteins (RAP). (B) Percentage of genes of the ribosomal class groups for which we tested its knockdown phenotype (Done; dark gray column), genes expressed in the wing disc (Exp; light gray column), and genes with a lethal or visible phenotype in knockdown conditions (Phe; striped column). (C) Frequency of mutant phenotypes observed in the CLRP, CSRP, MLRP, MSRP, and RAP groups: L (lethal), nW (failure to form the wing), S-P (changes in the size of the wing and relative positions of the veins), S (size of the wing), V (including ectopic or thicker veins and loss of veins), WA (failures in the adhesion between the dorsal and ventral wing surfaces), and WD (altered cuticular differentiation). The phenotypes WS (shape of the wing), WM (defects in the wing margin), CD (changes in cell size or trichome differentiation), WP (changes in wing pigmentation), and Q (differentiation of ectopic bristles in the wing and loss of bristles in the wing margin) were grouped as “Others” (OTH). (D–G) Expression pattern in the wing disc of the genes CG7354 (mRpS26), CG13880 (mRpL17), CG12275 (RpS10a), and CG5497 (mRpS28), showing robust and generalized expression. In situ hybridizations pictures correspond to experiments published as supplementary material in Molnar et al. (2012), Organista et al. (2015), and Hevia et al. (2017). (H–H’) Adult wings of UAS-Dicer2/+; nub-Gal4/UAS-CG4338-RNAi (H) and UAS-Dicer2/+; salEPv-Gal4/UAS-CG4338-RNAi, showing the transition from “nW” to “S” phenotype. (I, J) Adult wings of UAS-Dicer2/+; nub-Gal4/UAS-betaNACtes3-RNAi (I) and UAS-Dicer2/+; nub-Gal4/UAS-RpL37b-RNAi. (K–K’) Adult wings of UAS-Dicer2/+; nub-Gal4/UAS-RpL27-RNAi (K) and UAS-Dicer2/+; salEPv-Gal4/UAS-RpL27-RNAi (K’), showing the more frequently observed transition from a “nW” to a “S-P” phenotype. (L) Adult wing of UAS-Dicer2/+; salEPv-Gal4/UAS-RpS18-RNAi genotype showing the more frequently found class of S-P phenotype.
Figure 2
Figure 2
Cell adhesion class. (A) Distribution of the 277 genes included in the Cell adhesion class into the groups Adherent and septate junctions (AJ/SJ), Cell adhesion molecules excluding Immunoglobulin domain-containing proteins (CAM), Extracellular matrix adhesion (ECM), and Cell adhesion molecules containing Immunoglobulin domains (IG). (B) Percentages of genes for which we tested its knockdown phenotype (Done; dark gray column), of genes expressed in the wing disc (Exp; light gray column), and of genes with a lethal or visible phenotype in knockdown conditions (Phe; striped column) for the classes AJ/SJ, CA, ECM, and IG. (C) Frequency of lethal (L) and visible mutant phenotypes observed in the AJ/SJ, CA, ECM, and IG groups. Notice the high frequency of WA phenotypes in the ECM group compared to other groups. (D) Examples of expression patterns in the wing disc for different members of the CA class (name of each gene in the bottom right corner of each picture). The genes CG18657 and CG42677 show restricted expression to the ventral compartment and to the interveins, respectively. In situ hybridizations pictures correspond to experiments published as supplementary material in Molnar et al. (2012), Organista et al. (2015), and Hevia et al. (2017). (E) Wing phenotypes of representative examples of knockdowns of CA genes belonging to the AJ/SJ, CA, and ECM groups. All genotypes are from UAS-Dicer2/+; nub-Gal4/UAS-RNAi flies. The name of each gene is given in the bottom-left corner of each wing picture.
Figure 3
Figure 3
Protein class. (A) Distribution of the 1689 genes included in the Protein class into the groups peptidases (PEP), Ubiquitin ligases and transferases (UBIT), post-transcriptional protein modifications other than sugar, kinases, and phosphatases and ubiquitinylases (MOD), protein modifications by sugars (GLU), kinases (KIN), chaperons (CHAP), phosphatases (PHO), and components of the proteasome (PTS). (B) Percentages of genes for which we tested its knockdown phenotype (Done; dark gray column), of genes expressed in the wing disc (Exp; light gray column), and of genes with a lethal or visible phenotype in knockdown conditions (Phe; striped column) for the classes PEP, UBIT, MOD, GLU, KIN, CHAP, PHO, and PTS. (C) Frequency of lethal (L) and visible mutant phenotypes (colored columns) observed in the classes PEP, UBIT, MOD, GLU, KIN, CHAP, PHO, and PTS groups. Note the high frequency of lethal combinations in the CHAP and PTS classes and of wing size phenotypes in the KIN class compared to other groups. (D) Examples of expression patterns in the wing disc for different members of the Protein class (name of each gene in the bottom-left corner of each picture). The genes are ordered from not expressed in the wing disc (left) to ubiquitous and patterned expression (right). In situ hybridizations pictures correspond to experiments published as supplementary material in Molnar et al. (2012), Organista et al. (2015), and Hevia et al. (2017). (E) Representative wings of knockdowns for genes of the MOD (up), PEP, UBIT, GLU, and CHAP groups belonging to the Protein class. All genotypes are from UAS-Dicer2/+; nub-Gal4/UAS-RNAi flies. The gene names are displayed in the bottom-left corner of each wing picture.
Figure 4
Figure 4
RNA class. (A) Distribution of the 851 genes included in the RNA class into the groups “Splicing” (SP), RNA binding (BND), mRNA processing (MOD), tRNA (tRNA), Translation initiation factors (TNLF), ribosomal RNA (rRNA), RNA enzymes (ENZ), and RNA molecules distinct to tRNA, mRNA, and rRNA (OTH). (B) Percentages of genes for which we tested its knockdown phenotype (Done; dark gray column), of genes expressed in the wing disc (Exp; light gray column), and of genes with a lethal or visible phenotype in knockdown conditions (Phe; striped column) for the groups SP, BND, MOD, tRNA, TNLF, rRNA, ENZ, and OTH. (C) Frequency of lethal (L) and visible mutant phenotypes observed for the groups SP, BND, MOD, tRNA, TNLF, rRNA, ENZ, and OTH. Note the high frequency of lethal combinations in the SP, tRNA, TNLF, ENZ, and rRNA groups and of wing size phenotypes in the BND, MOD, and TNLF groups compared to other groups. (D) Examples of expression patterns in the wing disc for different members of the RNA class (name of each gene in the bottom-left corner of each picture). Most genes are expressed in a ubiquitous manner in the wing disc. In situ hybridizations pictures correspond to experiments published as supplementary material in Molnar et al. (2012), Organista et al. (2015), and Hevia et al. (2017). (E) Representative wings of knockdowns of RNA genes belonging, from top to bottom, to the tRNA (up), MOD, ENZ, BND, rRNA, TNLF, and SP (bottom) groups. Genotypes for CG3689, CG9218, CG11342, CG8435, CG4152, and CG1796 genes are from UAS-Dicer2/+; salEPv-Gal4/UAS-RNAi flies. The remaining are from UAS-Dicer2/+; nub-Gal4/UAS-RNAi flies. The name of each particular gene is given in the bottom-left corner of each wing picture.
Figure 5
Figure 5
DNA class. (A) Distribution of the 1598 genes included in the DNA class into the groups “Chromosomal maintenance and structure” (CHRO), Chromatin modifying proteins and protein complexes (CMC), DNA modifying enzymes (ENZ), DNA replication (REP), General transcription factors (GTF), and sequence-specific transcription factors (TF). (B) Percentages of genes within each class for which we tested its knockdown phenotype (Done; dark gray column), of genes expressed in the wing disc (Exp; light gray column), and of genes with a lethal or visible phenotype in knockdown conditions (Phe; striped column). (C) Frequency of lethal (L) and visible mutant phenotypes observed in the classes CHRO, CMC, ENZ, REP, GTF, and TF. Notice the high frequency of lethal combinations in the GFT class, of wing veins effects in the CMC and ENZ classes. The increase in other phenotypes (OTH) observed in the REP class corresponds to cell differentiation phenotypes. (D) Examples of expression patterns in the wing disc for different members of the DNA class (name of each gene in the bottom-left corner of each picture). Most genes are expressed in a ubiquitous manner in the wing disc. In situ hybridizations pictures correspond to experiments published as supplementary material in Molnar et al. (2012), Organista et al. (2015), and Hevia et al. (2017). (E) Representative wings of knockdowns of DNA genes belonging, from top to bottom, to the CHRO (up), CMC, ENZ, REP, and GTF (bottom) classes. All genotypes except His1:CG31617, Cap-G, His3:CG31613, and dmt are from UAS-Dicer2/+; nub-Gal4/UAS-RNAi flies. His1:CG31617, Cap-G, His3:CG31613, and dmt are from UAS-Dicer2/+; salEPv-Gal4/UAS-RNAi flies. The name of each gene is given in the bottom-left corner of each wing picture.
Figure 6
Figure 6
Signaling class. (A) Distribution of the 880 genes included in the Signaling class into the groups Gustatory receptors, Neural peptides, and odorant-binding proteins (GR/NP/OBP), G-Protein coupled receptors (GPCR), Receptor tyrosine kinase pathways (RTK), Insulin receptor and Inositol phosphate signaling pathways (INR), Notch signaling pathway (NOTCH), BMP and TGFβ signaling pathways (BMP/TGF), Toll receptors signaling pathway (TOLL), Wnt signaling pathway (WNT), Hippo/Salvador/Warts signaling pathways (HIPPO), Jun Kinase signaling pathway (JNK), ecdysone and Juvenile hormone signaling (EC/JH), Hedgehog signaling (HH), JAK/STAT signaling (JAK), and other signaling molecules (OTH). (B) Percentages of genes for which we tested its knockdown phenotype (Done; dark gray column), of genes expressed in the wing disc (Exp; light gray column), and of genes with a lethal or visible phenotype in knockdown conditions (Phe; striped column) for the groups shown in (A). (C) Frequency of lethal (L) and visible mutant phenotypes observed in the classes RTK, INR/IPS, NOTCH, BMP/TGF, TOLL, WNT, HSW, JNK, HH, and JAK. Note the high frequency of size defects in the INR/IPS and HIPPO classes, of vein defects in the RTK and BMP/TGF classes and of loss of wing tissue or strong defects in wing size and pattern in the HH and JNK classes. The increase in other phenotypes (OTH) observed in the NOTCH class corresponds to wing margin defects. (D) Representative wings of knockdowns Signaling class genes belonging, from top to bottom, to the RTK, INR/IPS, NOTCH, BMP, TGF, HSW, and HH classes. Wings corresponding to drk, Ras85D, dos, rl, csw, ksr, and cnk are from UAS-Dicer2/+; salEPv-Gal4/UAS-RNAi flies and the rest from UAS-Dicer2/+; nub-Gal4/UAS-RNAi flies. The name of each particular gene is given in the bottom-left corner of each wing picture.
Figure 7
Figure 7
Metabolism class. (A) Distribution of the 1631 genes included in the Metabolism class into the groups Lipid metabolism (LIP), amino acid, nucleotides, and other small molecules metabolism (AA/NT/O), Detoxifying enzymes (DTOX), Mitochondrial biology and mitochondrial respiratory chain (MIT), Sugars metabolism (GLY), Oxido-reduction metabolism (RDX), and other metabolic processes including Central metabolism, autophagy, one-carbon metabolism, metal metabolism, and xenobiotic metabolism (OTH). (B) Percentages of genes within each group for which we tested the knockdown phenotype (Done; gray column), of genes expressed in the wing disc (Exp; light gray column), and of genes with a lethal or visible phenotype in knockdown conditions (Phe; striped column). (C) Frequency of lethal (L) and visible mutant phenotypes observed in the groups LIP, AA/NT/O, DTOX, MIT, GLY, OTH, and RDX. (D) Examples of expression patterns in the wing disc for different members of the Metabolism class (name of each gene in the bottom-left corner of each picture). Most genes are expressed in a ubiquitous manner in the wing disc. In situ hybridizations pictures correspond to experiments published as supplementary material in Molnar et al. (2012), Organista et al. (2015), and Hevia et al. (2017). (E) Representative wings of knockdowns of Metabolism genes belonging, from top to bottom, to the AA/NT (top), DTOX, GLY, and LIP (bottom) classes. Wings corresponding to Lsd-2, Gbs-70E, and Hmgcr are from UAS-Dicer2/+; salEPv-Gal4/UAS-RNAi flies and the remaining from UAS-Dicer2/+; nub-Gal4/UAS-RNAi flies. The name of each gene is given in the bottom-left corner of each wing picture.
Figure 8
Figure 8
Cuticle class. (A) Distribution of the 387 genes included in the “Cuticle” class into the groups “Cuticular Protein Families” (CPF), “Chitin binding domain containing proteins” (CBDCP), Mucins, Glue proteins, Chitin deacetylase-like family and yellow family (MU/Y), and Chorion and vitelline membrane proteins (CO/VM). (B) Percentages of genes within each group for which we tested the knockdown phenotype (Done; dark gray column), of genes expressed in the wing disc (Exp; light gray column), and of genes with a lethal or visible phenotype in knockdown conditions (Phe; striped column). (C) Frequency of lethal (L) and visible mutant phenotypes observed in the CPF, CBDCP, Mu/Y, and CO/VM groups. Note the high frequency of “Size” phenotypes in the CPF group. (D) Examples of expression patterns in the wing disc for different members of the Cuticle class (name of each gene in the bottom-left corner of each picture). In situ hybridizations pictures correspond to experiments published as supplementary material in Molnar et al. (2012), Organista et al. (2015), and Hevia et al. (2017). (E) Representative wings of knockdowns of Cuticle genes belonging, from top to bottom, to the CBDCP, CO/VM, and CPF groups. All wings correspond to UAS-Dicer2/+; nub-Gal4/UAS-RNAi flies. The name of each gene is given in the bottom-left corner of each wing picture.
Figure 9
Figure 9
Expression analysis of the CG and CGh classes. (A) Percentage in the genome of members of the functional classes CG (CG, green sector, 2084 genes) and CGh (CGh, blue sector, 1675 genes). (B) Percentage of CG (green columns) and CGh (blue columns) genes analyzed in knockdown conditions (Done), expressed in the wing disc (Exp), and resulting in lethality or a mutant phenotype (Phe). The same values are indicated as a reference for the entire genome (gray columns). (C) Percentage of CG (CG, green column, 44 genes) and CGh genes (CGh, blue columns, 58 genes), and all functional classes grouped together (Genome, gray columns; 562 genes) expressed in a ubiquitous manner (GEN), not expressed (NE), and expressed in a spatial pattern (PAT). (D) Examples of expression patterns in the wing disc for different members of the CG and CGh classes. The name of each gene is indicated in the bottom-left corner of each picture. In situ hybridizations pictures correspond to experiments published as supplementary material in Molnar et al. (2012), Organista et al. (2015), and Hevia et al. (2017).
Figure 10
Figure 10
Phenotypic analysis of the CG and CGh classes. (A) Frequency of knockdown phenotypes for genes belonging to the CG class (green columns) and CGh class (blue columns) compared to the genome (gray columns). Lethal combinations (lethal), lack of wing (nW) defects in wing size and pattern (S-P), defects in wing size (S), differentiation of ectopic or thicker veins (V+), loss of veins (V−), appearance of wing blisters (WA), wing differentiation defects (WD), loss of wing margin structures (WM), alterations in wing shape (WS), defects in cuticle pigmentation (WP), appearance of extra bristles in the wing surface or loss of bristles in the wing margin (Q) and defects in trichome differentiation and cell size (CD). (B) Representative wings of knockdowns of CG (upper rows, green code) and CGh (lower rows, blue code) belonging, from left to right, to the phenotypic classes nW/S-P, S, V (V+ and V−), wing adhesion (WA) and wing margin (WM). Wings corresponding to CG8675 and dy are from UAS-Dicer2/+; salEPv-Gal4/UAS-RNAi flies, the remaining wings from UAS-Dicer2/+; nub-Gal4/UAS-RNAi flies. The name of each particular gene is given in the bottom-left corner of each wing picture.

References

    1. Adams MD, Celniker SE, Holt RA, Evans CA, Gocayne JD, et al.2000. The genome sequence of Drosophila melanogaster. Science. 287:2185–2195. - PubMed
    1. Ashburner M, Ball CA, Blake JA, Botstein D, Butler H, et al.2000. Gene ontology: tool for the unification of biology. Nat Genet. 25:25–29. - PMC - PubMed
    1. Beira JV, Paro R.. 2016. The legacy of Drosophila imaginal discs. Chromosome. 125:573–592. - PMC - PubMed
    1. Bejarano F, Luque CM, Herranz H, Sorrosal G, Rafel N, et al.2008. A gain-of-function suppressor screen for genes involved in dorsal–ventral boundary formation in the Drosophila wing. Genetics. 178:307–323. - PMC - PubMed
    1. Bilousov O, Koval A, Keshelava A, Katanaev VL.. 2014. Identification of novel elements of the Drosophila blisterome sheds light on potential pathological mechanisms of several human diseases. PLoS One. 9:e101133. - PMC - PubMed

Publication types

Substances

LinkOut - more resources