. 2021 Dec 8;11(12):jkab351.
doi: 10.1093/g3journal/jkab351.

Genome-wide phenotypic RNAi screen in the Drosophila wing: global parameters

Affiliations

Genome-wide phenotypic RNAi screen in the Drosophila wing: global parameters

Ana López-Varea et al. G3 (Bethesda). .

Abstract

We have screened a collection of UAS-RNAi lines targeting 10,920 Drosophila protein-coding genes for phenotypes in the adult wing. We identified 3653 genes (33%) whose knockdown causes either larval/pupal lethality or a mutant phenotype affecting the formation of a normal wing. The most frequent phenotypes consist of changes in wing size, vein differentiation, and patterning, defects in the wing margin and in the apposition of the dorsal and ventral wing surfaces. We also defined 16 functional categories encompassing the most relevant aspect of each protein function and assigned each Drosophila gene to one of these functional groups. This allowed us to identify which mutant phenotypes are enriched within each functional group. Finally, we used previously published gene expression datasets to determine which genes are or are not expressed in the wing disc. Integrating expression, phenotypic and molecular information offers considerable precision to identify the relevant genes affecting wing formation and the biological processes regulated by them.

Keywords: RNAi; phenotype; screen; wing.


Conflict of interest statement

The authors declare that there is no conflict of interest.

Figures

Figure 1
Figure 1
Overall results of the screen. (A–D) Expression of the nub-Gal4 driver (GFP; green) in the wing imaginal disc (A), central nervous system (B, C), and salivary gland (D) in third instar larvae of nub-Gal4/UAS-GFP genotype. (C) A higher magnification of B. (E) Number of genes analyzed (blue) and not analyzed (gray) in UAS-Dicer2/+; nub-Gal4/UAS-RNAi combinations. (F) Number of genes with (blue) and without (red) a lethal or visible phenotype in UAS-Dicer2/+; nub-Gal4/UAS-RNAi flies. (G) Number of lethal (dark blue) and viable lines with a visible phenotype (light blue) in UAS-Dicer2/+; nub-Gal4/UAS-RNAi combinations. (H) Early pupal lethal with necrotic wings phenotype (UAS-Dicer2/+; nub-Gal4/UAS-CG4294-i) (I).
Figure 2
Figure 2
Frequency of different wing phenotypes. (A) Overall frequency of adult phenotypes distributed in the groups “nW” (failure to form the wing), “S-P” (changes in the size of the wing and relative positions of the veins), “S/S(L)” (wing size alterations), “V+” (ectopic or thicker veins), “V−” (loss of veins), “WA” (failures in the adhesion between the dorsal and ventral wing surfaces), “WD” (altered wing cuticular differentiation), “WM” (defects in the wing margin), “CD” (changes in cell size or trichome differentiation), “WS” (shape of the wing), “WP” (changes in wing pigmentation), and “Q” (differentiation of ectopic bristles in the wing surface, “Q+”, or loss of bristles in the wing margin, “Q−”). (B–M) Representative examples of wings illustrating the main observed phenotypes. Wild-type control wing (UAS-Dicer2/+; nub-Gal4/UAS-GFP; B), UAS-Dicer2/+; nub-Gal4/UAS- CG42534-i (“WP”; C), UAS-Dicer2/+; nub-Gal4/UAS-hmw-i (“WD”; D), UAS-Dicer2/+; nub-Gal4/UAS-rgn-i (“WA”; E), UAS-Dicer2/+; nub-Gal4/UAS-CG13096-i (“nW”; F), UAS-Dicer2/+; nub-Gal4/UAS-zetaTry-i (“S-P”; G), UAS-Dicer2/+; nub-Gal4/UAS-CG7668-i (“Q+”; H); UAS-Dicer2/+; nub-Gal4/UAS-LysS-i (“WM”; I), UAS-Dicer2/+; nub-Gal4/UAS-CG15631-i (“S”; J), UAS-Dicer2/+; nub-Gal4/UAS-l(2)09851-i (“V+”; K), UAS-Dicer2/+; nub-Gal4/UAS-CG9855-i (“V−”; L) and UAS-Dicer2/+; nub-Gal4/UAS- dyl-i (“CD”; M). Inset in M is a higher magnification of a lateral region of the wing.
Figure 3
Figure 3
Gene expression and phenotypic correlations. (A) Logarithmic representation of the expression values obtained from Affymetrix (Microarray) and RNA-Seq expression values (values equal to 0 are not represented in the logarithmic scale). Nonconcordant data are shown as red circles (R2 = 0.0) and concordant data as black (R2 = 0.02) and gray circles (R2 = 0.69) for genes not expressed or expressed, respectively. (B) Percentage of genes showing expression or not expression in both Affymetrix and RNA-seq data (gray section of the column) and genes with nonconcordant values of expression (red column section of the column). (C) Expression detected by in situ hybridization were grouped in spatial PAT, GEN, and NE. For each group dark blue section of each column represents the percentage of genes defined as expressed in the wing disc and light blue section of each column those not expressed in Affymetrix or RNA-Seq experiments. (D) Percentage of genes defined as expressed (dark blue section of each column) or not expressed (light blue columns) without a knockdown phenotype (wt), lethality (L), or a visible phenotype (Phe) in UAS-Dicer2/+; nub-Gal4/UAS-RNAi combinations. (E) Percentage of genes defined as expressed (dark blue section of each column) or not expressed (light blue section of each column) resulting in loss of wing (“nW”), size and pattern defects (“S-P”), size defects (“S/S(L)”), loss or gain of vein phenotypes (“V+/V−”), loss of dorso-ventral adhesion (“WA”), defects in wing differentiation defects (“WD”), and other less frequent phenotypes (“OTH”). (F) Examples of in situ hybridization patterns showing the levels of expression detected in Affymetrix and RNA-Seq experiments (Affymetrix/RNA-Seq) in the up-right corner of each picture.
Figure 4
Figure 4
Analysis of salEPv-Gal4/UAS-RNAi combinations. (A) Expression pattern of the salEPv-Gal4 driver (GFP, green) in third instar wing imaginal disc of salEPv-Gal4 UAS-GFP/+. Nuclei are stained with ToPro (blue). (B) Phenotypic frequency of UAS-Dicer2/+; salEPv-Gal4/UAS-RNAi combinations resulting in a mutant phenotype (blue section of each column) or wild-type wings (red section of each column) from UAS-RNAi lines that gave lethality (L), a visible phenotype (Phe), folded wings without additional phenotypes (WF), and folded wings with an additional phenotype (WF/Phe) in UAS-Dicer2/+; nub-Gal4 UAS-RNAi/+ combinations. (C) Fraction of salEPv-Gal4 UAS-RNAi/+ mutant phenotypes observed with UAS-RNAi lines that were lethal in combination with nub-Gal4. OTH: other phenotypes (V+, V−, WA, WD, WM, WP). (D–I) Examples of wings showing the phenotype of combinations of the same UAS-RNAi line with nub-Gal4 (left) and salEPv-Gal4 (right). (D–D’) UAS-Dicer2/+; nub-Gal4/UAS-CG6299-i (D) and UAS-Dicer2/+; salEPv-Gal4/UAS-CG6299-i (D’). (E–-E’) UAS-Dicer2/+; nub-Gal4/UAS-Mtr4-i (E) and UAS-Dicer2/+; salEPv-Gal4/UAS-Mtr4-i (E’). (F–F’) UAS-Dicer2/+; nub-Gal4/UAS-CG46491-i (F) and UAS-Dicer2/+; salEPv-Gal4/UAS-CG46491-i (F’). (G–G’) UAS-Dicer2/+; nub-Gal4/UAS-Atx2-i (G) and UAS-Dicer2/+; salEPv-Gal4/UAS-Atx2-i (G’). (H–H’) UAS-Dicer2/+; nub-Gal4/UAS-CG2246-I (H) and UAS-Dicer2/+; salEPv-Gal4/UAS-CG2246-i (H’). (I–I’) UAS-Dicer2/+; nub-Gal4/UAS-Su(var)2-10-i (I) and UAS-Dicer2/+; salEPv-Gal4/UAS- Su(var)2-10-i (I’).
Figure 5
Figure 5
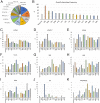
Classification of Drosophila genes into functional classes and examples of phenotypic frequencies within classes. (A) Percentage of protein-coding genes included in the molecular/functional classes “CG” (dark blue; 2084 genes) , “PRO” (Protein biology; orange; 1689 genes), “CGh” (dark gray; 1675 genes), “MET” (Metabolism; light orange; 1631 genes), “DNA” (DNA biology; light blue; 1598 genes), “TRA” (Transport; light green; 954 genes), “SIG” (Signaling; blue; 880 genes), “RNA” (RNA biology; brown; 851 genes), “PTR” (Protein transport; gray; 659 genes), “CYT” (Cytoskeleton; dark green; 513 genes), “CUT” (Cuticle; light blue; 387 genes), “CA” (Cellular adhesion; light green; 277 genes), “DIV” (Cell division; light gray; 245 genes), “RIB” (Ribosome; pink; 235 genes), “IMM” (Immune responses; gray; 216 genes), and “CD” (Cell death; yellow; 63 genes). (B) Percentage of genes in the screen causing a lethality or a visible phenotype in each molecular class. (C–K) Percentage of genes with a particular phenotype in each molecular class compared to the same values for the entire genome (Genome, white columns). Each column represents for each molecular class and the genome the frequency of lethality (Lethal; C), loss of wing and/or defects in wing size and pattern (nW/S/P; D), changes in wing size [S/S(L); E], defects in vein formation (V; F), failures in the adhesion between the dorsal and ventral wing surfaces (WA; G), defects in wing cuticular differentiation (WD; H), partial loss of wing margin structures (WM; I), Trichome differentiation (CD; J) and other less frequently observed phenotypes (WS/WP/Q).
Figure 6
Figure 6
Phenotypic frequencies for genes not expressed in the wing disc. (A) Percentage of lethality or visible phenotypes in UAS-Dicer2/+; nub-Gal4/UAS-RNAi flies for genes that were considered as not being expressed in the wing disc. The white column is for the total number of genes not expressed and the colored columns from left to right for genes grouped in the molecular classes RNA, RIB, DIV, PTR, CYT, DNA, CD, CA, SIG, PRO, MET, TRA, CGh, IMM, CUT, and CG. (B) Example of wings with a mutant phenotype from knockdown of genes (name below each wing) not expected to be expressed in the wing disc. The values of expression intensity detected in Affimetrix and RNA-Seq experiments (Affimetrix/RNA-Seq) are indicated in the upper right corner of each picture. The molecular class of each gene is indicated in the lower-right corner of each wing.
Figure 7
Figure 7
Examples of wing phenotypes for the SIG, CGh, and CG functional classes. (A) UAS-Dicer2/+; nub-Gal4/UAS-aph1-RNAi. (B) UAS-Dicer2/+; nub-Gal4/UAS-spz6-RNAi. (C) UAS-Dicer2/+; nub-Gal4/UAS-pygo-RNAi. (D) UAS-Dicer2/+; nub-Gal4/UAS-ttv-RNAi. (E) UAS-Dicer2/+; nub-Gal4/UAS-Fs-RNAi. (F) UAS-Dicer2/+; nub-Gal4/UAS-Cnot4-RNAi. (G) UAS-Dicer2/+; nub-Gal4/UAS-CG13711-RNAi. (H) UAS-Dicer2/+; nub-Gal4/UAS-l(3)05822-RNAi. (I) UAS-Dicer2/+; nub-Gal4/UAS-CG8405-RNAi. (J) UAS-Dicer2/+; nub-Gal4/UAS-CG12093-RNAi. (K) UAS-Dicer2/+; nub-Gal4/UAS-CG14797-RNAi. (L) UAS-Dicer2/+; nub-Gal4/UAS-Stoml2-RNAi. The functional class of each gene is indicated in the upper right corner of each picture.
Figure 8
Figure 8
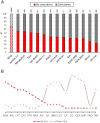
Correlation of the wing screen with other RNAi genetic screens. (A) The left column represents the percentage of genes with lethality or visible phenotype in UAS-Dicer2/+; nub-Gal4/UAS-RNAi (striped gray section) or without any phenotype (striped red section). The following columns represent the percentage of genes identified in each screen that also give a phenotype in the wing screen (gray section; coincidence). The percentage of genes identified in each screen that do not give a phenotype in the wing screen is represented in the red section of each column (No coincidence). (B) Number of times that a particular molecular class (DNA, RIB, CYT, DIV, PTR, RNA, SIG, CD, IMM, CUT, CA, CG, CGh, MET, PRO, and TRA) appear over-represented (2x) or under-represented (2x) in 11 independent screens with respect to the fraction of genes included in each molecular class in the genome. Dark red lines indicate over-representation and light red lines under-representation.

References

    1. Adams MD, Celniker SE, Holt RA, Evans CA, Gocayne JD, et al.2000. The genome sequence of Drosophila melanogaster. Science. 287:2185–2195. - PubMed
    1. Ashton-Beaucage D, Udell CM, Gendron P, Sahmi M, Lefrancois M, et al.2014. A functional screen reveals an extensive layer of transcriptional and splicing control underlying RAS/MAPK signaling in Drosophila. PLoS Biol. 12:e1001809. - PMC - PubMed
    1. Baeg GH, Zhou R, Perrimon N.. 2005. Genome-wide RNAi analysis of JAK/STAT signaling components in Drosophila. Genes Dev. 19:1861–1870. - PMC - PubMed
    1. Bai S, Herrera-Abreu M, Rohn J, Racine V, Tajadura V, et al.2011. Identification and characterization of a set of conserved and new regulators of cytoskeletal organization, cell morphology and migration. BMC Biol. 9:54. - PMC - PubMed
    1. Bao R, Dia SE, Issa HA, Alhusein D, Friedrich M.. 2018. Comparative evidence of an exceptional impact of gene duplication on the developmental evolution of Drosophila and the higher diptera. Front Ecol Evol. 6:63.doi:10.3389/fevo.2018.00063.

Publication types

Substances

LinkOut - more resources