

Predicting prognosis in COVID-19 patients using machine learning and readily available clinical data
- PMID: 34601240
- PMCID: PMC8459591
- DOI: 10.1016/j.ijmedinf.2021.104594
Predicting prognosis in COVID-19 patients using machine learning and readily available clinical data
Abstract
Rationale: Prognostic tools for aiding in the treatment of hospitalized COVID-19 patients could help improve outcome by identifying patients at higher or lower risk of severe disease. The study objective was to develop models to stratify patients by risk of severe outcomes during COVID-19 hospitalization using readily available information at hospital admission.
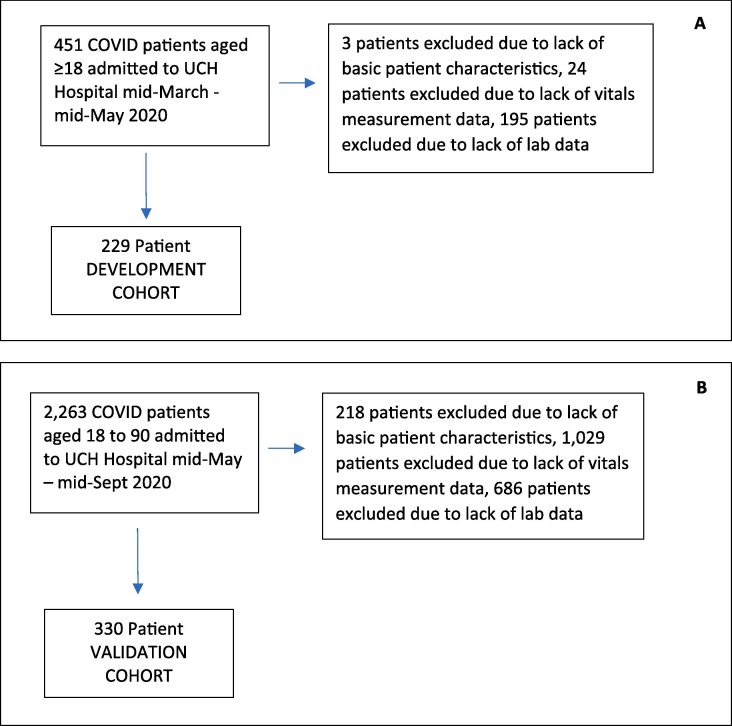
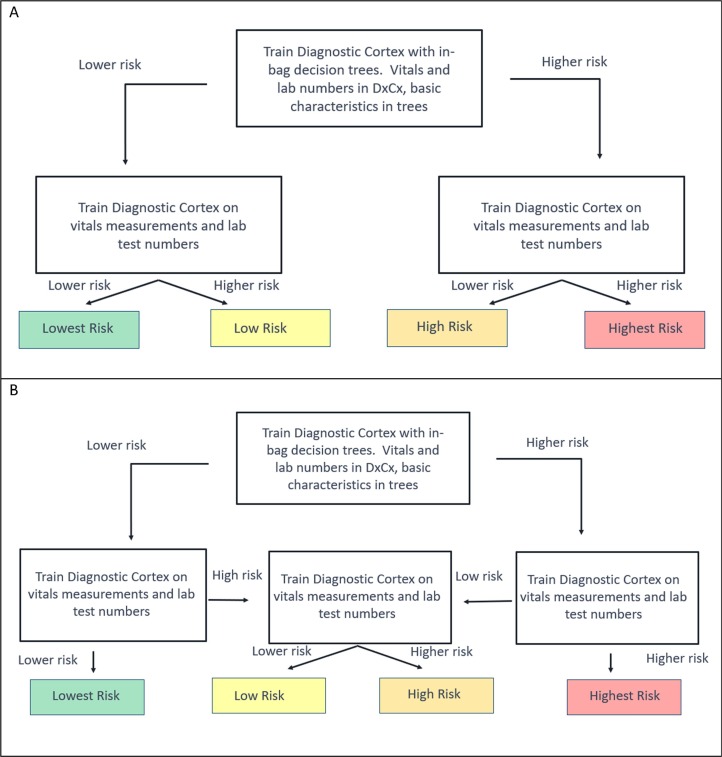
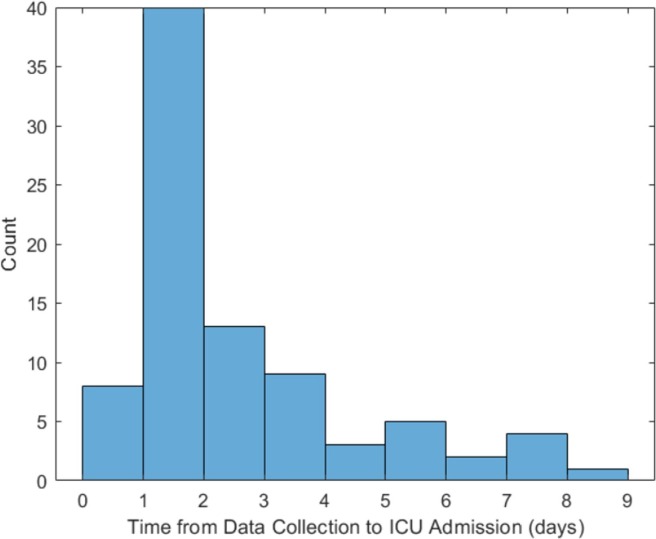
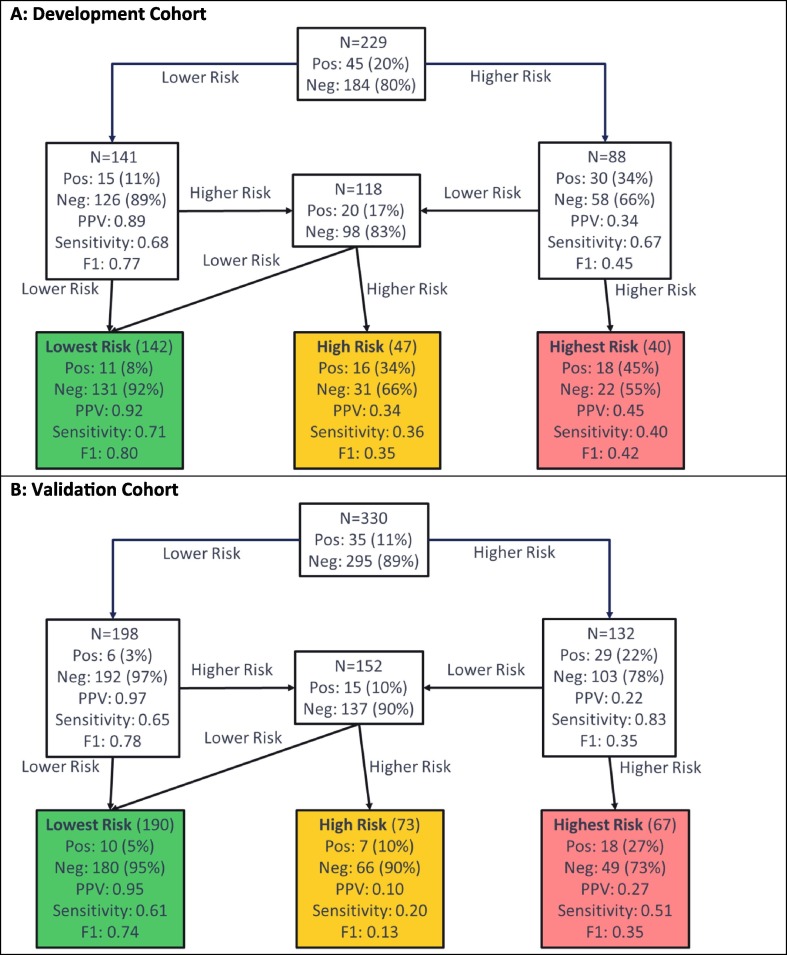
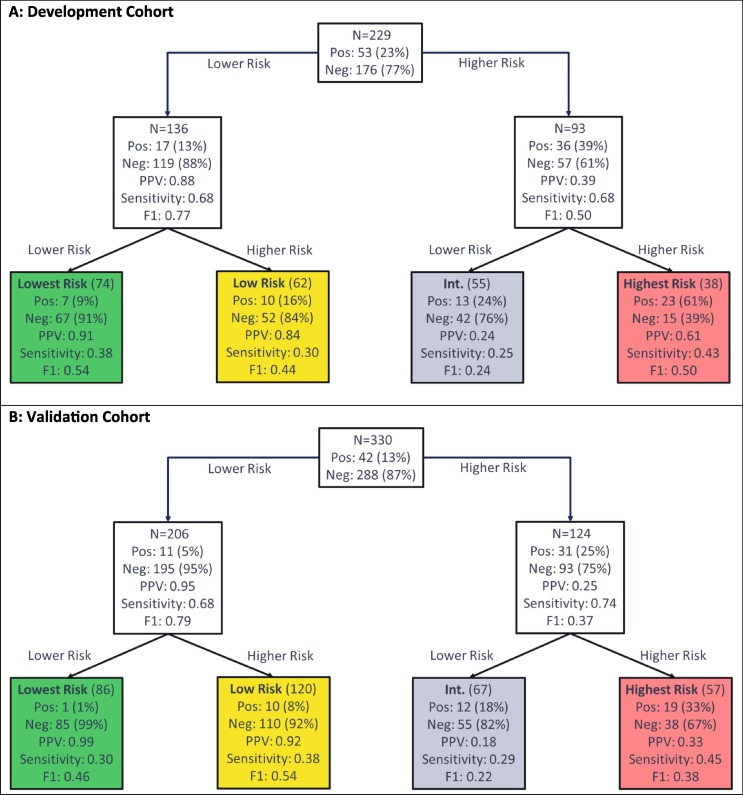
Methods: Hierarchical ensemble classification models were trained on a set of 229 patients hospitalized with COVID-19 to predict severe outcomes, including ICU admission, development of acute respiratory distress syndrome, or intubation, using easily attainable attributes including basic patient characteristics, vital signs at admission, and basic lab results collected at time of presentation. Each test stratifies patients into groups of increasing risk. An additional cohort of 330 patients was used for blinded, independent validation. Shapley value analysis evaluated which attributes contributed most to the models' predictions of risk.
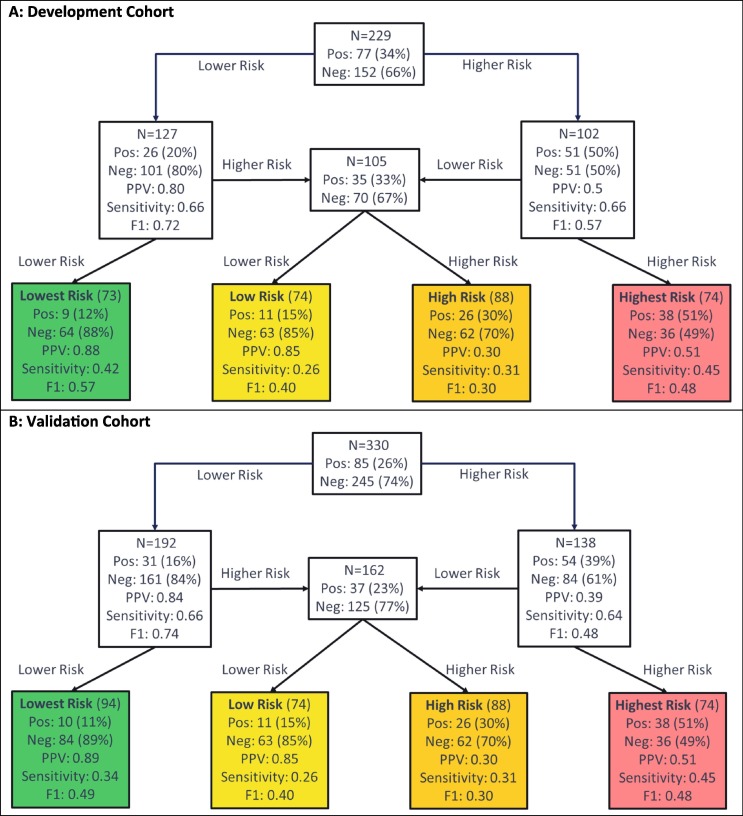
Main results: Test performance was assessed using precision (positive predictive value) and recall (sensitivity) of the final risk groups. All test cut-offs were fixed prior to blinded validation. In development and validation, the tests achieved precision in the lowest risk groups near or above 0.9. The proportion of patients with severe outcomes significantly increased across increasing risk groups. While the importance of attributes varied by test and patient, C-reactive protein, lactate dehydrogenase, and D-dimer were often found to be important in the assignment of risk.
Conclusions: Risk of severe outcomes for patients hospitalized with COVID-19 infection can be assessed using machine learning-based models based on attributes routinely collected at hospital admission.
Keywords: COVID-19; Clinical decision support systems; Machine learning; Prognostic models; Risk assessment.
Copyright © 2021 The Authors. Published by Elsevier B.V. All rights reserved.
Conflict of interest statement
The authors declare the following financial interests/personal relationships which may be considered as potential competing interests: ‘The authors have no major conflicts of interest to disclose. TC, HR, RG, LM, and JR are named as inventors on a provisional patent assigned to Biodesix relevant to the work and hold stock and/or stock options in Biodesix. KE reports grant funding from the NIH during the conduct of the study and grant funding from Gilead and personal fees from Theratechnologies and ViiV outside of the conduct of the study’.
Figures
References
-
- Zhou F., Yu T., Fan G., Liu Y., Liu Z., Xiang J., Wang Y., Song B., Gu X., Guan L., Wei Y., Li H., Wu X., Xu J., Tu S., Zhang Y., Chen H., Cao B. Clinical course and risk factors for mortality of adult inpatients with COVID-10 in Wuhan, China: a retrospective cohort study. Lancet. 2020;395:1054–1062. - PMC - PubMed
-
- Ciceri F., Castagna A., Rovere-Querini P., De Cobelli F., Ruggeri A., Galli L., Conte C., De Lorenzo R., Poli A., Ambrosio A., Signorelli C., Bossi E., Fazio M., Tresoldi C., Colombo S., Monti G., Fominskiy E., Franchini S., Spessot M., Martinenghi C., Carlucci M., Beretta L., Scandroglio A.M., Clementi M., Locatelli M., Tresoldi M., Scarpellini P., Martino G., Bosi E., Dagna L., Lazzarin A., Landoni G., Zangrillo A. Early predictors of clinical outcomes of COVID-19 outbreak in Milan. Italy. Clin Immunol. 2020;217 - PMC - PubMed
MeSH terms
Grants and funding
LinkOut - more resources
Full Text Sources
Medical
Research Materials
Miscellaneous
