. 2022 Jan;20(1):221-240.
doi: 10.1007/s12021-021-09530-x. Epub 2021 Oct 2.

A Comprehensive, FAIR File Format for Neuroanatomical Structure Modeling

Affiliations

A Comprehensive, FAIR File Format for Neuroanatomical Structure Modeling

A E Sullivan et al. Neuroinformatics. 2022 Jan.

Abstract

With advances in microscopy and computer science, the technique of digitally reconstructing, modeling, and quantifying microscopic anatomies has become central to many fields of biological research. MBF Bioscience has chosen to openly document their digital reconstruction file format, the Neuromorphological File Specification, available at www.mbfbioscience.com/filespecification (Angstman et al., 2020). The format, created and maintained by MBF Bioscience, is broadly utilized by the neuroscience community. The data format's structure and capabilities have evolved since its inception, with modifications made to keep pace with advancements in microscopy and the scientific questions raised by worldwide experts in the field. More recent modifications to the neuromorphological file format ensure it abides by the Findable, Accessible, Interoperable, and Reusable (FAIR) data principles promoted by the International Neuroinformatics Coordinating Facility (INCF; Wilkinson et al., Scientific Data, 3, 160018,, 2016). The incorporated metadata make it easy to identify and repurpose these data types for downstream applications and investigation. This publication describes key elements of the file format and details their relevant structural advantages in an effort to encourage the reuse of these rich data files for alternative analysis or reproduction of derived conclusions.

Keywords: FAIR data; Morphological modeling; Neuroimaging; Neuromorphology; Neuron reconstruction; Vasculature reconstruction.


Conflict of interest statement

MBF Bioscience is a commercial entity, and the authors affiliated with them are company employees.

Figures

Fig. 1
Fig. 1
A timeline depicting the evolution of MBF Bioscience’s digital neuron reconstruction between 1960 and 2020. The lines connecting each image to the timeline indicate when in time the tracing was generated. The birth of each data file format is indicated with the line under each file name: ASC (1986), DAT (1988), DAT2 and ASC2 (1995), SWC (1998), XML (2007). The timeline’s colored arrows each represent one decade and are labeled with the first year of that decade. Each neuronal reconstruction includes the publication date below the image. (a) A neuronal reconstruction “produced by the first computer-assisted neuron tracing system, Neurolucida’s ancestor” (Glaser & Vanderloos, 1965). The scale bar equals 100 micrometers. (b) “The hard copy, monochrome output of the neuron of Fig. 3… in the paper, “Neuron imaging with Neurolucida–a PC-based system for image combining microscopy.” (Glaser & Glaser, 1990). The scale bar equals 100 micrometers. (c) A reconstruction of a human supragranular pyramidal cell from the Brodmann area (BA), superior frontopolar zone (BA10). Spines have been mapped using point markers (blue) along the cell’s dendrites (Jacobs et al., 2001). The scale bar equals 100 micrometers. (d) Purkinje cells (PCs) reconstructed using Neurolucida 360 from the cerebellar vermis of male mice (Nedelescu et al., 2018). The scale bar equals 100 micrometers. (e) A Neurolucida 360 reconstruction of a Drosophila pyramidal neuron, showing the soma, apical/ basal dendrites, and axon segments (Gao et al., 2019). The white box demonstrates the approximate location of e’. The scale bar equals 100 micrometers. (e’) A zoomed in look at the 3D spines reconstructions of the cell tracing shown in e. The scale bar equals 25 micrometers
Fig. 2
Fig. 2
(a) The subject and annotation term list selection window within MBF software. The fields in the left section detail the subject information of the sample origin. The fields in the right section determine the anatomical term list provided to the user for annotation. The selected values indicate this sample originated from a 12-week-old male rat with the subject identifier 001. The anatomical term list selected for annotation was the rat kidney term list. The parcellation indicates Species Independent, meaning there currently is no parsed term list for the rat kidney. Instead, a generic term list of all kidney anatomies, independent of species, is provided to the user. (b) A neuromorphological data file related to a microscopy sample from a 12-week old male rat kidney delineated using anatomical terminology from the Foundational Model of Anatomy (FMA) ontology database. The species and < atlas > rootid store IRIs that are linked to the species and the term list origin selected in a. The IRI includes the unique identifier for the species or parcellation
Fig. 3
Fig. 3
Demonstrates the 3D coordinate space with an origin point of (0, 0, 0). The gray planes represent a 3D image volume with an image location coordinate, coord: (x, y, and z). Note the direction of the Z-axis. The most positive image plane of the 3D volume is the first image plane. The following image planes are in the same X and Y location, but their z location descends incrementally based on the z scaling. The units of this coordinate space are in micrometers (µm)
Fig. 4
Fig. 4
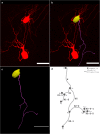
(a) A neuron from the mouse stellate ganglion backfilled with Neurobiotin. A 3D image was acquired on a Leica confocal microscope with a 40x objective lens. The scale bar equals 30 micrometers. The image scaling is: X = 0.2228 μm/pixel, Y = 0.2228 μm/pixel, Z= -0.5 μm. (b) A tracing of the neuron in a created using Neurolucida 360. The data is stored in the neuromorphological file format. The trace data elements include contours that make up the cell body and trees that reconstruct the neuron’s dendrites and axon. The scale bar equals 30 micrometers (Cho et al., 2020)
Fig. 5
Fig. 5
This figure illustrates the application of the multi-resolution image segmentation that is possible with the neuromorphological file format. (a) The 3D image, acquired on a Leica confocal microscope using a 40x objective lens, shows neurons from the stellate ganglion backfilled with Neurobiotin. The scale bar equals 50 micrometers. (b) A neuronal reconstruction obtained from the 40x, high-resolution image in a. Tree elements were used to represent the neuronal dendrites and axons of the cells. The cell bodies are represented using serial z contours, shelled into a three-dimensional volume. (c) A 10x, low-resolution tile scan image was acquired using Leica confocal microscope. The images include the entire stellate ganglion labeled with tyrosine hydroxylase (TH) (cyan) and the neurons backfilled with Neurobiotin (red). This same group of backfilled neurons was imaged at 40x (a). (d) A 3D reconstruction of the 10x, low resolution whole stellate ganglion image (c) overlaid with that image. (e) 2D contours of the ganglia’s area were delineated at serial z image planes. They were shelled into a 3D volume to represent the stellate ganglion (gray). Tree elements were used to represent the path of the nerve fibers stemming from the ganglion. These structures were segmented using the 10x image in c. The 1000 micrometer scale bar shown in e is applicable c, d and e. (f) A zoomed in snapshot of the boxed location displayed over c. Scale bar equals 100 micrometers. (g) A zoomed in snapshot of the boxed location displayed over e. Axon innervation to the Inferior cardiac nerve (top) and Ventral ansa subclavia (bottom) can be mapped and visualized. Scale bar equals 100 micrometers (Cho et al. 2020)
Fig. 6
Fig. 6
(a) The 3D image, acquired on a Leica confocal microscope with a 40x objective lens, shows neurons from the stellate ganglion backfilled with Neurobiotin. (b) A 3D reconstruction of one dendrite and one cell body of the backfilled neuron from the stellate ganglion (a) overlaid with that image. (c) The same reconstruction shown in b with no image data. A model of one cell body (yellow) and one neuronal tree (pink) was produced using Neurolucida 360 (Cho et al., 2020). (d) An unscaled diagram demonstrating the structure of a tree with each segment shown as a line and labeled with the segment name (ex. S2-2-2). The origin (O), nodes (N), and endings (E) of the tree are marked with a circle. The root segment (S) begins with the origin (O) point and terminates with the node (N0). The child segments of N0, S1, and S2 terminate with nodes N1 and N2. The child segments of N1, S1-2, and S1-1 terminate with endings E1 − 1 and E1 − 2. N2 has two child segments, S2-1 and S2-2. Segment S2-1 has no bifurcations, so it terminates with ending E2 − 1. Segment S2-2 bifurcates at node N2 − 1. Lastly, the branches S2-2-1 and S2-2-2 terminate with endings E2 − 2−1 and E2 − 2−2. The scale bars in (a)-(c) are equal to 50 micrometers
Fig. 7
Fig. 7
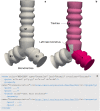
(a) A 3D reconstruction of a bronchial tree utilizing the tree elements of the neuromorphological file format. (b) The Trachea and left main bronchus segments of a lung airway named using the SciCrunch terminology link through MBF Bioscience software. (c) The data representation of the bronchial tree. The point elements that fall directly within the tree element represent the first segment (S1). Segment 1 (S1) of the bronchial tree is classified as the Trachea. The branch element and the points that are enclosed make up segment 2 (S2) of the bronchial tree, classified as the Left main bronchus. Unique identifiers for each term are indicated in the segment’s Trace Association property
Fig. 8
Fig. 8
(a) A diagram of a dendritic spine along a neuronal tree. The five points of the spine are represented with circles. The coordinates of these points are reported in the < property name=”Backbone”> number string including an x, y, and z location along with a thickness, d. The spine head is marked with a gray circle. (b) The Backbone of a spine includes a string of numbers. The line numbers and return spaces present in b were added for clarity and do not exist in the data file structure. Line [1]’s value reports the total number of points that make up the spine. The values from line [2] through [21] make up each of the four spine coordinates (x, y, z, and d). The first point (x = line [2], y = line [3], z = line [4], and d = line [5]) listed is the insertion point where the spine is located along the tree
Fig. 9
Fig. 9
(a) A diagram of the edgelists element of b. Each edgelist and edge id correspond to one of the vessel branches. These are labeled appropriately. The edgelist sourcenode and targetnode inform the start and endpoint of the vessel branch or edge. For example, edge=”4” (E4) begins at node 2 (N2) and ends at node 3 (N3). This connection is indicated in edgelist id = 4 (see b). This connection of the vessel back onto itself creates a loop structure. (b) The data structure for the edgelists child element of a vessel. Each edgelist id attribute corresponds to the edgelist ids in a, informing how the vessel edge elements connect to the node elements. The edge attributes correspond to the edge ids in a. The sourcenode and targetnode values refer to a node id in a. If either the sourcenode or target node values equal − 1, this means that there is no starting or ending node
Fig. 10
Fig. 10
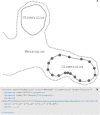
(a) A schematic of contoured regions of a renal corpuscle. The marked point locations (represented as circles on one glomerulus contour) are connected with a line (solid, dashed) to generate an area that represents an anatomical region in two-dimensions. The dashed line represents the mesangium region where the solid lines represent glomeruli. The glomeruli contours are closed where the mesangium is an open contour indicating the structure continues and the contour represents the layer of the mesangium that falls within the renal corpuscle. (b) A Glomerulus contour element, child elements, attributes, and values as they appear in the segmentation data file. This contour is a closed contour indicating the first and last point elements are connected. In this b, the < property > child elements exclude all values for concision with the exception of the TraceAssociation property. The value of the TraceAssociation property is the IRI to the Glomerulus term in the FMA kidney ontology term lists. The point elements have been abbreviated in this b. A contour usually contains a list of many point elements, connected in the order they are listed in the contour
Fig. 11
Fig. 11
The anatomy of the male Fischer rat heart, including the intrinsic cardiac nervous system neurons (yellow), were mapped using MBF Bioscience’s TissueMapper application (a) to create a comprehensive 3D reconstruction (b). (a) The scale bar is equal to 1000 micrometers. (b) The 3D scale bar’s minor ticks are equal to 100 micrometers on the x-axis, 200 micrometers on the y-axis, and 100 micrometers on the z-axis
Fig. 12
Fig. 12
A generic heart scaffold (a) beside segmentation (b) in a multi-viewport 3D environment to identify and mark concordant fiducial points essential for registration with the common coordinate scaffold. The triangle marker in b represents the discrete location of the junction of the superior vena cava and the right atrium. This location is also marked in a in the matching marker color and alongside the associated marker name. The following marker pairs follow the same format as described above for the triangle marker: flower marker (b) = junction of the pulmonary valve and the right ventricle (a), square marker (b) = Junction of aortic value and coronary vessel (a), star marker (b) = Apex (a). (b) The 3D scale bar’s minor ticks are equal to 100 micrometers on the x-axis, 200 micrometers on the y-axis, and 100 micrometers on the z-axis
Fig. 13
Fig. 13
(a) Neuron reconstructions generated with Neurolucida 360 based on the image described in Fig. 5a. Highlighted in white is the axon for cell 18105039-091. The cell ID corresponds to the electrophysiology readings taken for each cell backfilled with Neurobiotin. The scale bar is equal to 100 micrometers (Cho et al. Data set in progress). (b) The names of all created set in the tracing shown in a. The highlighted set, Axon innervates: Ventral ansa subclavia, describes which nerve of the stellate ganglion cell 18105039-091 innervates. (c) The tree element of the axon for cell 18105039-091. The point elements in this tree have been abbreviated using an ellipsis to draw focus to the structure of all created sets for this axon

References

    1. Abrams, M. B., Bjaalie, J. G., Das, S., Egan, G. F., Ghosh, S. S., Goscinski, W. J., Grethe, J. S., Kotaleski, J. H., Wei Ho, E. T., Kennedy, D. N., Lanyon, L. J., Leergaard, T. B., Mayberg, H. S., Milanesi, L., Mouček, R., Poline, J. B., Roy, P. K., Strother, S. C., Tang, T. B., Tiesinga, P., Wachtler, T., Wójcik, D. K., & Martone, M. E. (2021). A standards organization for open and FAIR neuroscience: the International Neuroinformatics Coordinating Facility. Neuroinform. 10.1007/s12021-020-09509-0.
    1. Achanta S, Gorky J, Leung C, Moss A, Robbins S, Eisenman L, Chen J, Tappan S, Heal M, Farahani N, Huffman T, England S, Cheng ZJ, Vadigepalli R, Schwaber JS. A comprehensive integrated anatomical and molecular atlas of rat intrinsic cardiac nervous system. iScience. 2020;23(6):101140. doi: 10.1016/j.isci.2020.101140. - DOI - PMC - PubMed
    1. Angstman, P. J., Tappan, S. J., Sullivan, A. E., Thomas, G. C., Rodriguez, A., Hoppes, D. M., Abdul-Karim, M. A., Heal, M. L., Glaser, J.R. (2020). Neuromorphological File Specification (4.0). Neuromorphological File Specification. Retrieved March 23, 2020, from www.mbfbioscience.com/filespecification
    1. Arellano JI, Benavides-Piccione R, DeFelipe J, Yuste R. Ultrastructure of dendritic spines: correlation between synaptic and spine morphologies. Frontiers in Neuroscience. 2007;1(1):131–131. doi: 10.3389/neuro.01.1.1.010.2007. - DOI - PMC - PubMed
    1. Ascoli GA, Donohue DE, Halavi M. NeuroMorpho.Org: a central resource for neuronal morphologies. Journal of Neuroscience. 2007;27(35):9247–9251. doi: 10.1523/jneurosci.2055-07.2007. - DOI - PMC - PubMed

Publication types

LinkOut - more resources