

SARS-CoV-2 Alpha, Beta, and Delta variants display enhanced Spike-mediated syncytia formation
- PMID: 34601723
- PMCID: PMC8646911
- DOI: 10.15252/embj.2021108944
SARS-CoV-2 Alpha, Beta, and Delta variants display enhanced Spike-mediated syncytia formation
Abstract
Severe COVID-19 is characterized by lung abnormalities, including the presence of syncytial pneumocytes. Syncytia form when SARS-CoV-2 spike protein expressed on the surface of infected cells interacts with the ACE2 receptor on neighboring cells. The syncytia forming potential of spike variant proteins remain poorly characterized. Here, we first assessed Alpha (B.1.1.7) and Beta (B.1.351) spread and fusion in cell cultures, compared with the ancestral D614G strain. Alpha and Beta replicated similarly to D614G strain in Vero, Caco-2, Calu-3, and primary airway cells. However, Alpha and Beta formed larger and more numerous syncytia. Variant spike proteins displayed higher ACE2 affinity compared with D614G. Alpha, Beta, and D614G fusion was similarly inhibited by interferon-induced transmembrane proteins (IFITMs). Individual mutations present in Alpha and Beta spikes modified fusogenicity, binding to ACE2 or recognition by monoclonal antibodies. We further show that Delta spike also triggers faster fusion relative to D614G. Thus, SARS-CoV-2 emerging variants display enhanced syncytia formation.
Keywords: SARS-CoV-2; coronavirus; fusion; spike; syncytia.
© 2021 The Authors.
Conflict of interest statement
CP, HM, and OS have a pending patent application for some of the anti‐SARS‐CoV‐2 mAbs described in the present study (PCT/FR2021/070522).
Figures
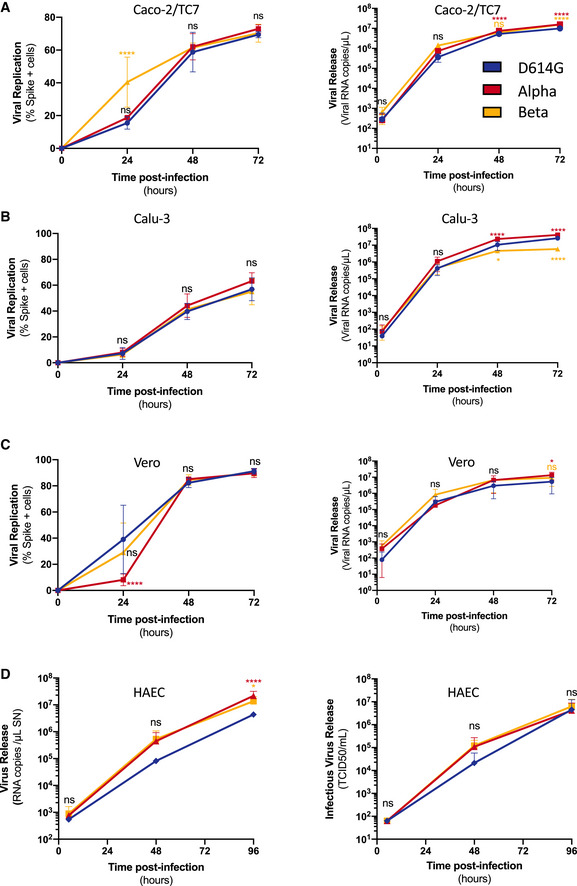
- A–D
Cells were infected at the indicated MOI. Viral replication (left) and release (right) were assessed by flow cytometry and RT‐qPCR. (A) Caco2/TC7 cells (MOI 0.01), (B) Calu‐3 cells (MOI 0.001), (C) Vero cells (MOI 0.01), (D) primary human airway epithelial cells (HAEC) virus release (Right) and infectious virus release (Left) (MOI 0.01). Data are mean ± SD of at least three independent experiments. Statistical analysis: mixed‐effect analysis or two‐way ANOVA compared with D614G reference, ns: non‐significant, *P < 0. 05, ****P < 0.0001.
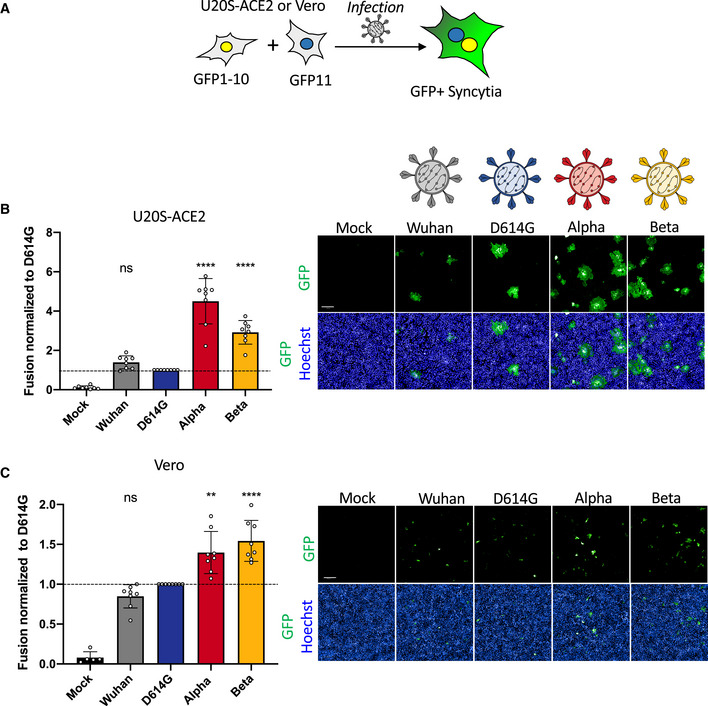
U2OS‐ACE2 or Vero cells expressing either GFP 1–10 or GFP 11 (1:1 ratio) were infected 24 h after plating and imaged 20 h (U2OS‐ACE2) or 48 h (Vero) post‐infection.
Left Panel: Fusion was quantified by GFP area/ number of nuclei and normalized to D614G for U2OS‐ACE2 20 h post‐infection at MOI 0.001. Right Panel: Representative images of U2OS‐ACE2 20 h post‐infection, GFP‐Split (green), and Hoechst (blue). Top and bottom are the same images with and without Hoechst channel.
Left Panel: Quantified fusion of Vero cells infected at MOI 0.01. Right Panel: Representative images of Vero cells 48 h post‐infection, GFP‐Split (green), and Hoechst (blue).
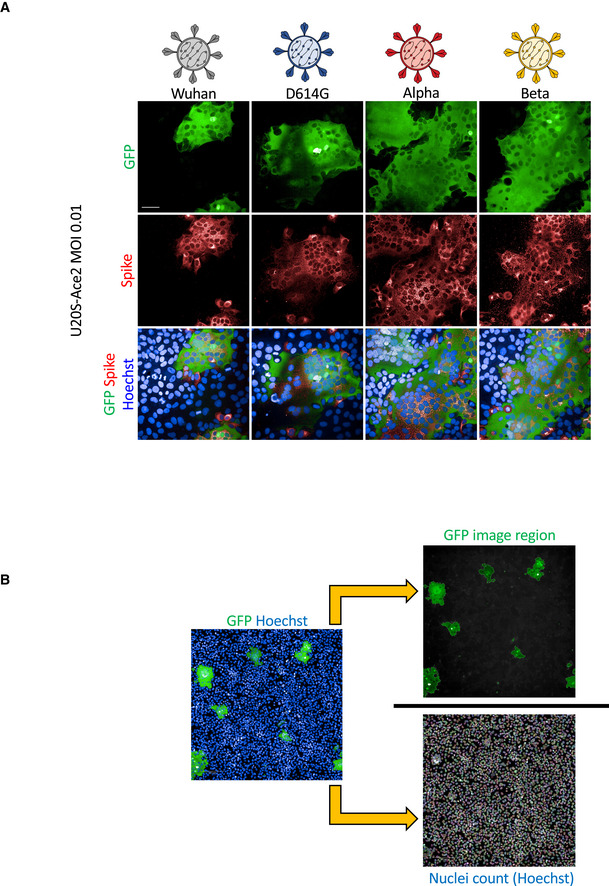
U2OS‐ACE2 GFP‐split cells were infected at MOI 0.01 with the Wuhan, D614G, Alpha, and Beta strains for 20 h. Cells were stained for S protein with the human pan‐SARS‐CoV‐2 102 mAb and Alex647 fluorescent secondary antibody. Representative confocal images of the variant induced syncytia formation: GFP‐Split (green), Spike (red), and Hoechst (blue). Scale bars: 50 µm.
Quantification method for syncytia formation using the Opera Phenix high content imager and harmony software: Total syncytia area (GFP area) is normalized for cell number upon quantifying the number of nuclei (Hoechst).
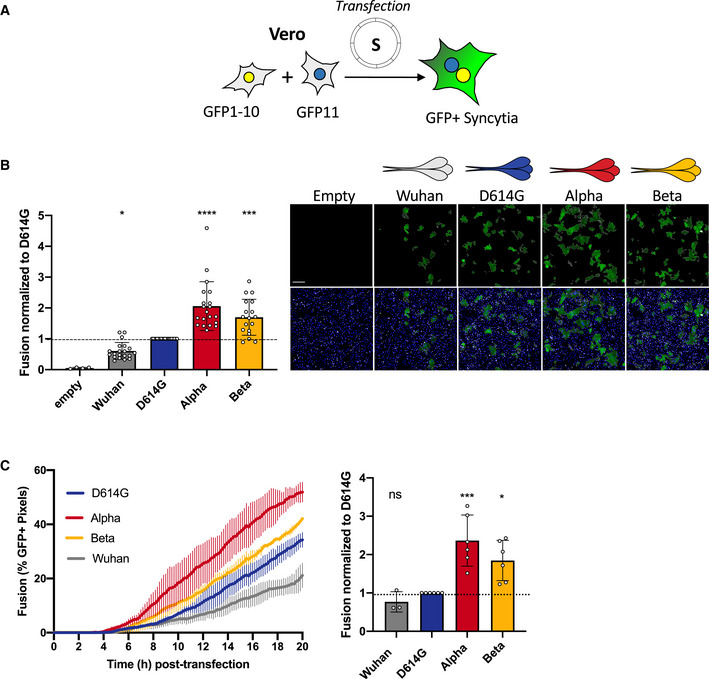
Vero GFP‐split cells were transfected with variant S proteins and imaged 18 h post‐transfection.
Left Panel: Fusion was quantified by GFP area/number of nuclei and normalized to D614G for each of the transfected variant S proteins. Right Panel: Representative images of Vero GFP‐split cells 18 h post‐transfection, GFP (green), and Hoechst (blue). Top and bottom are the same images with and without Hoechst channel. Scale bars: 200 µm.
Left Panel: Quantification of variant S protein‐mediated fusion in Vero GFP‐split cells by video microscopy. Results are mean ± SD from three fields per condition from one representative experiment. Right Panel: Fusion quantification of at least three independent video microscopy experiments, 20 h post‐transfection, normalized to D614G.
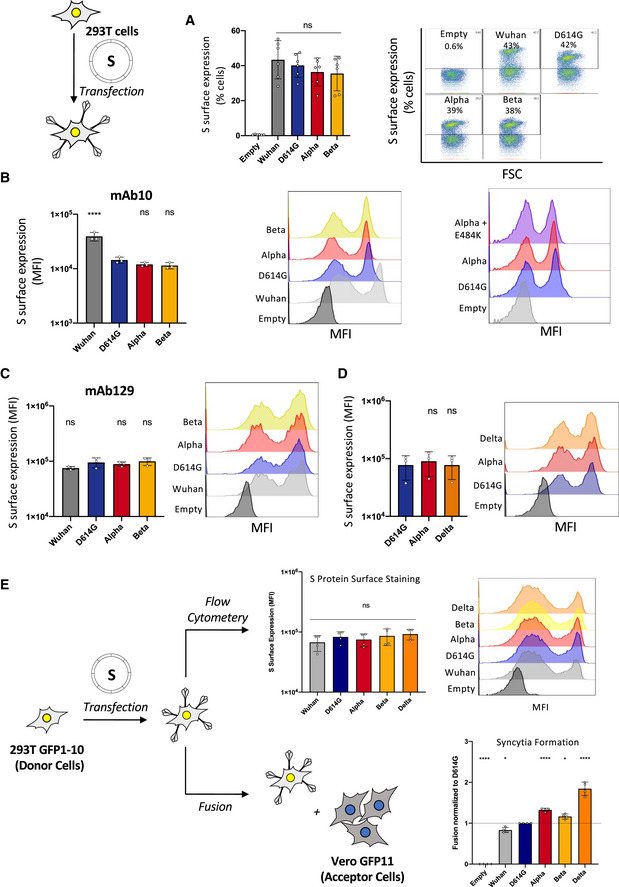
Left Panel: Quantification of percent of cells expressing each S protein at the surface. Right Panel: Representative FACs plots.
Quantification of median florescent intensity (MFI) of variant S protein at the cell surface and representative histograms of MFI of the Wuhan, D614G, Alpha, Beta, and Alpha + E484K variants S protein using mAb10.
Quantification of median florescent intensity (MFI) of variant S protein at the cell surface and representative histograms of MFI of the Wuhan, D614G, Alpha, Beta, and Alpha + E484K variants S protein using mAb129.
Quantification of median florescent intensity (MFI) of variant S protein at the cell surface and representative histograms of MFI of the Delta variant compared with the Alpha and D614G using mAb129.
Controlled acceptor/donor experiment 293T GFP1‐10 donor cells transfected with S protein and verified to have equal S protein expression on the surface (top), were then added to Vero GFP11 acceptor cells (bottom) to assess fusion.
- A
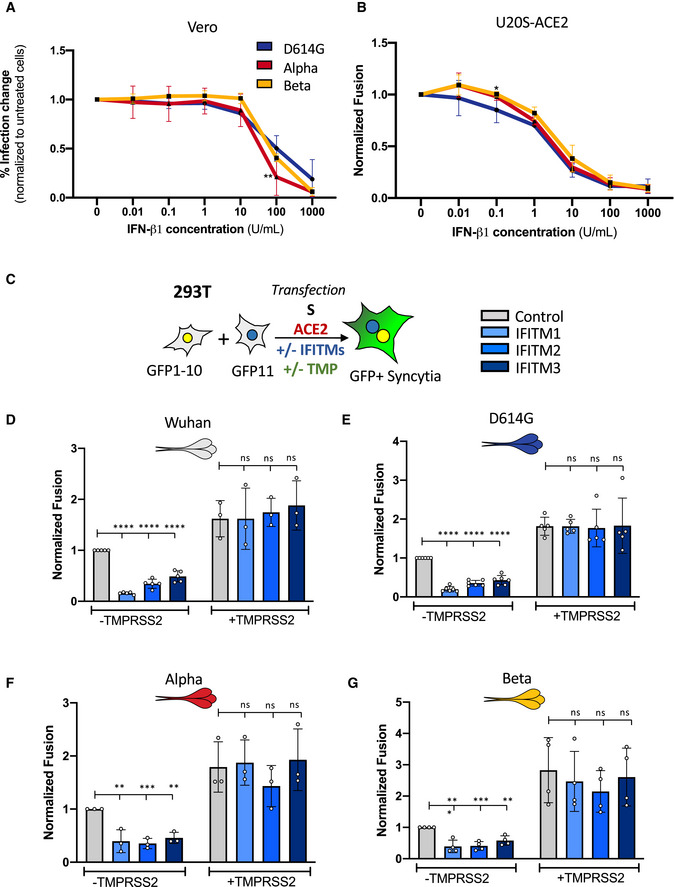
Vero cells were pre‐treated for 2 h with a serial dilution of IFN‐β1 prior to infection with the SARS‐CoV‐2 variants. Infected cells were maintained in media containing IFN‐β1 and analyzed by flow cytometry 48 h post‐infection to determine relative infection change.
- B
U20S‐ACE2 GFP‐split cells were pre‐treated for 2 h with a serial dilution of IFN‐β1 prior to infection with the SARS‐CoV‐2 variants. Infected cells were maintained in media containing IFN‐β1 and relative inhibition of syncytia formation 20 h post‐infection was determined via GFP signal.
- C–G
A co‐culture of 293T GFP‐Split cells were transfected with combination of S, control, ACE2, TMPRSS2, and IFITM plasmids and then imaged 18 h post‐transfection. Effect of IFITMs and TMPRSS2 on the cell–cell fusion induced by different S proteins, (D) Wuhan, (E) D614G, (F) Alpha, and (G) Beta.
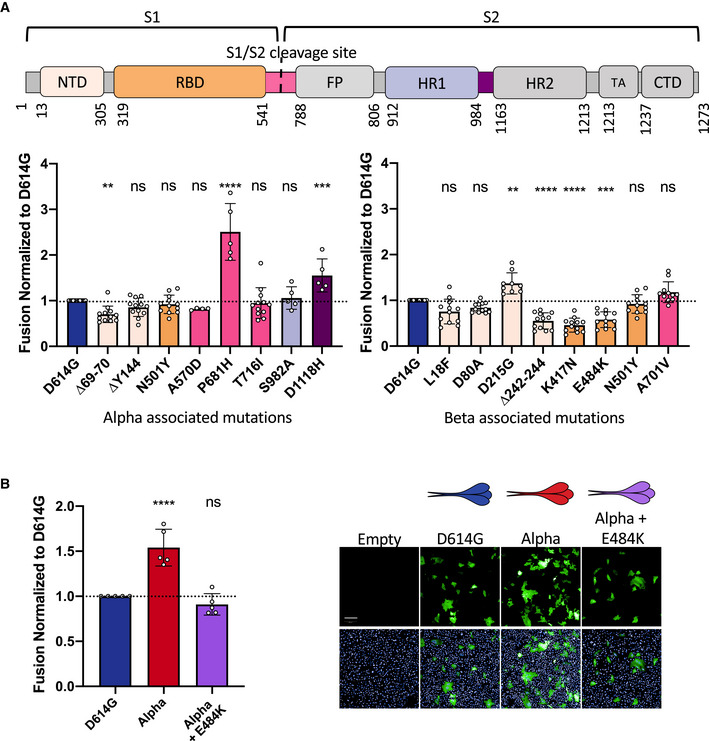
Top Panel: Schematic representation of the S protein color‐coded for the functional regions: N‐terminal domain (NTD), receptor‐binding domain (RBD), fusion peptide (FP), heptad repeat 1,2 (HR1, HR2), transmembrane anchor (TA), C‐terminal domain (CTD). Bottom left Panel: Vero GFP‐split cells were transfected with S plasmids containing each of the individual mutations associated with Alpha variant in the D614G background. The amount of fusion was quantified at 20 h and normalized to D614G reference plasmid. Bottom right Panel: Quantified fusion for each of the individual S protein mutations associated with the Beta variant. Color code of each mutation corresponds to S protein functional regions represented in the schematic on the Top Panel. Data set for N501Y and D614G reference mutations are duplicated between bottom left and bottom right panels for presentation as these mutations are common to both variants.
Left Panel: Quantified fusion of the Alpha + E484K variant S protein normalized to D614G S. Right Panel: Representative images of fusion at 20 h. Scale bar: 200 µm. Top and bottom are the same images with and without Hoechst channel.
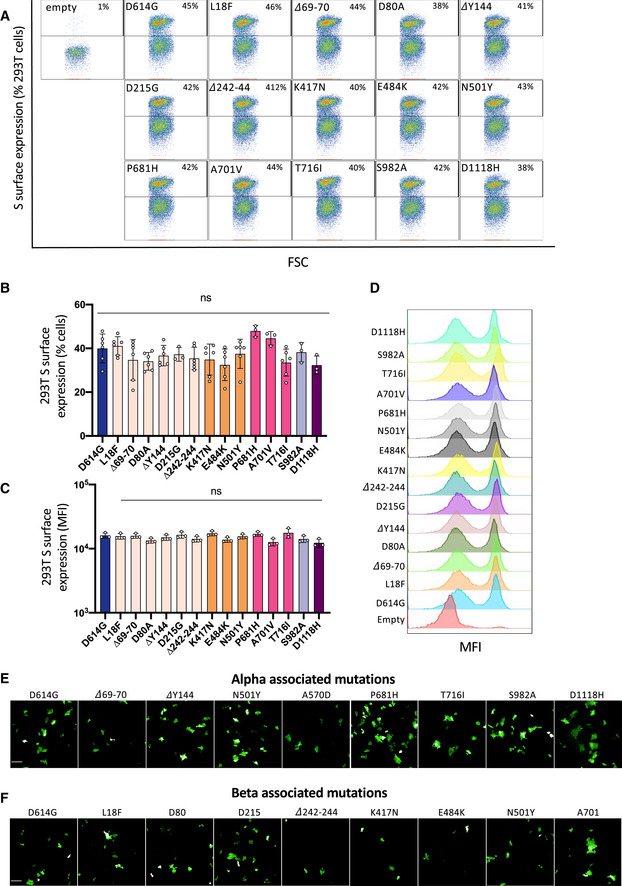
Representative FAC plots of percent of cells expressing each mutant S protein at the surface.
Quantification of percent of cells expressing each S protein at the surface.
Quantification of median florescent intensity (MFI) of the mutant S protein at the cell surface.
Representative histograms of MFI of each mutant S protein.
Representative images of Vero GFP‐split cells 20 h after transfection with each Alpha variant‐associated mutant S protein, GFP‐Split (Green). Scale bars: 200 µm.
Representative images of Vero GFP‐split cells 20 h after transfection with each Beta variant‐associated mutant S protein. Scale bars: 200 µm.
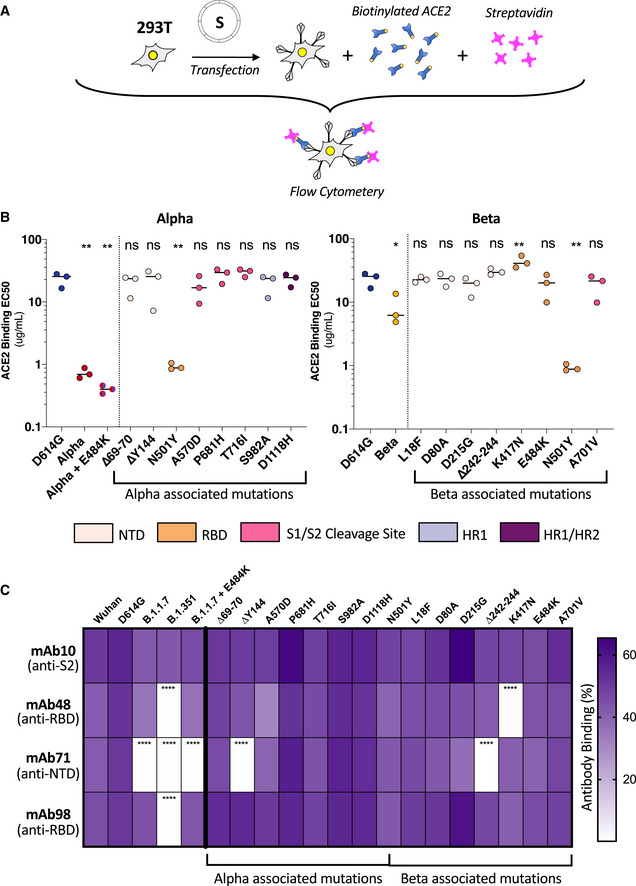
293T cells were transfected S proteins with each variant‐associated mutation for 24 h and stained with biotinylated ACE2 and fluorescent streptavidin before analysis by flow cytometry.
Left Panel: EC50 values (concentration of ACE2 needed for 50% binding) for Alpha and associated mutations. Color code corresponds to location on S protein functional domains and lower EC50 values signify higher affinity to ACE2 binding. Right Panel: EC50 values for Beta and associated mutations. Data set for N501Y and D614G reference mutations are duplicated between left and right panels as mutations are common to both variants.
S protein transfected 293T cells were stained with human monoclonal antibodies targeting the S2 (mAb10), RBD (mAb48 and mAb98), and the NTD (mAb71). Cells were analyzed by flow cytometry. The percentage of positive cells is indicated.
- A
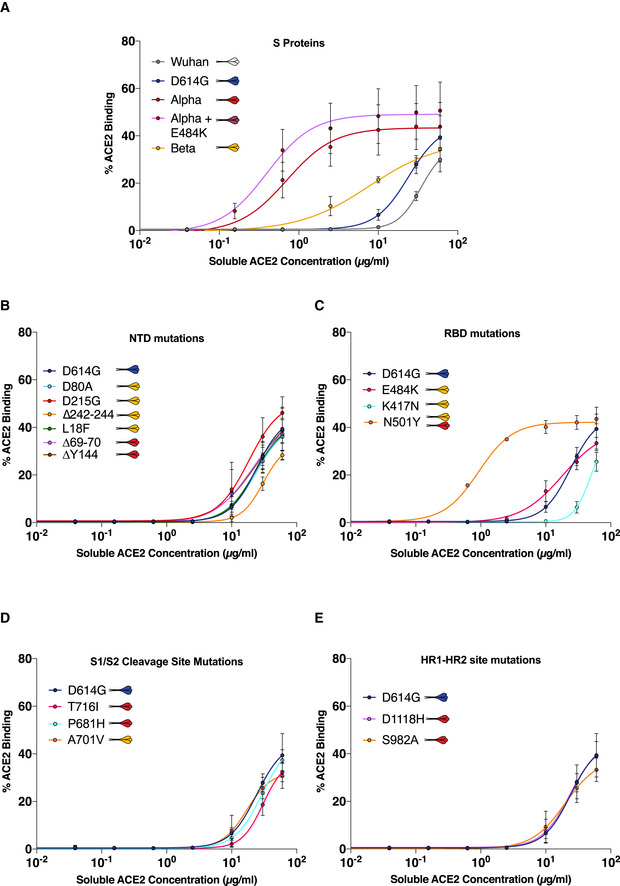
ACE2 binding dilution curves of each variant S protein.
- B–E
ACE2 binding dilution curves of each variant‐associated mutation located in (B) S protein n‐terminal domain (NTD), (C) receptor‐binding domain (RBD), (D) S1/S2 cleavage site, and (E) heptad repeat 1–2 site (HR1‐HR2).
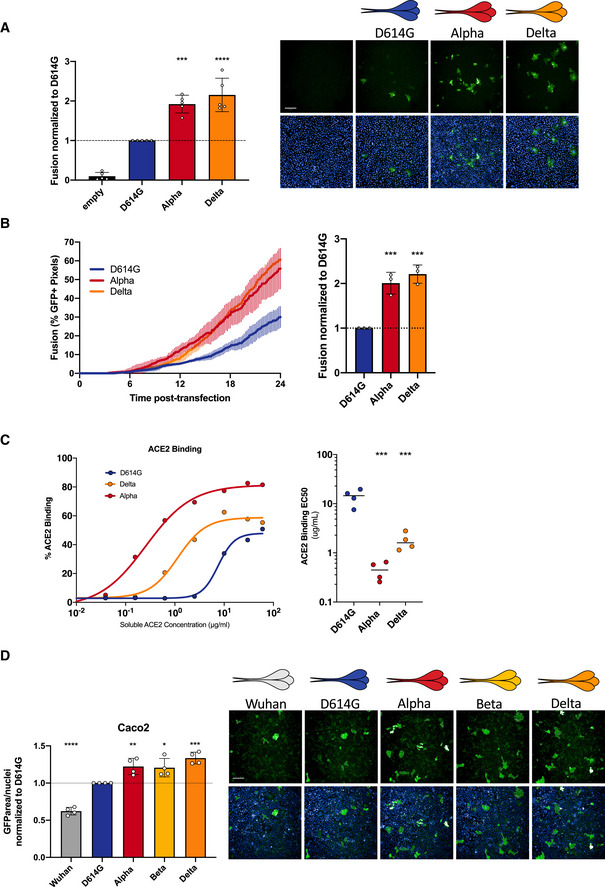
Vero GFP‐split cells were transfected with variant S proteins and imaged 18 h post‐transfection. Left Panel: Fusion was quantified by GFP area/number of nuclei and normalized to D614G for each of the transfected variant S proteins. Right Panel: Representative images of Vero GFP‐split cells 18 h post‐transfection, GFP (green), and Hoechst (blue). Top and bottom are the same images with and without Hoechst channel. Scale bars: 200 µm.
Left Panel: Quantification of Delta S protein‐mediated fusion in Vero GFP‐split cells by video microscopy. Results are mean ± SD from three fields per condition from one representative experiment. Right Panel: Fusion quantification of three independent video microscopy experiments, 20 h post‐transfection, normalized to D614G.
293T cells were transfected S proteins with each variant‐associated mutation for 24 h and stained with biotinylated ACE2 and fluorescent streptavidin before analysis by flow cytometry. Left Panel: Representative ACE2 binding dilution curves for the Delta variant in relation to Alpha and D614G. Right Panel: EC50 values (concentration of ACE2 needed for 50% binding) for Alpha for the Delta variant.
Caco2 GFP‐split cells were transfected with variant S proteins and imaged 18 h post‐transfection. Left Panel: Fusion was quantified by GFP area/ number of nuclei and normalized to D614G for each of the transfected variant S proteins. Right Panel: Representative images of Caco2 GFP‐split cells 18 h post‐transfection, GFP (green), and Hoechst (blue). Top and bottom are the same images with and without Hoechst channel. Scale bars: 200 µm.
References
Publication types
MeSH terms
Substances
Supplementary concepts
Grants and funding
- Agence Nationale de Recherches sur le Sida et les Hépatites Virales (ANRS)
- ANR-10-LABX-77/The Vaccine Research Institute
- ANR-10-LABX62-IBEID/Labex IBEID
- ANR/FRM Flash Covid PROTEO-SARS-CoV-2
- IDISCOVR
- Region Ile-de-France program DIM1-Health
- Pasteur-Paris University (PPU) International Doctoral Program
- French Ministry of Higher Education, Research and Innovation
- Medecine-Sciences ENS-PSL Program
- ANR-10-LABX-69- 01/Milieu Intérieur Program
- REACTing
- EU (RECOVER)
- The Vaccine Research Institute
- Institut Pasteur Department of Virology "Bourse de Soudure" fellowship
- ANR CoronaMito AAP RA-COVID-19 V14
- Institut Pasteur
- Urgence COVID-19 Fundraising Campaign of Institut Pasteur
- Fondation Pour la Recherche Médicale (FRM)
- ANR-10-INSB-04-01/UPBI
- INSERM
- 00106077/Fondation de France
LinkOut - more resources
Full Text Sources
Miscellaneous
