. 2021 Oct 3;9(1):198.
doi: 10.1186/s40168-021-01128-4.

Distinct B cell subsets in Peyer's patches convey probiotic effects by Limosilactobacillus reuteri

Affiliations

Distinct B cell subsets in Peyer's patches convey probiotic effects by Limosilactobacillus reuteri

Hao-Yu Liu et al. Microbiome. .

Abstract

Background: Intestinal Peyer's patches (PPs) form unique niches for bacteria-immune cell interactions that direct host immunity and shape the microbiome. Here we investigate how peroral administration of probiotic bacterium Limosilactobacillus reuteri R2LC affects B lymphocytes and IgA induction in the PPs, as well as the downstream consequences on intestinal microbiota and susceptibility to inflammation.

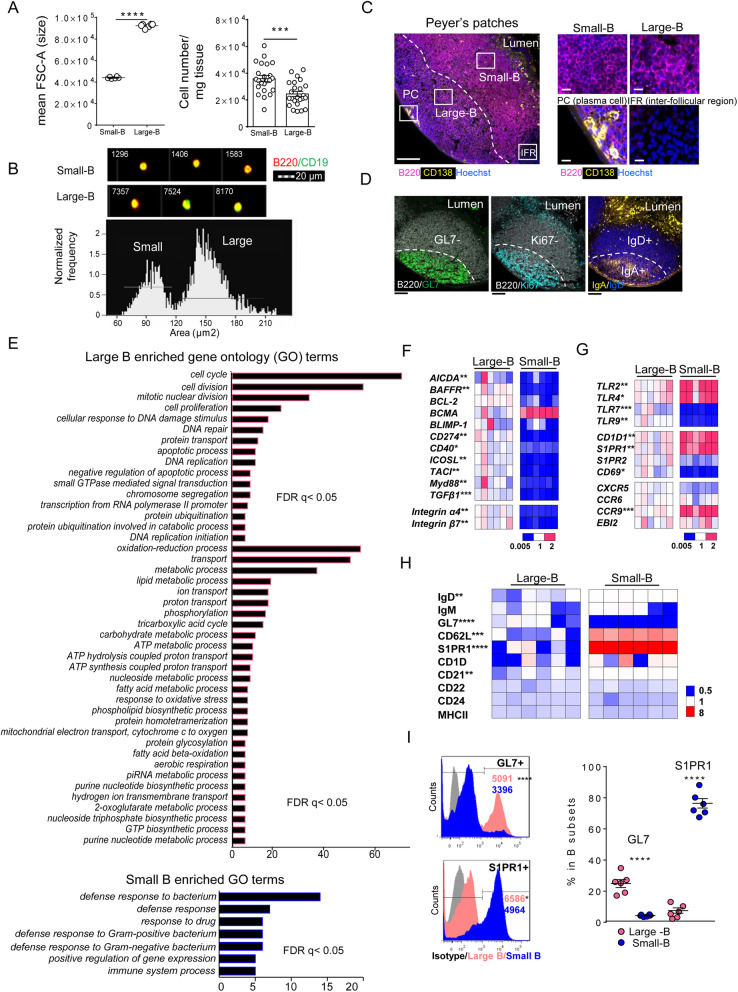
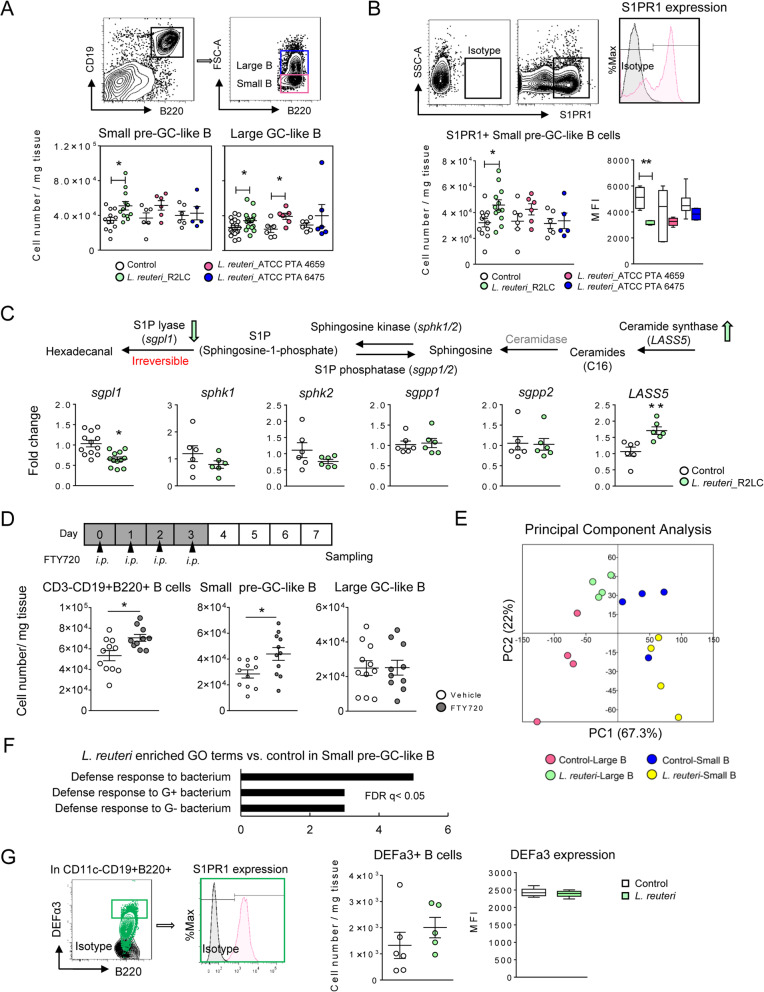
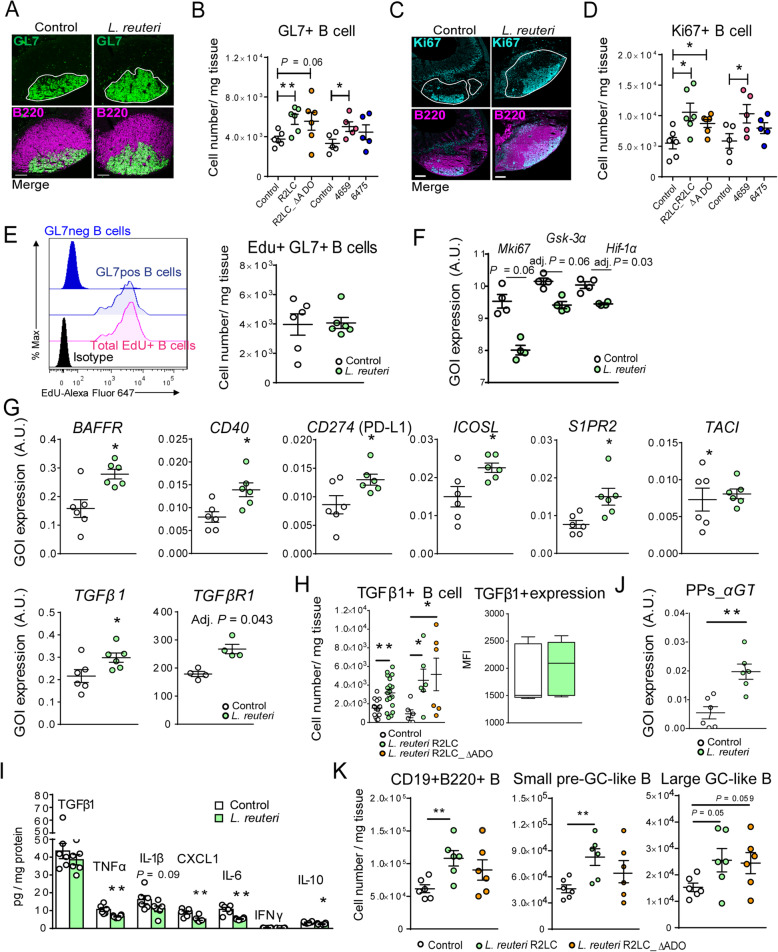
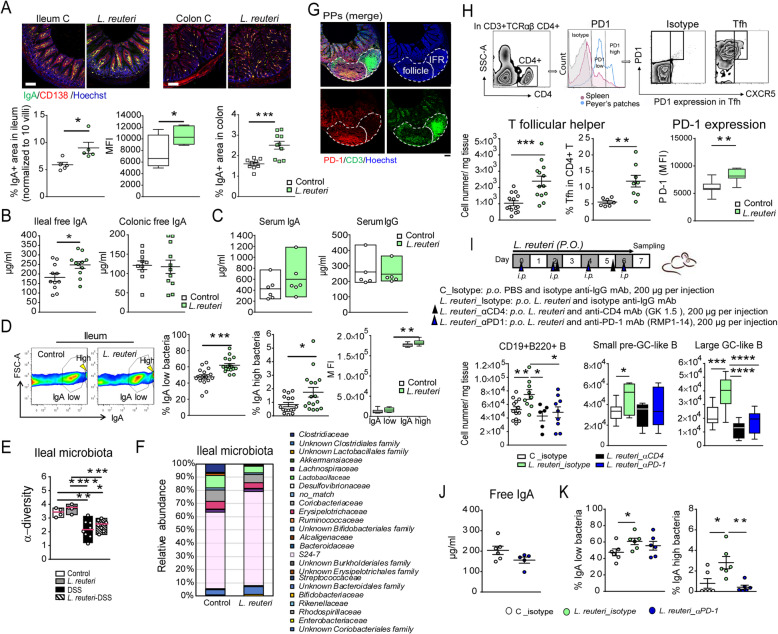
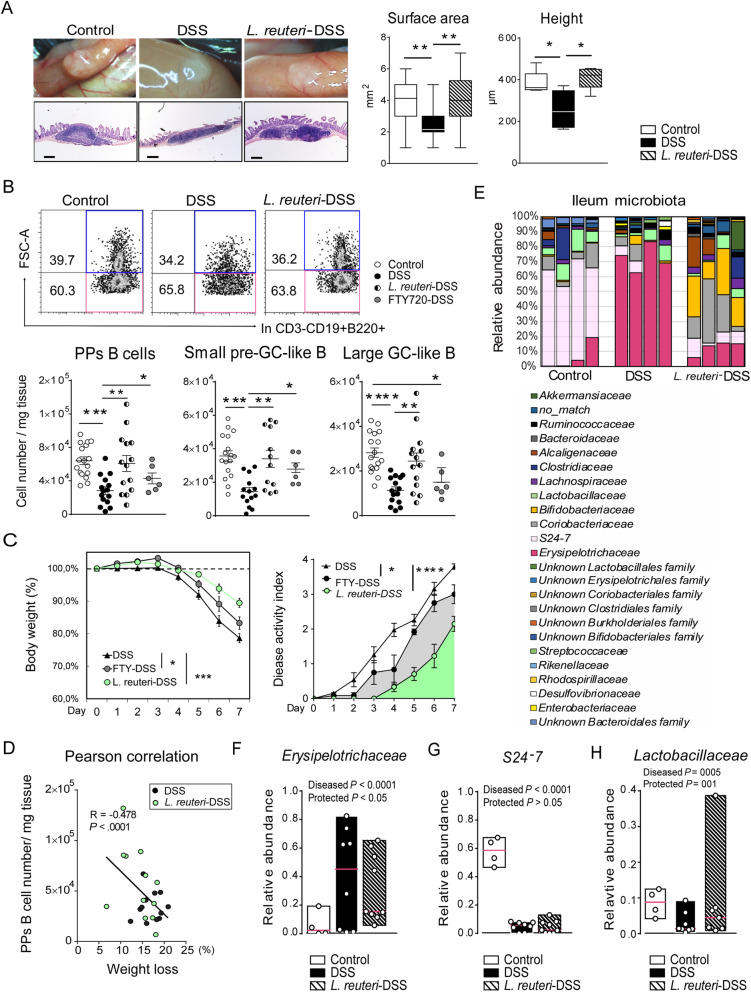
Results: The B cells of PPs were separated by size to circumvent activation-dependent cell identification biases due to dynamic expression of markers, which resulted in two phenotypically, transcriptionally, and spatially distinct subsets: small IgD+/GL7-/S1PR1+/Bcl6, CCR6-expressing pre-germinal center (GC)-like B cells with innate-like functions located subepithelially, and large GL7+/S1PR1-/Ki67+/Bcl6, CD69-expressing B cells with strong metabolic activity found in the GC. Peroral L. reuteri administration expanded both B cell subsets and enhanced the innate-like properties of pre-GC-like B cells while retaining them in the sub-epithelial compartment by increased sphingosine-1-phosphate/S1PR1 signaling. Furthermore, L. reuteri promoted GC-like B cell differentiation, which involved expansion of the GC area and autocrine TGFβ-1 activation. Consequently, PD-1-T follicular helper cell-dependent IgA induction and production was increased by L. reuteri, which shifted the intestinal microbiome and protected against dextran-sulfate-sodium induced colitis and dysbiosis.

Conclusions: The Peyer's patches sense, enhance and transmit probiotic signals by increasing the numbers and effector functions of distinct B cell subsets, resulting in increased IgA production, altered intestinal microbiota, and protection against inflammation. Video abstract.

Keywords: Gut microbiome; Inflammatory bowel disease; Innate-like B lymphocytes; PD-1 dependent; Probiotics; R2LC.


Conflict of interest statement

The authors report no potential conflict of interest.

Figures

Fig. 1
Fig. 1
Phenotypic and transcriptional distinction between B cell subsets in Peyer’s patches. a Flow cytometry of PPs live CD3-CD19+B220+ B lymphocytes (gated as shown in Fig. S1A) and separated into the small and large B cell subsets by forward scatter area and expressed as mean FSC-A (size), and the number of small-B and large-B cells per mg tissue (n = 6 mice left panel; n = 24 mice right panel). b Imaging flow cytometry of the areas (μm2) of small-B and large-B cell from three independent experiments. c, d Immunohistochemistry of PPs stained with anti-B220 (magenta), anti-CD138 (yellow) and Hoechst (blue) in c or anti-B220 (white), anti-GL7 (green), anti-Ki67 (cyan), anti-IgA (yellow), and anti-IgD (blue) in d. Scale Bars equal 100 μm or 10 μm in closed-up reviews. e Enrichment of gene ontology categories (Biological Process, BP) for genes differentially expressed in large B (upper panel) versus small B cells (lower panel) determined by microarray of lin-CD19+B220+ cells sorted on FSC-A (n = 4 samples per group), the number of genes in each functional category is shown. Data were adjusted by false discovery rate control (FDR). f, g Displays of heat maps of genes expression by q-RT-PCR in sorted small and large B cells. The expression was normalized to the mean value of large B and each column represents one sample. h, i Heat maps and histograms depicting expression of surface markers on small and large B cells (n = 6 mice per group). The frequency of indicated markers (normalized to the mean value of large B cells). i MFI of B cells positive for GL7 and S1PR1, and percentage in each subset. Data are presented as mean ± SEM. *p < 0.05, **p < 0.01, ***p < 0.001, ****p < 0.0001 using two-tailed Student’s t test
Fig. 2
Fig. 2
L. reuteri increases the population of Peyer’s patches B cells and enhances their effector functions. a Flow cytometry of small-pre-GC-like and large-GC-like B cell subsets from control mice or mice treated with 108 cfu L. reuteri (R2LC, 4659 or 6475) perorally for 7 consecutive days (n = 5–12 mice per group). b Numbers of S1PR1+ small pre-GC-like B cells (CD3-CD19+B220+) and their S1PR1 expression (MFI, n = 5–12 mice per group). c Illustration of enzymes regulating sphingosine-1-phosphate (S1P) homeostasis (top). q-RT-PCR analysis of gene expression (fold change, n = 6 mice per group) of the S1P pathway (bottom). d Experimental design evaluating the effect of the sphingosine-1-phosphate (S1P) receptor modulator FTY720 (top), and flow cytometry of B cell subsets (lower panels, n = 10–11 mice per group). e Principal component analysis of the microarray data, where each dot represents one sample (n = 4 samples per group). f Enrichment of gene ontology categories (BP) for genes upregulated by L. reuteri in small B cells. g Flow cytometry of DEFa3+ B cells (CD11C-CD19+B220+) in PPs and DEFa3 expression (MFI, n = 5–6 mice per group). Data are presented as mean ± SEM. *p < 0.05, **p < 0.01 using two-tailed Student’s t test
Fig. 3
Fig. 3
L. reuteri expands the GC-like B cell population and reprograms its functional gene signature. a, c Immunohistochemistry of the GL7+ area stained with anti-B220 (magenta), anti-GL7 (green) and anti-Ki67 (cyan). Scale bars equal 100 μm. Representative images of PPs from the control or L. reuteri-treatment are shown in a and c, and the corresponding quantification shown in Fig. S3G, H. b, d Flow cytometry quantification of GL7+ B cells (in CD3CD19+B220+, n = 5–6 mice per group) and Ki67+ cells (n = 5–6 mice per group). e In vivo proliferation assay was performed by flow cytometry following i.p. injection of EdU. A histogram depicting EdU expression in GL7, GL7+ or EdU+CD19+B220+B cells and the number of EdU+GL7+ B cells (n = 6 mice per group). f Expression of Mki67, Gsk-3α, and Hif-1α in large GC-like B cells from control or L. reuteri-treated mice (GOI, gene of interest; A.U., arbitrary unit). g q-RT-PCR analysis of gene expression levels (n = 6 mice per group) and expression of TGFβR1 (microarray analysis). h Flow cytometry analyzing the numbers of TGFβ1+ B cells as well as the TGFβ1 levels (MFI, n = 6–18 mice per group). i The PPs tissue was analyzed for cytokine/chemokine production by Multi-Plex Mesoscale and ELISA, normalized to tissue protein content (n = 6 mice per group). j Expression of α germline transcripts (αGT) in PPs (n = 6 mice per group). k The numbers of B cells of different subsets in PPs in untreated mice and in response to L. reuteri R2LC and L. reuteri R2LC_ΔADO (n = 6 mice per group). Data are presented as mean ± SEM. *p < 0.05, **p < 0.01 using Student’s t test or ANOVA with Tukey’s post hoc test
Fig. 4
Fig. 4
L. reuteri promotes B cell IgA-responses in a Tfh-PD-1-dependent manner. a The area of IgA+ plasma cells (anti-CD138) quantified in ileal and colonic tissues, n = 5 mice per group (duplicate slides per mouse, scale bars equal 100 μm). b Free IgA (μg/ml, ELISA) in the lumen of ileum and colon (n = 10–11 mice per group) and c Serum IgA and IgG concentrations (μg/ml, ELISA, n = 5-6 mice per group). d Flow cytometry of IgA+ bacteria in ileum (n = 16-17 mice per group). e, f Ileal microbiome assessed by 16S rRNA gene amplicon sequencing. Microbial community diversity was calculated as α-diversity in mice treated with L. reuteri and/or DSS compared to controls, n = 4–9 mice per group. Data are presented as median values. g Localization of PD-1+ T cells in PPs stained with anti-PD-1 (red), anti-CD3 (green), and Hoechst (blue, scale bar equals 100 μm) from three independent experiments. h Flow cytometry of Tfh cells and PD-1 expression (n = 13-14 mice per group). A histogram of PPs and spleen indicating a uniquely high expression of PD-1 in PPs T cells. i Design of PD-1 monoclonal antibodies blocking (blue arrows) and CD4+ T cell depletion (black arrows) experiments and effects on the number of B cell subsets (n = 6–13 mice per group). j, k Free IgA production and quantification of IgA+ bacteria in the ileum from PD-1 (mAb) blocking experiments (n = 6 mice per group). Data are presented as mean ± SEM. *p < 0.05, **p < 0.01, ***p < 0.001, ****p < 0.0001 using two-tailed Student’s t test or ANOVA with Tukey’s post hoc test
Fig. 5
Fig. 5
L. reuteri provides protection against DSS-induced colitis, disruption of Peyer’s patches and intestinal dysbiosis. a Macroscopic analysis of the PPs surface area (mean area of PPs per mouse, mm2, n = 5 mice per group) in WT mice (control), WT mice receiving DSS (DSS, 3% in drinking water for 7 consecutive days) as well as mice receiving L. reuteri R2LC was given daily to WT mice for 14 days starting 7 days prior to DSS-treatment (L. reuteri-DSS). Histological analysis of the PPs height (μm, serially sectioned with all slides per PP analyzed, n = 5 mice per group, scale bars equal 200 μm). b Flow cytometry of live CD3-CD19+B220+ B cells, small-pre-GC-like and large-GC-like B cells in PPs (n = 6–17 mice per group). c Body weight change and disease activity index of DSS-treated mice and mice co-treated with L. reuteri (n = 9 mice per group) or FTY720 (n = 6 mice per group). d Pearson correlation of PPs B cell number and body weight loss (%) (n = 24 mice). e Bar graph depicts bacterial community composition of individual mouse, n = 4 mice per group. fh Relative abundance of Erysipelotrichaceae, S24-7 and Lactobacillaceae in the ileal microbiota (n = 4–9 mice per group). Data are presented as median values. Contrast analysis demonstrated that bacterial taxa changed significantly with DSS-treatment (diseased P < 0.05) and was preserved by L. reuteri-treatment (protected P < 0.05). Data are presented as mean ± SEM. *p < 0.05, **p < 0.01, ***p < 0.001, ****p < 0.0001 using ANOVA with Tukey’s post hoc test

References

    1. Gopalakrishnan V, Helmink BA, Spencer CN, Reuben A, Wargo JA. The influence of the gut microbiome on cancer, immunity, and cancer immunotherapy. Cancer Cell. 2018;33(4):570–580. doi: 10.1016/j.ccell.2018.03.015. - DOI - PMC - PubMed
    1. Schnupf P, Gaboriau-Routhiau V, Cerf-Bensussan N. Modulation of the gut microbiota to improve innate resistance. Curr Opin Immunol. 2018;54:137–144. doi: 10.1016/j.coi.2018.08.003. - DOI - PubMed
    1. Wang T, Zheng N, Luo Q, Jiang L, He B, Yuan X, Shen L. Probiotics Lactobacillus reuteri abrogates immune checkpoint blockade-associated colitis by inhibiting group 3 innate lymphoid cells. Front Immunol. 2019;10:1235. doi: 10.3389/fimmu.2019.01235. - DOI - PMC - PubMed
    1. Cervantes-Barragan L, Chai JN, Tianero MD, Luccia BD, Ahern PP, Merriman J, Cortez VS, Caparon MG, Donia MS, Gilfillan S, et al. Lactobacillus reuteri induces gut intraepithelial CD4+CD8αα+ T cells. Science. 2017;357(6353):806–810. doi: 10.1126/science.aah5825. - DOI - PMC - PubMed
    1. Zheng J, Wittouck S, Salvetti E, Franz CMAP, Harris HMB, Mattarelli P, O’Toole PW, Pot B, Vandamme P, Walter J, Watanabe K, Wuyts S, Felis GE, Gänzle MG, Lebeer S. A taxonomic note on the genus Lactobacillus: description of 23 novel genera, emended description of the genus Lactobacillus Beijerinck 1901, and union of Lactobacillaceae and Leuconostocaceae. Int J Syst Evol Microbiol. 2020;70(4):2782–2858. doi: 10.1099/ijsem.0.004107. - DOI - PubMed

Publication types