

Internal migration networks and mortality in home communities: Evidence from Italy during the Covid-19 pandemic
- PMID: 34602647
- PMCID: PMC8475185
- DOI: 10.1016/j.euroecorev.2021.103890
Internal migration networks and mortality in home communities: Evidence from Italy during the Covid-19 pandemic
Abstract
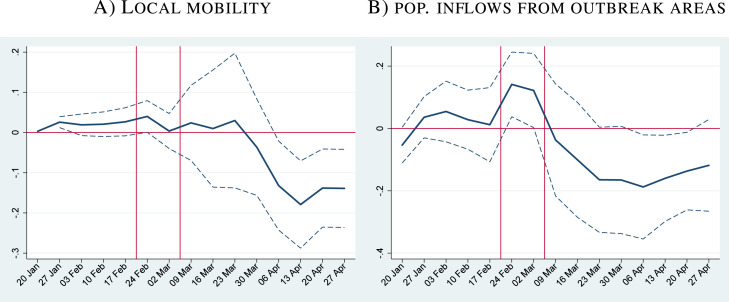
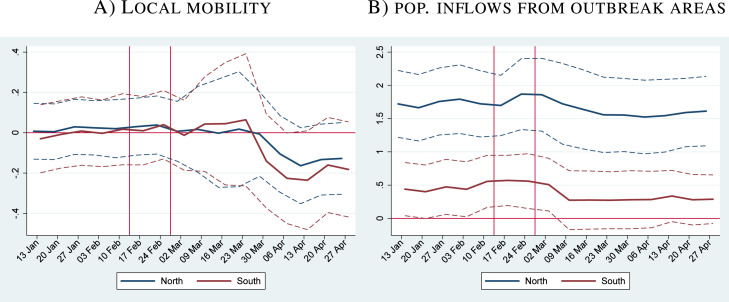
Do internal migration networks benefit or harm their home communities in case of a communicable disease? Looking at the spread of Covid in Italy and using pre-determined province-to-province migration, excess mortality and mobile phone tracking data, we document that provinces with a greater share of migrants in outbreak areas show greater compliance with self-isolation measures (information mechanism), but also a greater population inflow from outbreak areas (carrier mechanism). For a subset of localities, the net effect on mortality is negative. However, for the average locality, the effect is positive and large, suggesting that the role of migrants as information providers is trumped by their role as virus carriers. The effect is quantitatively important and could be incorporated in epidemiological models forecasting the spread of communicable diseases.
Keywords: Contagion; Covid-19; Health; Information; Internal migration networks; Mobility; Virus.
© 2021 Elsevier B.V. All rights reserved.
Figures
References
-
- Adda Jerome. Economic activity and the spread of viral diseases: Evidence from high frequency data. Q. J. Econ. 2016;131(2):891–941.
-
- Bailey Michael, Cao Rachel, Kuchler Theresa, Stroebel Johannes, Wong Arlene. Social connectedness: Measurement, determinants, and effects. J. Econ. Perspect. 2018;32(3):259–280. - PubMed
-
- Bailey Michael, Cao Rachel, Kuchler Theresa, Stroebel Johannes, Wong Arlene. 2020. Social networks shape beliefs and behavior: evidence from social distancing during the covid-19 pandemic.
-
- Barmby Tim, Larguem Makram. Coughs and sneezes spread diseases: An empirical study of absenteeism and infectious illness. J. Health Econ. 2009;28(5):1012–1017. - PubMed
-
- Barro, Robert J., Ursúa, José F., Weng, Joanna, 2020. The Coronavirus and the Great Influenza Pandemic: Lessons from the Spanish Flu for the Coronavirus’s Potential Effects on Mortality and Economic Activity. National Bureau of Economic Research Working Paper Series No. 26866.
LinkOut - more resources
Full Text Sources
