

Adaptive Parameter Modulation of Deep Brain Stimulation Based on Improved Supervisory Algorithm
- PMID: 34602976
- PMCID: PMC8481598
- DOI: 10.3389/fnins.2021.750806
Adaptive Parameter Modulation of Deep Brain Stimulation Based on Improved Supervisory Algorithm
Abstract
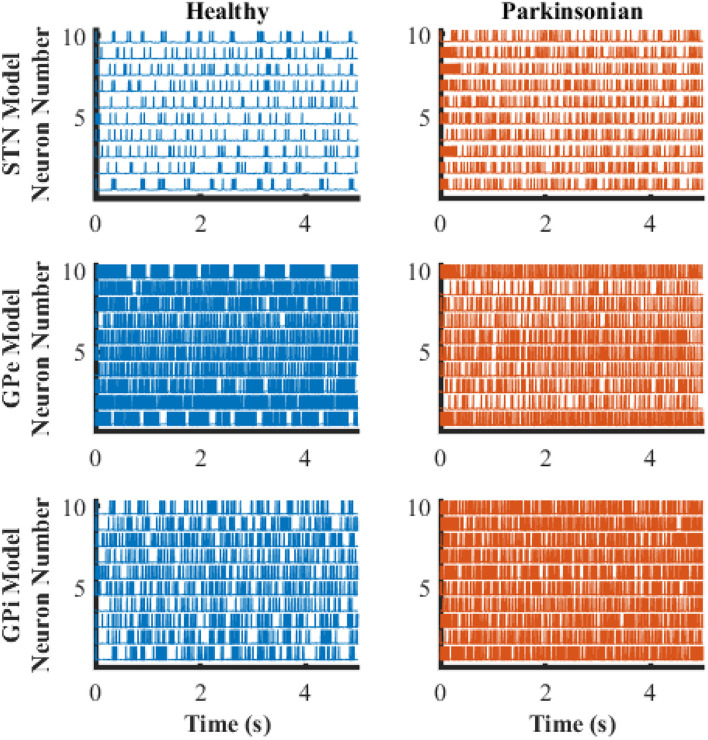
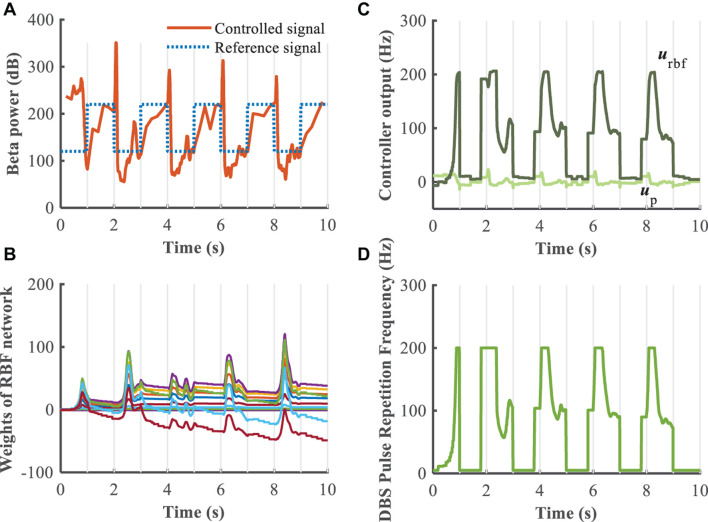
Clinically deployed deep brain stimulation (DBS) for the treatment of Parkinson's disease operates in an open loop with fixed stimulation parameters, and this may result in high energy consumption and suboptimal therapy. The objective of this manuscript is to establish, through simulation in a computational model, a closed-loop control system that can automatically adjust the stimulation parameters to recover normal activity in model neurons. Exaggerated beta band activity is recognized as a hallmark of Parkinson's disease and beta band activity in model neurons of the globus pallidus internus (GPi) was used as the feedback signal to control DBS of the GPi. Traditional proportional controller and proportional-integral controller were not effective in eliminating the error between the target level of beta power and the beta power under Parkinsonian conditions. To overcome the difficulties in tuning the controller parameters and improve tracking performance in the case of changes in the plant, a supervisory control algorithm was implemented by introducing a Radial Basis Function (RBF) network to build the inverse model of the plant. Simulation results show the successful tracking of target beta power in the presence of changes in Parkinsonian state as well as during dynamic changes in the target level of beta power. Our computational study suggests the feasibility of the RBF network-driven supervisory control algorithm for real-time modulation of DBS parameters for the treatment of Parkinson's disease.
Keywords: Parkinson’s disease; RBF neural network; beta power; feedback signal; supervisory control algorithm.
Copyright © 2021 Zhu, Wang, Li, Liu and Grill.
Conflict of interest statement
The authors declare that the research was conducted in the absence of any commercial or financial relationships that could be construed as a potential conflict of interest.
Figures


Similar articles
-
Model-Based Evaluation of Closed-Loop Deep Brain Stimulation Controller to Adapt to Dynamic Changes in Reference Signal.Front Neurosci. 2019 Sep 10;13:956. doi: 10.3389/fnins.2019.00956. eCollection 2019. Front Neurosci. 2019. PMID: 31551704 Free PMC article.
-
Simulation of Closed-Loop Deep Brain Stimulation Control Schemes for Suppression of Pathological Beta Oscillations in Parkinson's Disease.Front Neurosci. 2020 Mar 5;14:166. doi: 10.3389/fnins.2020.00166. eCollection 2020. Front Neurosci. 2020. PMID: 32194372 Free PMC article.
-
Self-Tuning Deep Brain Stimulation Controller for Suppression of Beta Oscillations: Analytical Derivation and Numerical Validation.Front Neurosci. 2020 Jun 30;14:639. doi: 10.3389/fnins.2020.00639. eCollection 2020. Front Neurosci. 2020. PMID: 32694975 Free PMC article.
-
Congress of Neurological Surgeons Systematic Review and Evidence-Based Guideline on Subthalamic Nucleus and Globus Pallidus Internus Deep Brain Stimulation for the Treatment of Patients With Parkinson's Disease: Executive Summary.Neurosurgery. 2018 Jun 1;82(6):753-756. doi: 10.1093/neuros/nyy037. Neurosurgery. 2018. PMID: 29538685 Free PMC article.
-
An update on adaptive deep brain stimulation in Parkinson's disease.Mov Disord. 2018 Dec;33(12):1834-1843. doi: 10.1002/mds.115. Epub 2018 Oct 24. Mov Disord. 2018. PMID: 30357911 Free PMC article. Review.
Cited by
-
Predictive neuromodulation of cingulo-frontal neural dynamics in major depressive disorder using a brain-computer interface system: A simulation study.Front Comput Neurosci. 2023 Mar 6;17:1119685. doi: 10.3389/fncom.2023.1119685. eCollection 2023. Front Comput Neurosci. 2023. PMID: 36950505 Free PMC article.
-
Toward noninvasive brain stimulation 2.0 in Alzheimer's disease.Ageing Res Rev. 2022 Mar;75:101555. doi: 10.1016/j.arr.2021.101555. Epub 2021 Dec 30. Ageing Res Rev. 2022. PMID: 34973457 Free PMC article. Review.
-
Suppression of seizure in childhood absence epilepsy using robust control of deep brain stimulation: a simulation study.Sci Rep. 2023 Jan 10;13(1):461. doi: 10.1038/s41598-023-27527-1. Sci Rep. 2023. PMID: 36627375 Free PMC article.
-
Forgotten Tides: A Novel Strategy for Bayesian Optimization of Neurostimulation.Epilepsy Curr. 2024 May 30;24(4):283-285. doi: 10.1177/15357597241254274. eCollection 2024 Jul-Aug. Epilepsy Curr. 2024. PMID: 39309050 Free PMC article. No abstract available.
-
Closing the loop in DBS: A data-driven approach.Parkinsonism Relat Disord. 2025 May;134:107348. doi: 10.1016/j.parkreldis.2025.107348. Epub 2025 Feb 21. Parkinsonism Relat Disord. 2025. PMID: 40037940 Review.
References
Grants and funding
LinkOut - more resources
Full Text Sources