. 2021 Sep 16:15:735300.
doi: 10.3389/fncel.2021.735300. eCollection 2021.

Glial Chloride Homeostasis Under Transient Ischemic Stress

Affiliations

Glial Chloride Homeostasis Under Transient Ischemic Stress

Miriam Engels et al. Front Cell Neurosci. .

Abstract

High water permeabilities permit rapid adjustments of glial volume upon changes in external and internal osmolarity, and pathologically altered intracellular chloride concentrations ([Cl-]int) and glial cell swelling are often assumed to represent early events in ischemia, infections, or traumatic brain injury. Experimental data for glial [Cl-]int are lacking for most brain regions, under normal as well as under pathological conditions. We measured [Cl-]int in hippocampal and neocortical astrocytes and in hippocampal radial glia-like (RGL) cells in acute murine brain slices using fluorescence lifetime imaging microscopy with the chloride-sensitive dye MQAE at room temperature. We observed substantial heterogeneity in baseline [Cl-]int, ranging from 14.0 ± 2.0 mM in neocortical astrocytes to 28.4 ± 3.0 mM in dentate gyrus astrocytes. Chloride accumulation by the Na+-K+-2Cl- cotransporter (NKCC1) and chloride outward transport (efflux) through K+-Cl- cotransporters (KCC1 and KCC3) or excitatory amino acid transporter (EAAT) anion channels control [Cl-]int to variable extent in distinct brain regions. In hippocampal astrocytes, blocking NKCC1 decreased [Cl-]int, whereas KCC or EAAT anion channel inhibition had little effect. In contrast, neocortical astrocytic or RGL [Cl-]int was very sensitive to block of chloride outward transport, but not to NKCC1 inhibition. Mathematical modeling demonstrated that higher numbers of NKCC1 and KCC transporters can account for lower [Cl-]int in neocortical than in hippocampal astrocytes. Energy depletion mimicking ischemia for up to 10 min did not result in pronounced changes in [Cl-]int in any of the tested glial cell types. However, [Cl-]int changes occurred under ischemic conditions after blocking selected anion transporters. We conclude that stimulated chloride accumulation and chloride efflux compensate for each other and prevent glial swelling under transient energy deprivation.

Keywords: K-Cl cotransporters; Na-K-2Cl cotransporter; chemical stress mimicking ischemia; excitatory amino acid transporters; fluorescence lifetime imaging microscopy; intracellular chloride concentrations.


Conflict of interest statement

The authors declare that the research was conducted in the absence of any commercial or financial relationships that could be construed as a potential conflict of interest.

Figures

FIGURE 1
FIGURE 1
Minimum photon numbers for the determination of fluorescence lifetime by fitting fluorescence decays. (A) Fluorescence lifetime images in a droplet of 3 mM MQAE dissolved in a solution containing 15 mM NaCl. The three images were calculated from the same data set using different bin factors to generate single-pixel fluorescence intensity decays (FIDs) with varying photon numbers. (B) Fluorescence lifetimes of 3 mM MQAE (15 mM NaCl normalized to the limiting value of 4.95 ns; 40 mM NaCl normalized to the limiting value of 2.2 ns; 100 mM NaCl normalized to the limiting value of 1.15 ns) plotted as a function of photon numbers per FID. Photon numbers per FID varied by the excitation power, acquisition time, or bin factor. (C) Fluorescence lifetime image of a hippocampal brain slice (CA1 region). The average photon numbers for single-pixel FIDs in the three glia cells visible in the center of the image were 296 (I), 269 (II), and 373 (III), resulting in reduced fluorescence lifetimes: 4.22 ns (I), 4.24 ns (II), and 4.15 ns (III). (D) A second fluorescence lifetime image of the same brain slice area, measured with a longer acquisition time and otherwise identical measurement conditions. Consequently, the respective FID photon numbers were significantly higher 4817 (I), 3941 (II), and 6240 (III), resulting in expected fluorescence lifetimes: 4.88 ns (I), 4.96 ns (II), and 4.73 ns (III).
FIGURE 2
FIGURE 2
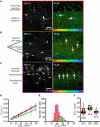
Chloride imaging in acute hippocampal slices. (A–C) SR101 stained astrocytes and representative fluorescence lifetime images (FLIM) of the CA1 (A) and DG (B) regions and RGL cells (C), with glial cells marked by arrows. Average fluorescence lifetimes (in ns) are color-coded. (D) Stern–Volmer plot of the chloride dependence of the MQAE fluorescence lifetime in hippocampal glia. Data points represent the inverse average fluorescence lifetime at different chloride concentrations, error bars indicate standard deviation, and solid lines represent a linear fit (10 – 60 mM; N = 3 animals/chloride concentration, >10 cells/mouse/chloride concentration, mean ± SD). (E,F) Physiological [Cl]int of all three glial cell types shown as a histogram (E) or box plot (F) (red – CA1, green – DG, purple – RGL). In the box plot (mean ± 1.5 IQR), black points are the mean [Cl]int from individual animals and colored points are the mean [Cl]int from individual cells. Abbreviations: CA1, cornu ammonis region 1; DG, dentate gyrus; RGL, radial glial-like cells.
FIGURE 3
FIGURE 3
Chloride imaging of neocortical layer II/III astrocytes. (A) SR101 stained astrocytes and representative fluorescence lifetime image (FLIM) of neocortical astrocytes (marked by arrows). Average fluorescence lifetimes (in ns) are color-coded. (B) Stern–Volmer plot of the chloride dependence of the MQAE fluorescence lifetime in neocortical astrocytes. Data points represent the inverse average fluorescence lifetime measured at different chloride concentrations, error bars indicate the standard deviation, and solid lines represent a linear fit (10 – 60 mM; N = 3 animals/chloride concentration, >10 cells/mouse/chloride concentration, mean ± SD). (C) Physiological [Cl]int in neocortical astrocytes, shown as a histogram and box plot. In the box plot (mean ± 1.5 IQR), black points are the mean [Cl]int from individual animals and colored points are the mean [Cl]int from individual cells.
FIGURE 4
FIGURE 4
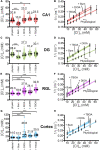
Modification of glial resting [Cl]int and chloride dependence of MQAE fluorescence lifetimes by indicated blocker. [Cl]int of hippocampal astrocytes in the CA1 (A) and DG (C) regions, RGL cells (E), and neocortical glial cells (G) under physiological conditions or after treatment with blocker, as indicated. In the box plot (mean ± 1.5 IQR), black points are the mean [Cl]int from individual animals and colored points are the mean [Cl]int from individual cells. Stern–Volmer plots for glial cells in the CA1 (B) and DG (D) regions, RGL cells of the hippocampus (F), and neocortical glial cells (H). For each brain region, Stern–Volmer plots were created under physiological conditions and in the presence of bumetanide, R-(+)-DIOA, or DL-TBOA to visualize the influence of these blockers on MQAE fluorescence lifetimes. Data points represent the inverse average fluorescence lifetime at different chloride concentrations, error bars indicate the standard deviation, and the solid lines represent a linear fit (10–60 mM; N = 3 animals/chloride concentration, >10 cells/mouse/chloride concentration, mean ± SD). *p ≤ 0.05, **p ≤ 0.01, ***p ≤ 0.001, one-way ANOVA with Holm–Sidak post hoc test; all p-values for this figure are mentioned in the results. Abbreviations: CA1, cornu ammonis region 1; DG, dentate gyrus; RGL, radial glial-like cells; Physiol, physiological; Bum, bumetanide; DIOA, R-(+)-DIOA; UCPH, UCPH-101; TBOA, DL-TBOA.
FIGURE 5
FIGURE 5
Modification of glial [Cl]int after energy restriction. [Cl]int of hippocampal astrocytes in the CA1 (A) and DG (B) regions, of RGL cells (C), and of neocortical glial cells (D) under physiological conditions or after energy restriction for the indicated times. Black points are the mean [Cl]int from individual animals (mean ± SD) and colored points are the mean [Cl]int from individual cells. **p ≤ 0.01, one-way ANOVA with Holm–Sidak post hoc test; all p-values for this figure are mentioned in the results. Abbreviations: CA1, cornu ammonis region 1; DG, dentate gyrus; RGL, radial glial-like cells; Physiol, physiological; Ischemia, Chemical ischemia.
FIGURE 6
FIGURE 6
Astrocytes do not swell upon transient chemical ischemia. (A) Deconvolved confocal extended focus images showing SR101-labeled astrocytes in layer II/III of the mouse neocortex under control conditions, at 5 min after 10 min of chemical ischemia, and after 20 min of recovery. Arrowheads indicate areas of slight somatic shrinkage under chemical ischemia. The merged image is an overlay of the same cell under control (green) and ischemic (red) conditions (B) Box plots of astrocytic soma width (in μm) under the conditions described in panel (A). (C) Deconvolved confocal extended focus images showing SR101-labeled astrocytes in layer II/III of the mouse neocortex under control conditions, at 5 min after a 10 min perfusion with hypo-osmotic saline (Hypo), and after 10 min of recovery (Recovery). The merged image is an overlay of the same cell under control (green) and hypo-osmotic (red) conditions. Arrowheads indicate areas of somatic swelling. (D) Box plots of astrocytic soma widths (as described in panel (B)) under the conditions described in panel (C). Black squares are means, black lines are medians, whiskers cover min–max ranges, and boxes show the standard deviation; single data points are shown in blue. n.s. p ≥ 0.05, **p ≤ 0.01, ***p ≤ 0.001, one-way ANOVA with Bonferroni post hoc test; all p-values for this figure are mentioned in the results. Abbreviation: n.s.: not significant.
FIGURE 7
FIGURE 7
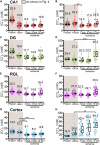
Modification of glial [Cl]int by a specific chloride transport blocker under energy restriction. [Cl]int of hippocampal astrocytes in the CA1 (A,B) and DG (C,D) regions, of RGL cells (E,F), and of neocortical glial cells (G,H) under physiological conditions, in the presence of a specific chloride transport blocker (bumetanide or R-(+)-DIOA), or after energy restriction for the indicated times in the presence of the chloride transport blocker. In the box plot (mean ± 1.5 IQR), black points summarize the mean [Cl]int from individual animals and colored points represent the mean [Cl]int from individual cells. **p ≤ 0.01 and ***p ≤ 0.001, one-way ANOVA with Holm–Sidak post hoc test. Abbreviations: CA1, cornu ammonis region 1; DG, dentate gyrus; RGL, radial glial-like cells; Physiol, physiological; Ischemia, Chemical ischemia; Bum, bumetanide; DIOA, R-(+)-DIOA.
FIGURE 8
FIGURE 8
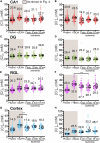
Modification of glial [Cl]int by a specific EAAT transporter blocker under energy restriction. [Cl]int of hippocampal astrocytes in the CA1 (A,B) and DG (C,D) regions, RGL cells (E,F), and neocortical glial cells (G,H) under different conditions: physiological conditions, in the presence of a specific EAAT transporter blocker (UCPH-101 or DL-TBOA), and after energy restriction (ischemia) for the indicated times in the presence of the blocker. In the box plot (mean ± 1.5 IQR), black points are the mean [Cl]int from individual animals and colored points are the mean [Cl]int from individual cells. **p ≤ 0.01, one-way ANOVA with Holm–Sidak post hoc test; all p-values for this figure are mentioned in the results. Abbreviations: CA1, cornu ammonis region 1; DG, dentate gyrus; RGL, radial glia-like cells; UCPH, UCPH-101; TBOA, DL-TBOA.
FIGURE 9
FIGURE 9
Differences in cortical and DG chloride homeostasis can be described by variation in glial KCC and NKCC1 expression levels in a mathematical model of the tripartite synapse. (A) Log–log plot of the KCC flux rate against the NKCC1 flux rate relative to baseline flux rates. Two distinct regions in this two-parameter space account for the results obtained with cortical (blue) or DG (green) [Cl]int. The indicated regions correspond to parameter values with qualitative agreement with experimental traces. (B) Predicted changes in astrocytic [Cl]int without blocker under conditions used in experiments. Left panel, cortex; right panel; DG. (C) The model was subjected to block of a specific chloride transport system (light gray block: bumetanide, R-(+)-DIOA or DL-TBOA) for the first 30 min. At 20 min after the start of transport inhibition, transient ischemia (energy deprivation) was simulated by blocking neuronal and astrocyte Na+-K+-ATPase for 10 min (dark gray block), followed by energy restoration for 30 min in the presence of the mentioned blocker. Upper panel, cortex; lower panel, DG. Abbreviations: DG, dentate gyrus; ED, energy deprivation; DIOA, R-(+)-DIOA; TBOA, DL-TBOA.
FIGURE 10
FIGURE 10
Predicted cortical and DG astrocyte chloride dynamics at Na+-K+-ATPase activity reduced to 50 or 60% of the baseline activity during chemical ischemia (energy deprivation). Time-dependent changes in [Cl]int for neocortical (A) and DG (B) astrocytes by reducing neuronal and astrocyte Na+-K+-ATPase activity for 10 min (dark gray block) to 50% (blue line) or to 60% (yellow line) of baseline. The model was subjected to block of a specific chloride transport system (light gray block: bumetanide, R-(+)-DIOA or DL-TBOA). At 20 min after the start of transport inhibition, transient ischemia was simulated followed by energy restoration for 40 min in the presence of the mentioned blocker. Abbreviations: DG, dentate gyrus; ED, energy deprivation; DIOA, R-(+)-DIOA; TBOA, DL-TBOA.

Similar articles

Cited by

References

    1. Abrahamsen B., Schneider N., Erichsen M. N., Huynh T. H., Fahlke C., Bunch L., et al. (2013). Allosteric modulation of an excitatory amino acid transporter: the subtype-selective inhibitor UCPH-101 exerts sustained inhibition of EAAT1 through an intramonomeric site in the trimerization domain. J. Neurosci. 33 1068–1087. 10.1523/jneurosci.3396-12.2013 - DOI - PMC - PubMed
    1. Andrew R. D., Labron M. W., Boehnke S. E., Carnduff L., Kirov S. A. (2007). Physiological evidence that pyramidal neurons lack functional water channels. Cereb. Cortex 17 787–802. 10.1093/cercor/bhk032 - DOI - PubMed
    1. Auer T., Schreppel P., Erker T., Schwarzer C. (2020). Functional characterization of novel bumetanide derivatives for epilepsy treatment. Neuropharmacology 162:107754. 10.1016/j.neuropharm.2019.107754 - DOI - PubMed
    1. Belov Kirdajova D., Kriska J., Tureckova J., Anderova M. (2020). Ischemia-triggered glutamate excitotoxicity from the perspective of glial cells. Front. Cell. Neurosci. 14:51. 10.3389/fncel.2020.00051 - DOI - PMC - PubMed
    1. Benesova J., Hock M., Butenko O., Prajerova I., Anderova M., Chvatal A. (2009). Quantification of astrocyte volume changes during ischemia in situ reveals two populations of astrocytes in the cortex of GFAP/EGFP mice. J. Neurosci. Res. 87 96–111. 10.1002/jnr.21828 - DOI - PubMed

LinkOut - more resources