. 2021 Sep 16:15:725731.
doi: 10.3389/fnana.2021.725731. eCollection 2021.

Quantitative Susceptibility Mapping of the Basal Ganglia and Thalamus at 9.4 Tesla

Affiliations

Quantitative Susceptibility Mapping of the Basal Ganglia and Thalamus at 9.4 Tesla

Vinod Jangir Kumar et al. Front Neuroanat. .

Abstract

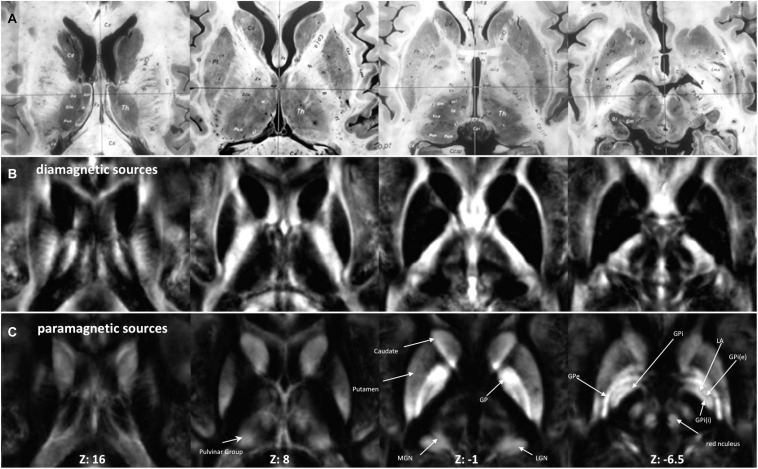
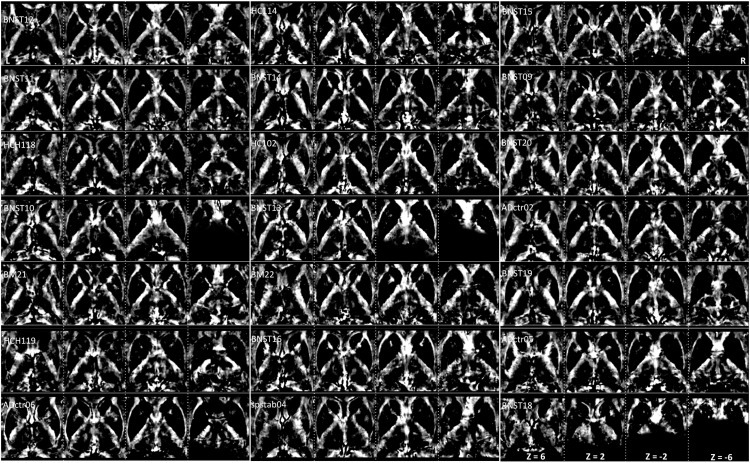
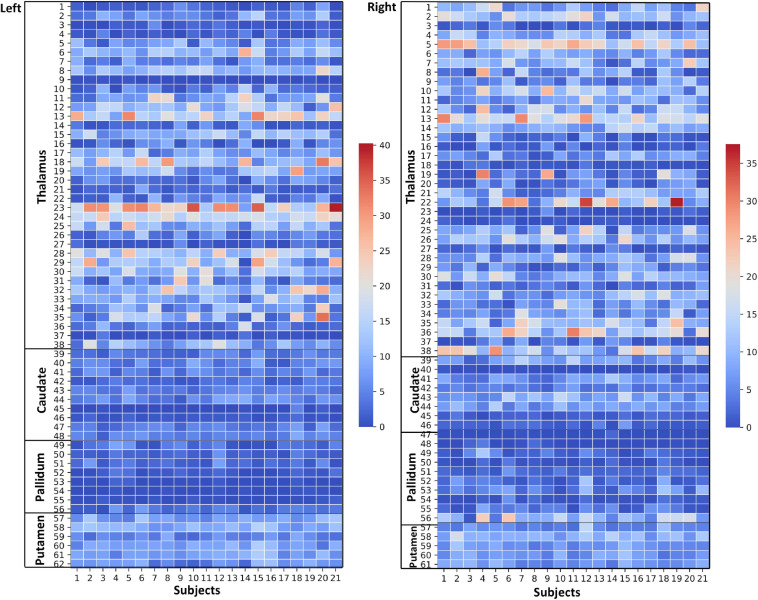
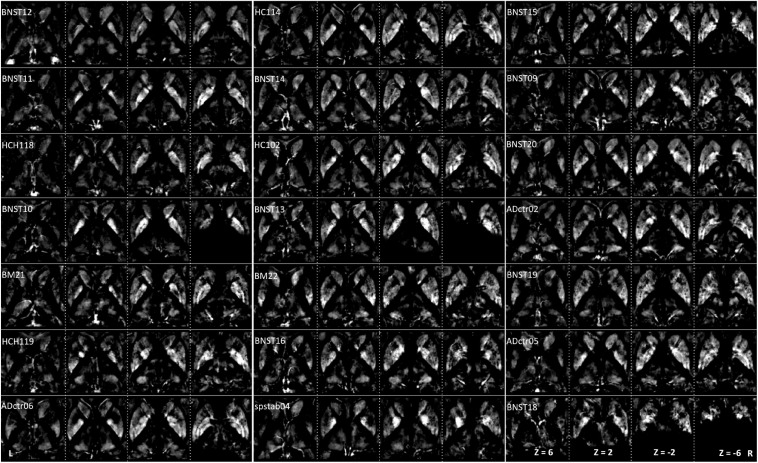
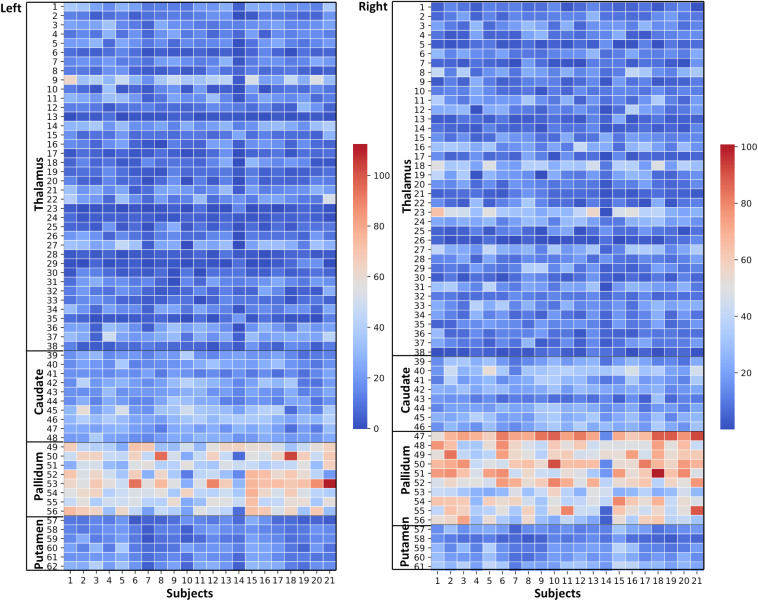
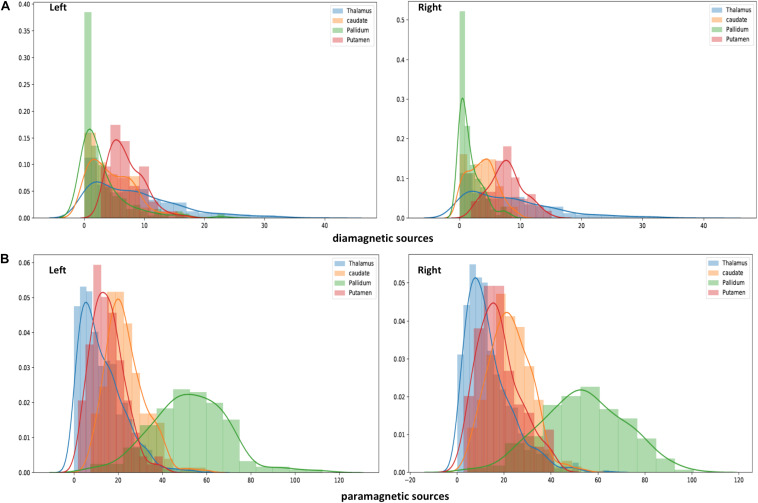
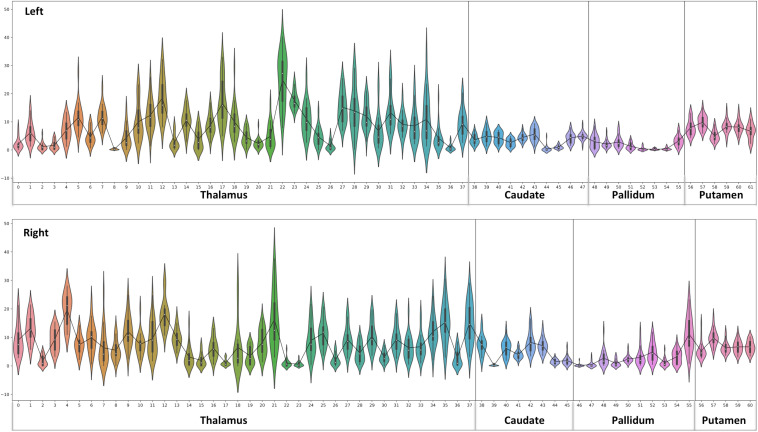
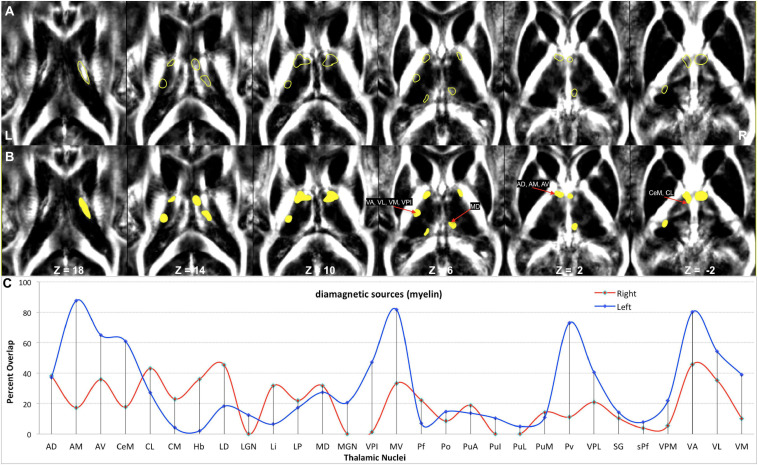
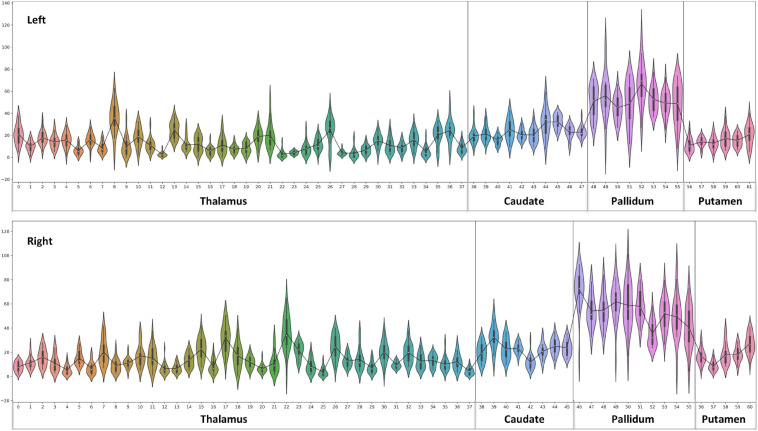
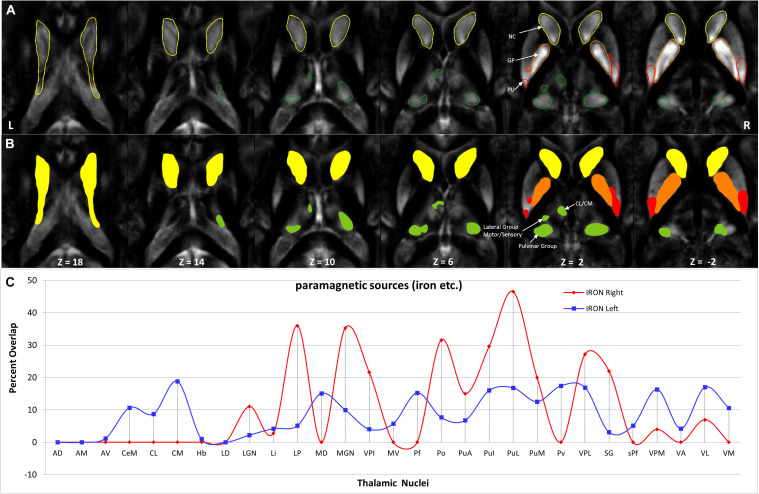
The thalamus (Th) and basal ganglia (BG) are central subcortical connectivity hubs of the human brain, whose functional anatomy is still under intense investigation. Nevertheless, both substructures contain a robust and reproducible functional anatomy. The quantitative susceptibility mapping (QSM) at ultra-high field may facilitate an improved characterization of the underlying functional anatomy in vivo. We acquired high-resolution QSM data at 9.4 Tesla in 21 subjects, and analyzed the thalamic and BG by using a prior defined functional parcellation. We found a more substantial contribution of paramagnetic susceptibility sources such as iron in the pallidum in contrast to the caudate, putamen, and Th in descending order. The diamagnetic susceptibility sources such as myelin and calcium revealed significant contributions in the Th parcels compared with the BG. This study presents a detailed nuclei-specific delineation of QSM-provided diamagnetic and paramagnetic susceptibility sources pronounced in the BG and the Th. We also found a reasonable interindividual variability as well as slight hemispheric differences. The results presented here contribute to the microstructural knowledge of the Th and the BG. In specific, the study illustrates QSM values (myelin, calcium, and iron) in functionally similar subregions of the Th and the BG.

Keywords: QSM; basal ganglia; high field MRI; iron; myelin; thalamus.


Conflict of interest statement

The authors declare that the research was conducted in the absence of any commercial or financial relationships that could be construed as a potential conflict of interest.

Figures

FIGURE 1
FIGURE 1
Workflow of the quantitative susceptibility mapping (QSM) evaluation. An illustration of the workflow depicts the analysis steps. The first analysis step was a mix of several preprocessing steps: (1) generation of QSM maps by using background removal imposing image smoothness and moderate contrast; (2) transformation into standard MNI brain space, after co-registration to anatomy data of each individual subject with known spatial transformation (DARTEL), and reslicing onto a grid with isotropic 400 μm voxels using trilinear interpolation; (3) bifurcation/subdivision into diamagnetic and paramagnetic components. In the next step, the diamagnetic and paramagnetic maps were bifurcated from the normalized QSM maps. Afterward, in the post-processing steps, individual as well as group fixed maps were visualized. The last analysis step encompasses statistics and visualization of the group results. The graphical workflow was created with BioRender.com https://app.biorender.com/biorender-templates.
FIGURE 2
FIGURE 2
Anatomy and MRI of thalamus (Th) and basal ganglia (BG): (A) four selected slices were adapted (Schaltenbrand and Bailey, 1959) (B,C) Corresponding QSM images of diamagnetic and paramagnetic sources. GPe, external segments of the globus pallidus; GPi, internal segments of the globus pallidus; GPi (e), subsegment of internal segments of the globus pallidus; GPi (i), subsegment of internal segments of the globus pallidus; LGN, lateral geniculate nucleus; MGN, medial geniculate nucleus; LA, lamina accessoria.
FIGURE 3
FIGURE 3
Interindividual maps: QSM images of diamagnetic sources (myelin and calcium, etc.) were obtained from 21 subjects ordered with increasing age. The grayscale color code indicates brighter values in the highly myelinated structures. In the grayscale, brighter values indicate higher and darker lower values. Note the highest values in the internal capsule: Th, NC, PU, and GP display lower values. However, in the quantitative analysis, the difference converges, as the scale of differences in the visualization is heavily biased by the internal capsule fiber contrast. Three subjects (BNST10, BNST13, and BNST18) show only partial coverage.
FIGURE 4
FIGURE 4
Thalamus and Basal Ganglia (Diamagnetic sources, i.e., Myelin, Calcium, etc.): Left hemisphere: Mean diamagnetic source values for all parcels in all subjects in the left hemisphere. Each column represents each subject. Each row represents a functional parcel. The total number of functional parcels is 62, i.e., Thalamus (38) + Caudate (10) + Pallidum (8) + Putamen. (6) Right hemisphere: Mean diamagnetic source values for all parcels in all subjects in the right hemisphere. The total number of ICP functional parcels is 61 i.e., Thalamus (38) + Caudate (8) + Pallidum (10) + Putamen (5). Note the higher values in some thalamus parcels compared to other structures.
FIGURE 5
FIGURE 5
Intervididual maps: QSM images of paramagnetic sources (iron, etc.) obtained from 21 subjects ordered with increasing age. The grayscale color code indicates brighter values in the highly myelinated structures. Note the highest values in the pallidum, caudate, at the specific sites in putamen and thalamus. Darker values indicate lower values. Three subjects (BNST10, BNST13, BNST18) show only partial coverage.
FIGURE 6
FIGURE 6
Effects of paramagnetic sources (iron) in Th and BG: Left hemisphere: Mean diamagnetic source values for all parcels in all subjects. Each column represents each subject. Each row represents a functional parcel. The total number of ICP functional parcels are 62, i.e., Th (38) + caudate (10) + pallidum (8) + putamen (6). Note the higher mean values in pallidum and some of Th parcels compared to other structures. Right hemisphere: Mean diamagnetic source values for all parcels in all subjects. Each column represents each subject. Each row represents a functional parcel. The total number of ICP functional parcels are 61, i.e., Th (38) + caudate (8) + pallidum (10) + putamen (5). Note the higher mean values in pallidum and some of Th parcels compared to other structures.
FIGURE 7
FIGURE 7
Histogram of QSM-values in diamagnetic (A) and paramagnetic sources (B): Distribution of mean di- and paramagnetic sources within Th and BG. The different colors indicate corresponding structures. The X-axis depicts different QSM values and the Y-axis depicts the amount of each value. Note the differences, where the diamagnetic source, the pallidum, shows the first peak, caudate the second, putamen the third, and Th in the last, while for the mean paramagnetic source, Th shows the first peak, putamen the second, caudate the third, and pallidum the last. Overall, the diamagnetic sources span a more narrow range of values than paramagnetic sources.
FIGURE 8
FIGURE 8
Violin plot of Diamagnetic sources, i.e., myelin and calcium: The violin plot highlights only the mean of each parcel. The black-line plot shows only the mean values of all parcels in all subjects. First, note the overall lower values for the caudate and pallidum, and in contrast, putamen and several parcels in the Th show consistently higher pallidum parcel values. Second, the violin plot reveals inter-individual variability.
FIGURE 9
FIGURE 9
Depiction of values (>10 ppb) of diamagnetic sources in Th. (A) The spatial location of diamagnetic parcels with mean values > 10 ppb within the Th. BG does not reveal areas exceeding a threshold of >10 ppb. The yellow color outline encircles thalamic parcels. (B) Colored version of the first row illustrates regions with higher values. (C) Calculated overlap map of diamagnetic parcels with the thalamic nuclei according to the atlas of Morel show higher values in the anterior Th (AD, AM, and AV), intralaminar nuclei (CeM and CL), the motor and sensory nuclei (VA, VL, VM, VPI, and MV), and in Pv as well as the MD nuclei.
FIGURE 10
FIGURE 10
Violin plot of paramagnetic sources (iron): the violin plot highlights only the mean of each parcel. The black line plot shows only the mean values of all parcels in all subjects. First, note the overall lower values for the Th, caudate, and putamen contrast to consistent higher pallidum parcels values. Second, the violin plot reveals inter-individual variability.
FIGURE 11
FIGURE 11
Depiction of value (>20) of paramagnetic sources in Th and BG: (A) Outline depiction of the paramagnetic parcel with mean values > 20 for the caudate (yellow), putamen (red), pallidum (orange), and Th (green). Note that the striatum (pallidum and caudate) encircle most of their structure above the threshold. (B) Colored version of the first row illustrates higher value regions. (C) Calculated overlap with the Thatlas shows higher values in the nuclei of the posterior Th (Po, PuA, Pul, and PuL), the relay nuclei (MGN, VPI, VPL, VPM, and VL), and the high-order intralaminar nuclei (CL and CM).

Similar articles

Cited by

References

    1. Alkemade A., Mulder M. J., Groot J. M., Isaacs B. R., van Berendonk N., Lute N., et al. (2020). The amsterdam ultra-high field adult lifespan database (AHEAD): a freely available multimodal 7 tesla submillimeter magnetic resonance imaging database. NeuroImage 221:117200. 10.1016/j.neuroimage.2020.117200 - DOI - PubMed
    1. DeLong M. R., Wichmann T. (2007). Circuits and circuit disorders of the basal ganglia. Arch. Neurol. 64 20–24. 10.1001/archneur.64.1.20 - DOI - PubMed
    1. Filyushkina V., Popov V., Medvednik R., Ushakov V., Batalov A., Tomskiy A., et al. (2019). Hyperactivity of basal ganglia in patients with parkinson’s disease during internally guided voluntary movements. Front. Neurol. 10:847. 10.3389/fneur.2019.00847 - DOI - PMC - PubMed
    1. Forstmann B. U., de Hollander G., van Maanen L., Alkemade A., Keuken M. C. (2017). Towards a mechanistic understanding of the human subcortex. Nat. Rev. Neurosci. 18 57–65. 10.1038/nrn.2016.163 - DOI - PubMed
    1. Glasser M. F., Van Essen D. C. (2011). Mapping human cortical areas in vivo based on myelin content as revealed by T1- and T2-weighted MRI. J. Neurosci. Off. J. Soc. Neurosci. 31, 11597–11616. 10.1523/JNEUROSCI.2180-11.2011 - DOI - PMC - PubMed

LinkOut - more resources