. 2021 Sep 17:15:728151.
doi: 10.3389/fnhum.2021.728151. eCollection 2021.

Investigating Language and Domain-General Processing in Neurotypicals and Individuals With Aphasia - A Functional Near-Infrared Spectroscopy Pilot Study

Affiliations

Investigating Language and Domain-General Processing in Neurotypicals and Individuals With Aphasia - A Functional Near-Infrared Spectroscopy Pilot Study

Natalie Gilmore et al. Front Hum Neurosci. .

Abstract

Brain reorganization patterns associated with language recovery after stroke have long been debated. Studying mechanisms of spontaneous and treatment-induced language recovery in post-stroke aphasia requires a network-based approach given the potential for recruitment of perilesional left hemisphere language regions, homologous right hemisphere language regions, and/or spared bilateral domain-general regions. Recent hardware, software, and methodological advances in functional near-infrared spectroscopy (fNIRS) make it well-suited to examine this question. fNIRS is cost-effective with minimal contraindications, making it a robust option to monitor treatment-related brain activation changes over time. Establishing clear activation patterns in neurotypical adults during language and domain-general cognitive processes via fNIRS is an important first step. Some fNIRS studies have investigated key language processes in healthy adults, yet findings are challenging to interpret in the context of methodological limitations. This pilot study used fNIRS to capture brain activation during language and domain-general processing in neurotypicals and individuals with aphasia. These findings will serve as a reference when interpreting treatment-related changes in brain activation patterns in post-stroke aphasia in the future. Twenty-four young healthy controls, seventeen older healthy controls, and six individuals with left hemisphere stroke-induced aphasia completed two language tasks (i.e., semantic feature, picture naming) and one domain-general cognitive task (i.e., arithmetic) twice during fNIRS. The probe covered bilateral frontal, parietal, and temporal lobes and included short-separation detectors for scalp signal nuisance regression. Younger and older healthy controls activated core language regions during semantic feature processing (e.g., left inferior frontal gyrus pars opercularis) and lexical retrieval (e.g., left inferior frontal gyrus pars triangularis) and domain-general regions (e.g., bilateral middle frontal gyri) during hard versus easy arithmetic as expected. Consistent with theories of post-stroke language recovery, individuals with aphasia activated areas outside the traditional networks: left superior frontal gyrus and left supramarginal gyrus during semantic feature judgment; left superior frontal gyrus and right precentral gyrus during picture naming; and left inferior frontal gyrus pars opercularis during arithmetic processing. The preliminary findings in the stroke group highlight the utility of using fNIRS to study language and domain-general processing in aphasia.

Keywords: aphasia; cognition; healthy subjects; language; near infrared-spectroscopy; stroke.


Conflict of interest statement

The authors declare that the research was conducted in the absence of any commercial or financial relationships that could be construed as a potential conflict of interest.

Figures

FIGURE 1
FIGURE 1
Functional near-infrared spectroscopy behavioral tasks.
FIGURE 2
FIGURE 2
Functional near-infrared spectroscopy probe design and sensitivity profile. SS, short-separation regression channel, Warmer colors suggest higher sensitivity to cortex, cooler colors suggest lower sensitivity to cortex.
FIGURE 3
FIGURE 3
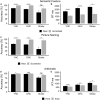
Behavioral task performance for all three participant groups. (A) Semantic feature – accuracy. (B) Semantic feature – reaction time. (C) Picture naming – accuracy. (D) Arithmetic – accuracy. (E) Arithmetic – reaction time. ms, milliseconds; %, percent accurate. * represents significant difference between conditions at p < 0.05 level, ** represents significant difference between conditions at p < 0.01 level, and **** represents significant difference between conditions at p < 0.001 level.
FIGURE 4
FIGURE 4
Comparison of group average HRF between task conditions for left hemisphere ROIs during semantic feature judgment. HbO and HbR changes in μM units. Significant difference between task conditions at p < 0.05 level are reflected by a green dot and after FDR-adjustment with alpha of 0.05 by a black dot. Black borders denote ROIs for which there was a significant difference between the task conditions for at least three consecutive seconds. When the red line is higher than the maroon line, it suggests there was greater HbO concentration change in the real than scrambled picture condition. When the blue line is lower than the purple line, it suggests there was lower HbR concentration change in the real than scrambled picture condition. Both patterns are consistent with greater neural activation (i.e., increase in oxygenated blood, decrease in deoxygenated blood) in the real than scrambled picture condition and vice versa. LSFG, left superior frontal gyrus; LMFG, left middle frontal gyrus; LIFGtri, left inferior frontal gyrus pars triangularis; LIFGoper, left inferior frontal gyrus pars opercularis; LPCG, left precentral gyrus; LSMG, left supramarginal gyrus; LAG, left angular gyrus; YHC, younger healthy controls; OHC, older healthy controls; HbO, oxygenated hemoglobin concentration change; HbR, deoxygenated hemoglobin concentration change, N/A, not available due to combination of pruned channels due to poor SNR and lesion.
FIGURE 5
FIGURE 5
Comparison of group average HRF between task conditions for right hemisphere ROIs during semantic feature judgment. HbO and HbR changes in μM units. Significant difference between task conditions at p < 0.05 level are reflected by a green dot and after FDR-adjustment with alpha of 0.05 by a black dot. Black borders denote ROIs for which there was a significant difference between the task conditions for at least three consecutive seconds. When the red line is higher than the maroon line, it suggests there was greater HbO concentration change in the real than scrambled picture condition. When the blue line is lower than the purple line, it suggests there was lower HbR concentration change in the real than scrambled picture condition. Both patterns are consistent with greater neural activation (i.e., increase in oxygenated blood, decrease in deoxygenated blood) in the real than scrambled picture condition and vice versa. RSFG, right superior frontal gyrus; RMFG, right middle frontal gyrus; RIFGtri, right inferior frontal gyrus pars triangularis; RIFGoper, right inferior frontal gyrus pars opercularis; RPCG, right precentral gyrus; RSMG, right supramarginal gyrus; RAG, right angular gyrus; YHC, younger healthy controls; OHC, older healthy controls; HbO, oxygenated hemoglobin concentration change; HbR, deoxygenated hemoglobin concentration change.
FIGURE 6
FIGURE 6
Group mean HRF concentration overlays displaying the real minus scrambled picture contrast during semantic feature judgment. The color bar reflects the scale of the concentration change in μM units. HbO, oxygenated hemoglobin concentration change; HbR, deoxygenated hemoglobin concentration change; YHC, younger healthy controls; OHC, older healthy controls.
FIGURE 7
FIGURE 7
Comparison of group average HRF between task conditions for left hemisphere ROIs during picture naming. HbO and HbR changes in μM units. Significant difference between task conditions at p < 0.05 level are reflected by a green dot and after FDR-adjustment with alpha of 0.05 by a black dot. Black borders denote ROIs for which there was a significant difference between the task conditions for at least three consecutive seconds. When the red line is higher than the maroon line, it suggests there was greater HbO concentration change in the real than scrambled picture condition. When the blue line is lower than the purple line, it suggests there was lower HbR concentration change in the real than scrambled picture condition. Both patterns are consistent with greater neural activation (i.e., increase in oxygenated blood, decrease in deoxygenated blood) in the real than scrambled picture condition and vice versa. LSFG, left superior frontal gyrus; LMFG, left middle frontal gyrus; LIFGtri, left inferior frontal gyrus pars triangularis; LIFGoper, left inferior frontal gyrus pars opercularis; LPCG, left precentral gyrus; LSMG, left supramarginal gyrus; LAG, left angular gyrus; YHC, younger healthy controls; OHC, older healthy controls; HbO, oxygenated hemoglobin concentration change; HbR, deoxygenated hemoglobin concentration change; N/A, not available due to combination of pruned channels due to poor SNR and lesion.
FIGURE 8
FIGURE 8
Comparison of group average HRF between task conditions for right hemisphere ROIs during picture naming. HbO and HbR changes in μM units. Significant difference between task conditions at p < 0.05 level are reflected by a green dot and after FDR-adjustment with alpha of 0.05 by a black dot. Black borders denote ROIs for which there was a significant difference between the task conditions for at least three consecutive seconds. When the red line is higher than the maroon line, it suggests there was greater HbO concentration change in the real than scrambled picture condition. When the blue line is lower than the purple line, it suggests there was lower HbR concentration change in the real than scrambled picture condition. Both patterns are consistent with greater neural activation (i.e., increase in oxygenated blood, decrease in deoxygenated blood) in the real than scrambled picture condition and vice versa. RSFG, right superior frontal gyrus; RMFG, right middle frontal gyrus; RIFGtri, right inferior frontal gyrus pars triangularis; RIFGoper, right inferior frontal gyrus pars opercularis; RPCG, right precentral gyrus; RSMG, right supramarginal gyrus; RAG, right angular gyrus; YHC, younger healthy controls; OHC, older healthy controls; HbO, oxygenated hemoglobin concentration change; HbR, deoxygenated hemoglobin concentration change.
FIGURE 9
FIGURE 9
Group mean HRF concentration overlays displaying the real minus scrambled picture contrast during picture naming. The color bar reflects the scale of the concentration change in μM units. HbO, oxygenated hemoglobin concentration change; HbR, deoxygenated hemoglobin concentration change; YHC, younger healthy controls; OHC, older healthy controls.
FIGURE 10
FIGURE 10
Comparison of group average HRF between task conditions for left hemisphere ROIs during hard vs. easy addition. HbO and HbR changes in μM units. Significant difference between task conditions at p < 0.05 level are reflected by a green dot and after FDR-adjustment with alpha of 0.05 by a black dot. Black borders denote ROIs for which there was a significant difference between the task conditions for at least three consecutive seconds. When the red line is higher than the maroon line, it suggests there was greater HbO concentration change in the hard than easy addition condition. When the blue line is lower than the purple line, it suggests there was lower HbR concentration change in the hard than easy addition condition. Both patterns are consistent with greater neural activation (i.e., increase in oxygenated blood, decrease in deoxygenated blood) in the hard than easy addition and vice versa. LSFG, left superior frontal gyrus; LMFG, left middle frontal gyrus; LIFGtri, left inferior frontal gyrus pars triangularis; LIFGoper, left inferior frontal gyrus pars opercularis; LPCG, left precentral gyrus; LSMG, left supramarginal gyrus; LAG, left angular gyrus; YHC, younger healthy controls; OHC, older healthy controls; HbO, oxygenated hemoglobin concentration change; HbR, deoxygenated hemoglobin concentration change; N/A, not available due to combination of pruned channels due to poor SNR and lesion.
FIGURE 11
FIGURE 11
Comparison of group average HRF between task conditions for right hemisphere ROIs during hard vs. easy addition. HbO and HbR changes in μM units. Significant difference between task conditions at p < 0.05 level are reflected by a green dot and after FDR-adjustment with alpha of 0.05 by a black dot. Black borders denote ROIs for which there was a significant difference between the task conditions for at least three consecutive seconds. When the red line is higher than the maroon line, it suggests there was greater HbO concentration change in the hard than easy addition condition. When the blue line is lower than the purple line, it suggests there was lower HbR concentration change in the hard than easy addition condition. Both patterns are consistent with greater neural activation (i.e., increase in oxygenated blood, decrease in deoxygenated blood) in in the hard than easy addition condition and vice versa. RSFG, right superior frontal gyrus; RMFG, right middle frontal gyrus; RIFGtri, right inferior frontal gyrus pars triangularis; RIFGoper, right inferior frontal gyrus pars opercularis; RPCG, right precentral gyrus; RSMG, right supramarginal gyrus; RAG, right angular gyrus; YHC, younger healthy controls; OHC, older healthy controls; HbO, oxygenated hemoglobin concentration change; HbR, deoxygenated hemoglobin concentration change.
FIGURE 12
FIGURE 12
Group mean HRF concentration overlays displaying the hard minus easy addition contrast during the arithmetic task. The color bar reflects the scale of the concentration change in μM units. HbO, oxygenated hemoglobin concentration change; HbR, deoxygenated hemoglobin concentration change; YHC, younger healthy controls; OHC, older healthy controls.

Similar articles

Cited by

References

    1. Aasted C. M., Yücel M. A., Cooper R. J., Dubb J., Tsuzuki D., Becerra L., et al. (2015). Anatomical guidance for functional near-infrared spectroscopy: atlasviewer tutorial. Neurophotonics 2:020801. 10.1117/1.NPh.2.2.020801 - DOI - PMC - PubMed
    1. Amiri M., Pouliot P., Bonnéry C., Leclerc P.-O., Desjardins M., Lesage F., et al. (2014). An exploration of the effect of hemodynamic changes due to normal aging on the fNIRS response to semantic processing of words. Front. Neurol. 5:249. 10.3389/fneur.2014.00249 - DOI - PMC - PubMed
    1. Arenth P. M., Ricker J. H., Schultheis M. T. (2007). Applications of Functional Near-Infrared Spectroscopy (fNIRS) to neurorehabilitation of cognitive disabilities. Clin. Neuropsychol. 21 38–57. 10.1080/13854040600878785 - DOI - PubMed
    1. Artemenko C., Soltanlou M., Bieck S. M., Ehlis A.-C., Dresler T., Nuerk H.-C. (2019). Individual differences in math ability determine neurocognitive processing of arithmetic complexity: a combined fNIRS-EEG study. Front. Hum. Neurosci. 13:227. 10.3389/fnhum.2019.00227 - DOI - PMC - PubMed
    1. Artemenko C., Soltanlou M., Dresler T., Ehlis A.-C., Nuerk H.-C. (2018). The neural correlates of arithmetic difficulty depend on mathematical ability: evidence from combined fNIRS and ERP. Brain Struct. Funct. 223 2561–2574. 10.1007/s00429-018-1618-0 - DOI - PubMed