. 2021 Sep 17:12:718902.
doi: 10.3389/fphar.2021.718902. eCollection 2021.

Fingolimod and Diabetic Retinopathy: A Drug Repurposing Study

Affiliations

Fingolimod and Diabetic Retinopathy: A Drug Repurposing Study

Carlo Gesualdo et al. Front Pharmacol. .

Abstract

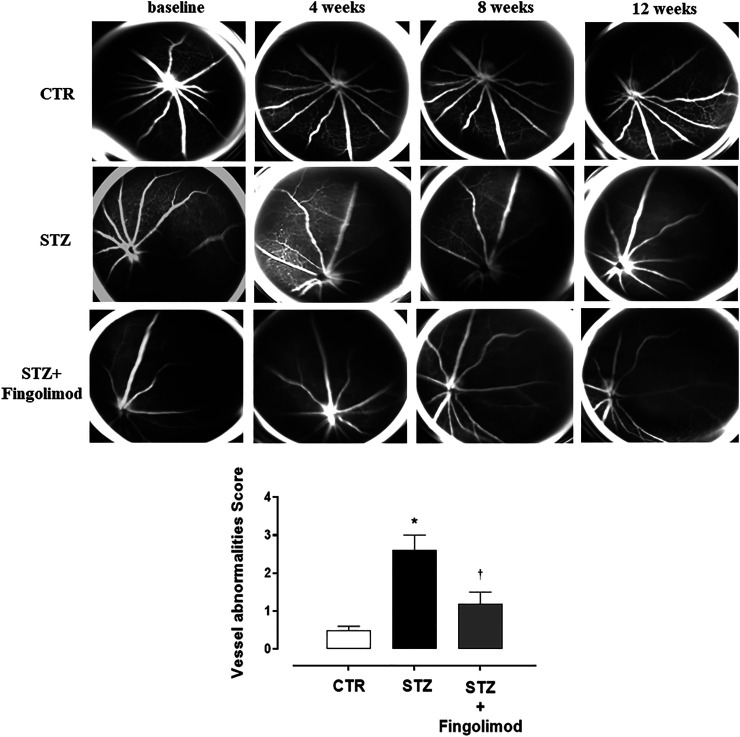
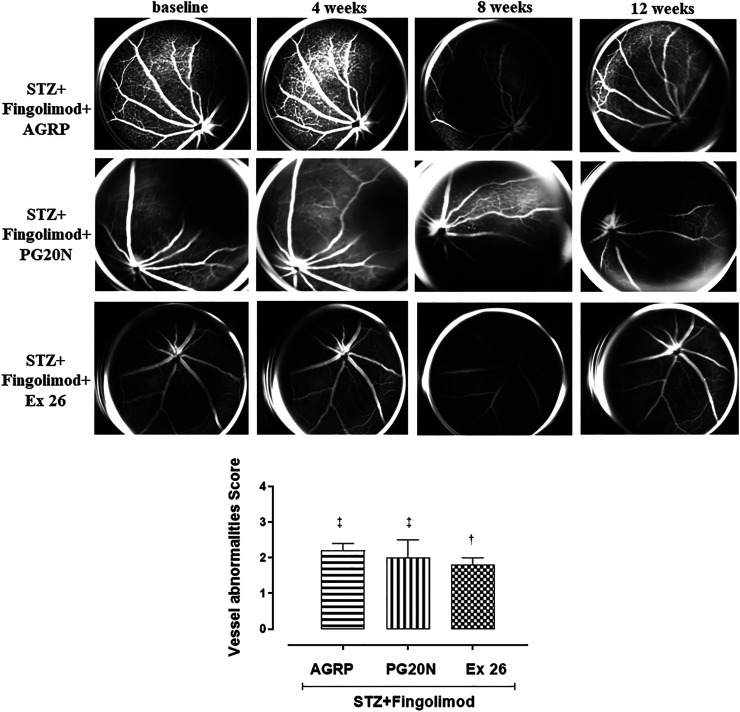
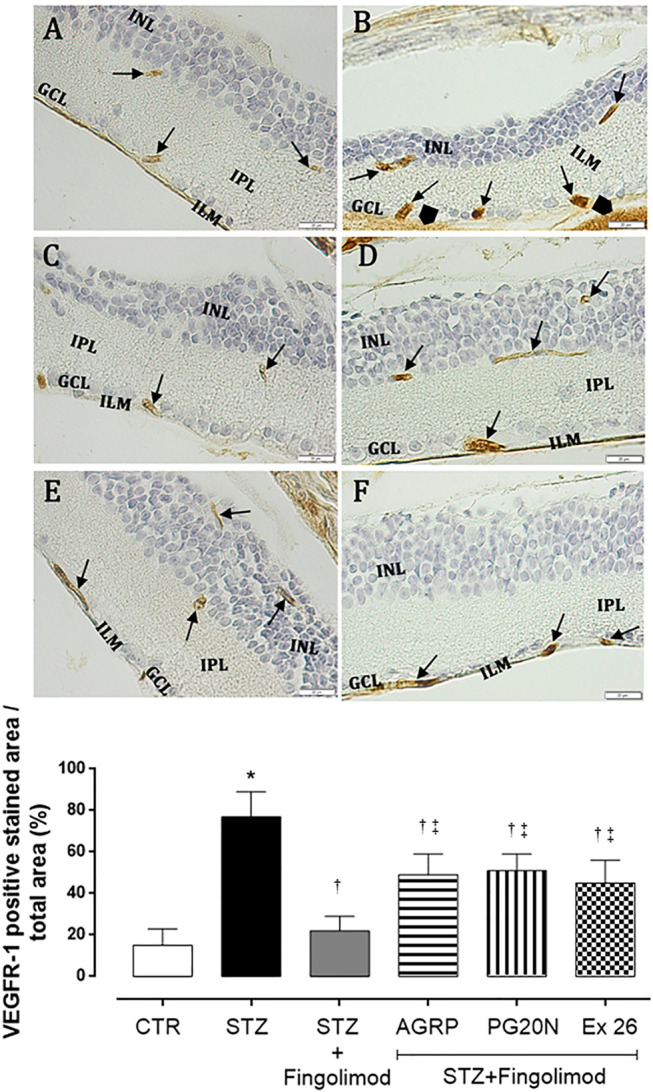
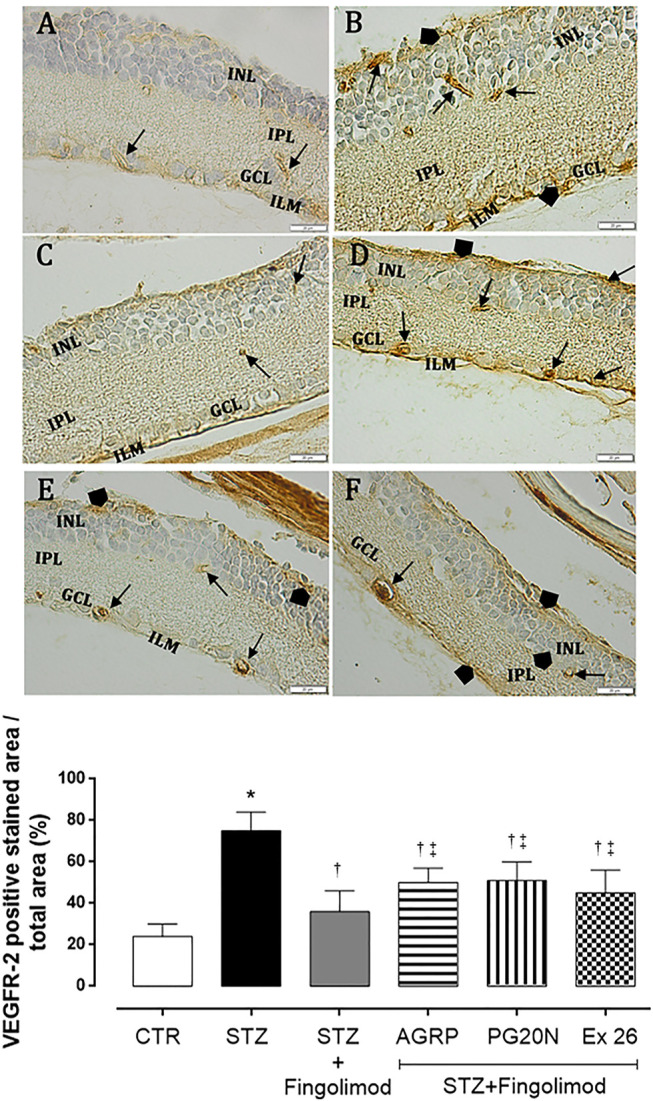
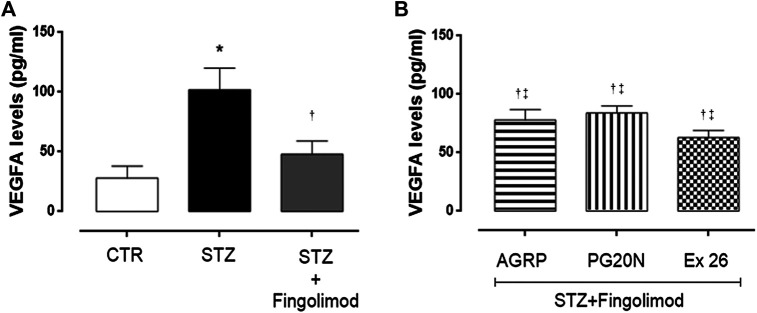
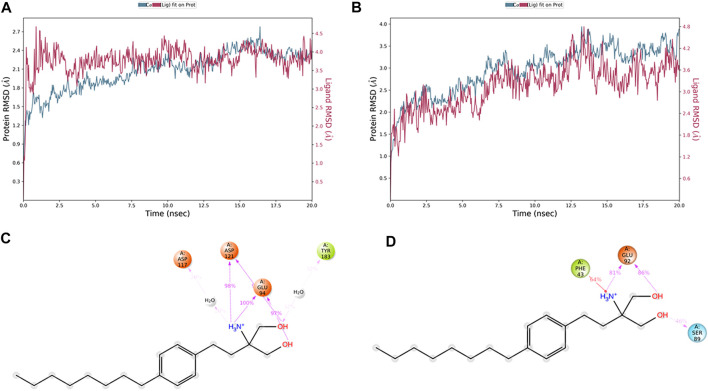
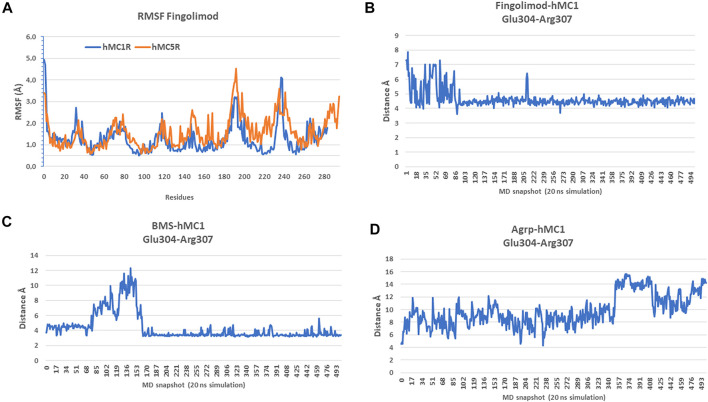
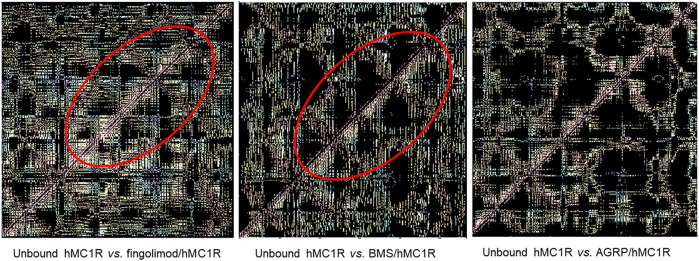
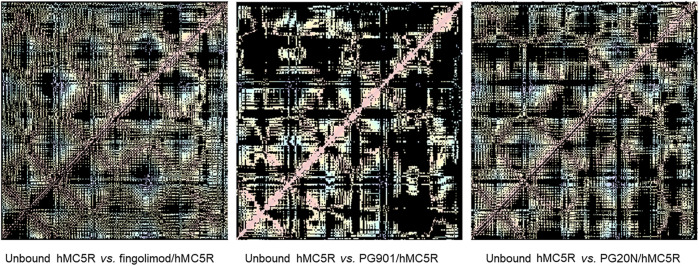
This study aimed to investigate the interactions between fingolimod, a sphingosine 1-phosphate receptor (S1PR) agonist, and melanocortin receptors 1 and 5 (MCR1, MCR5). In particular, we investigated the effects of fingolimod, a drug approved to treat relapsing-remitting multiple sclerosis, on retinal angiogenesis in a mouse model of diabetic retinopathy (DR). We showed, by a molecular modeling approach, that fingolimod can bind with good-predicted affinity to MC1R and MC5R. Thereafter, we investigated the fingolimod actions on retinal MC1Rs/MC5Rs in C57BL/6J mice. Diabetes was induced in C57BL/6J mice through streptozotocin injection. Diabetic and control C57BL/6J mice received fingolimod, by oral route, for 12 weeks and a monthly intravitreally injection of MC1R antagonist (AGRP), MC5R antagonist (PG20N), and the selective S1PR1 antagonist (Ex 26). Diabetic animals treated with fingolimod showed a decrease of retinal vascular endothelial growth factor A (VEGFA) and vascular endothelial growth factor receptors 1 and 2 (VEGFR1 and VEGFR2), compared to diabetic control group. Fingolimod co-treatment with MC1R and MC5R selective antagonists significantly (p < 0.05) increased retinal VEGFR1, VEGFR2, and VEGFA levels compared to mice treated with fingolimod alone. Diabetic animals treated with fingolimod plus Ex 26 (S1PR1 selective blocker) had VEGFR1, VEGFR2, and VEGFA levels between diabetic mice group and the group of diabetic mice treated with fingolimod alone. This vascular protective effect of fingolimod, through activation of MC1R and MC5R, was evidenced also by fluorescein angiography in mice. Finally, molecular dynamic simulations showed a strong similarity between fingolimod and the MC1R agonist BMS-470539. In conclusion, the anti-angiogenic activity exerted by fingolimod in DR seems to be mediated not only through S1P1R, but also by melanocortin receptors.

Keywords: diabetic retinopathy; fingolimod; melanocortin receptor 1; melanocortin receptor 5; sphingosine 1-phosphate receptor.


Conflict of interest statement

The authors declare that the research was conducted in the absence of any commercial or financial relationships that could be construed as a potential conflict of interest.

Figures

FIGURE 1
FIGURE 1
Representative FA images of eyes of non-diabetic mice (CTR), diabetic mice (STZ), and diabetic mice treated with Fingolimod (STZ + Fingolimod) during the follow-up. In CTR mice no changes in retinal vascularity were noticed during follow-up. Instead, in STZ mice, there was an increase in the irregularity of the vessel size, which began at 4 weeks and looked appeared more evident at 8 weeks, in which a pattern of the “rosary-like” vessel was appreciated (red arrow). At 12 weeks there was a further thinning of the vascular caliber. In the STZ + Fingolimod group, no significant changes in retinal vascularity were seen during follow-up. Vessel abnormalities score (graded from 0 to 4) was calculated as the average of the vascular alterations observed (N = 5 animals per group). Vessel abnormalities were graded from 0 to 4 based on the presence of vessel thinning, tortuosity, venous beading, and rosary-like vessels. Each image represents the same retina of the same mouse but at different time points (at baseline, 4–12 weeks of treatment). Statistical significance was assessed by one-way ANOVA, followed by Tukey’s multiple comparison test. *p < 0.05 vs CTR; p < 0.05 vs STZ.
FIGURE 2
FIGURE 2
Representative FA images of eyes from diabetic mice treated with Fingolimod and MC1R antagonist (STZ + Fingolimod + AGRP), MC5R antagonist (STZ + Fingolimod + PG20N), and SP1R1 antagonist (STZ + Fingolimod + Ex 26) during the follow-up. The STZ + Fingolimod + AGRP mice showed irregularity of the vessel size, which did not significantly change over time. The STZ + Fingolimod + PG20N group showed a slight progressive thinning of the vascular caliber during the follow-up. In the STZ + Fingolimod + Ex 26 group, neither the appearance of typical signs of RD nor a significant variation of the size or of the vascular course was appreciated, during the follow up. Vessel abnormalities score (graded from 0 to 4) was calculated as the average of the vascular alterations observed (N = 5 animals per group). Vessel abnormalities were graded from 0 to 4 based on the presence of vessel thinning, tortuosity, venous beading, and rosary-like vessels. Each image represents the same retina of the same mouse but at different time points (at baseline, 4–12 weeks of treatment). Statistical significance was assessed by one-way ANOVA, followed by Tukey’s multiple comparison test. p < 0.05 vs STZ; p < 0.05 vs STZ + Fingolimod.
FIGURE 3
FIGURE 3
VEGFR1 immunohistochemistry in the retina of non-diabetic mice [panel (A), CTR], diabetic mice [panel (B) STZ], diabetic mice receiving Fingolimod alone [panel (C), STZ + Fingolimod], or in combination with MC1R antagonist [panel (D), STZ + Fingolimod + AGRP], MC5R antagonist [panel (E), STZ + Fingolimod + PG20N], and SP1R1 antagonist [panel (F), STZ + Fingolimod + Ex 26]. VEGFR1 positive stain (arrow). VEGFR1 protein levels are reported as percentage (%) ± standard deviation (S.D.) of positive stained area/total area. The images are representative of 10 histological observations per group. Statistical significance was assessed by one-way ANOVA, followed by Tukey’s multiple comparison test. *p < 0.05 vs CTR; p < 0.05 vs STZ; p < 0.05 vs STZ + Fingolimod. INL, inner nuclear layer; IPL, inner plexiform layer; ILM, inner limiting membrane; GLC, ganglion cell layer; retinal microvessels staining of VEGFR1 (arrow), non-vascular staining of VEGFR-1 (arrowhead); magnification: 40X; scale bar: 20 µm. N = 5 retinas per group.
FIGURE 4
FIGURE 4
VEGFR2 immunohistochemistry in the retina of non-diabetic mice [panel (A), CTR], diabetic mice [panel (B), STZ], diabetic mice receiving fingolimod alone [panel (C), STZ + Fingolimod] or in combination with MC1R antagonist [panel (D), STZ + Fingolimod + AGRP], MC5R antagonist [panel (E), STZ + Fingolimod + PG20N], and SP1R1 antagonist [panel (F), STZ + FTY720+Ex 26]. VEGFR2 positive stain (arrow). VEGFR2 protein levels are reported as percentage (%) ± S.D. of positive stained area/total area. The images are representative of 10 histological observations per group. Statistical significance was assessed by one-way ANOVA, followed by Tukey’s multiple comparison test. *p < 0.05 vs CTR; p < 0.05 vs STZ; p < 0.05 vs STZ + Fingolimod. INL, inner nuclear layer; IPL, inner plexiform layer; ILM, inner limiting membrane; GLC, ganglion cell layer; retinal microvessels staining of VEGFR-2 (arrow), non-vascular staining of VEGFR-2 (arrowhead); magnification 40X; scale bar: 20 µm. N = 5 retinas per group.
FIGURE 5
FIGURE 5
VEGFA levels in retina of non-diabetic mice [panel (A), CTR], diabetic mice [panel (A), STZ], diabetic mice receiving fingolimod alone [panel (A), STZ + Figolimod], or in combination with MC1R antagonist [panel (B), STZ + Fingolimod + AGRP], MC5R antagonist [panel (B), STZ + Fingolimod + PG20N], and SP1R1 antagonist [panel (B), STZ + FTY720+Ex 26]. VEGFA levels, assayed by ELISA, are reported as pg/ml ± S.D. Statistical significance was assessed by one-way ANOVA, followed by Tukey’s multiple comparison test. *p < 0.05 vs CTR; p < 0.05 vs STZ; p < 0.05 vs STZ + Fingolimod. N = 10 retinas per group.
FIGURE 6
FIGURE 6
Fingolimod stably bound to hMC1R and hMC5R during 20 ns MD simulation. (A) root mean square deviation (RMSD) of hMC1R (blue plot) and fingolimod (red blot) during 20 ns of MD simulation, of the complex embedded in a POPC membrane. (B) RMSD of hMC5R (blue plot) and fingolimod (red blot) during 20 ns of MD simulation, of the complex embedded in a POPC membrane. (C) Fingolimod interactions with hMC1R, and frequency (%) during 20 ns MD simulation. (D) Fingolimod interactions with hMC5R, and frequency (%) during 20 ns MD simulation.
FIGURE 7
FIGURE 7
Fingolimod stabilized hMC1R to lower root mean square fluctuations (RMSF), compared to hMC5R. (A) RMSF of fingolimod-hMC1R (blue) complex and fingolimod-hMC5R (orange) complex as mean of 20 ns simulations. (B) Glu304-Arg307 salt-bridge distance during 20 ns simulation of fingolimod-hMC1R complex. (C) Glu304-Arg307 salt bridge distance during 20 ns simulation of BMS-hMC1R complex. (D) Glu304-Arg307 salt bridge distance during 20 ns simulation of Agrp-hMC1R complex.
FIGURE 8
FIGURE 8
Differences in residue-residues contact maps in hMC1R bound to fingolimod and selective agonist (BMS) and antagonist (AGRP).
FIGURE 9
FIGURE 9
Differences in residue-residues contact maps in hMC5R bound to fingolimod and selective agonist (PG901) and antagonist (PG20N).

References

    1. Aguilar-Cazares D., Chavez-Dominguez R., Carlos-Reyes A., Lopez-Camarillo C., Hernadez de la Cruz O. N., Lopez-Gonzalez J. S. (2019). Contribution of Angiogenesis to Inflammation and Cancer. Front. Oncol. 9, 1399. 10.3389/fonc.2019.01399 - DOI - PMC - PubMed
    1. Bikbova G., Oshitari T., Baba T., Yamamoto S. (2015). Altered Expression of NF- κ B and SP1 after Exposure to Advanced Glycation End-Products and Effects of Neurotrophic Factors in AGEs Exposed Rat Retinas. J. Diabetes Res. 2015, 543818. 10.1155/2015/543818 - DOI - PMC - PubMed
    1. Biswas S., Bhattacherjee P., Paterson C. A., Maruyama T., Narumiya S. (2007). Modulation of Ocular Inflammatory Responses by EP1 Receptors in Mice. Exp. Eye Res. 84, 39–43. 10.1016/j.exer.2006.08.013 - DOI - PubMed
    1. Bonfiglio T., Olivero G., Merega E., Di Prisco S., Padolecchia C., Grilli M., et al. (2017). Prophylactic Versus Therapeutic Fingolimod: Restoration of Presynaptic Defects in Mice Suffering from Experimental Autoimmune Encephalomyelitis. PLoS One 12, e0170825. 10.1371/journal.pone.0170825 - DOI - PMC - PubMed
    1. Bonfiglio V., Platania C. B. M., Lazzara F., Conti F., Pizzo C., Reibaldi M., et al. (2020). TGF-β Serum Levels in Diabetic Retinopathy Patients and the Role of Anti-VEGF Therapy. Int. J. Mol. Sci. 21, 9558. 10.3390/ijms21249558 - DOI - PMC - PubMed

LinkOut - more resources