

Interindividual Variability in Fat Mass Response to a 1-Year Randomized Controlled Trial With Different Exercise Intensities in Type 2 Diabetes: Implications on Glycemic Control and Vascular Function
- PMID: 34603073
- PMCID: PMC8481940
- DOI: 10.3389/fphys.2021.698971
Interindividual Variability in Fat Mass Response to a 1-Year Randomized Controlled Trial With Different Exercise Intensities in Type 2 Diabetes: Implications on Glycemic Control and Vascular Function
Abstract
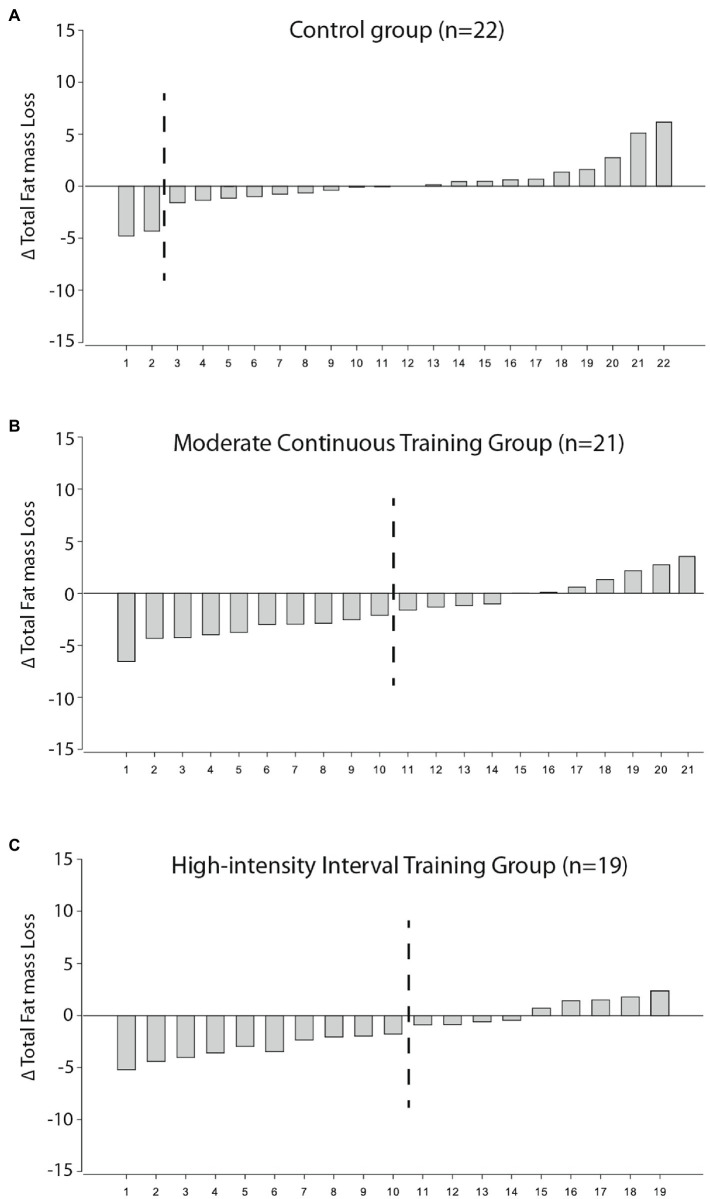
Purpose: Little is known about the interindividual variability in fat mass (FM) loss in response to high-intensity interval training (HIIT) and moderate continuous training (MCT) in individuals with type 2 diabetes mellitus (T2DM). Moreover, the impact on health-related outcomes in those who fail to reduce FM is still unclear. The aims of this investigation were (1) to assess if the individuals with T2DM who FM differed across MCT, HIIT, and control groups over a 1-year intervention and (2) to assess the changes on glycemic control and vascular function in the exercising patients who failed to lose FM. Methods: Adults with T2DM were randomized into a 1-year intervention involving a control group (n=22), MCT with resistance training (RT; n=21), and HIIT with RT (n=19). FM was assessed using dual-energy X-ray absorptiometry and a change in total body FM above the typical error was used to categorize FM responders. Glycemic control and vascular stiffness and structure were assessed. A chi-square test and generalized estimating equations were used to model the outcomes. Results: Both MCT (n=10) and HIIT (n=10) had a similar proportion of individuals who were categorized as high responders for FM, with the percent change in FM on average -5.0±9.6% for the MCT and -6.0±12.1% for the HIIT, which differed from the control group (0.2±7.6%) after a 1-year intervention (p<0.05). A time-by-group interaction for carotid artery intima-media thickness (cIMT) (p for interaction=0.042) and lower-limb pulse wave velocity (LL PWV; p for interaction=0.010) between those categorized as low FM responders and the control group. However, an interaction was observed between the high responders for FM loss and controls for both brachial and carotid hemodynamic indices, as well as in cIMT, carotid distensibility coefficient, carotid beta index, and LL PWV (p for interactions <0.05). No interactions were found for glycaemic indices (p for interaction >0.05). Conclusion: Our results suggest that the number of FM responders did not differ between the MCT or HIIT, compared to the control, following a 1-year exercise intervention in individuals with T2DM. However, low responders to FM may still derive reductions in arterial stiffness and structure. Clinical Trial Registration: Comparing Moderate and High-intensity Interval Training Protocols on Biomarkers in Type 2 Diabetes Patients (D2FIT study) - number: NCT03144505 (https://clinicaltrials.gov/ct2/show/NCT03144505).
Keywords: Carotid artery intima-media thickness; arterial stiffness; exercise intervention; high-intensity interval training; moderate continuous training; peak wave velocity.
Copyright © 2021 Magalhães, Hetherington-Rauth, Júdice, Correia, Rosa, Henriques-Neto, Melo, Silva and Sardinha.
Conflict of interest statement
The authors declare that the research was conducted in the absence of any commercial or financial relationships that could be construed as a potential conflict of interest.
Figures
References
-
- Alvarez C., Ramirez-Campillo R., Ramirez-Velez R., Izquierdo M. (2017). Prevalence of non-responders for glucose control markers after 10 weeks of high-intensity interval training in adult women with higher and lower insulin resistance. Front. Physiol. 8:479. doi: 10.3389/fphys.2017.00479, PMID: - DOI - PMC - PubMed
Associated data
LinkOut - more resources
Full Text Sources
Medical