. 2021 Sep 16:12:696195.
doi: 10.3389/fmicb.2021.696195. eCollection 2021.

Detection of Bioavailable Cadmium by Double-Color Fluorescence Based on a Dual-Sensing Bioreporter System

Affiliations

Detection of Bioavailable Cadmium by Double-Color Fluorescence Based on a Dual-Sensing Bioreporter System

Chang-Ye Hui et al. Front Microbiol. .

Abstract

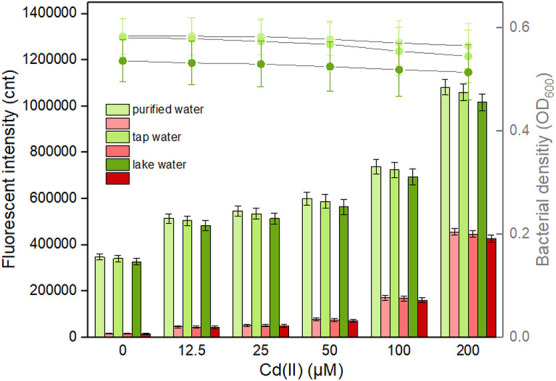
Cadmium (Cd) is carcinogenic to humans and can accumulate in the liver, kidneys, and bones. There is widespread presence of cadmium in the environment as a consequence of anthropogenic activities. It is important to detect cadmium in the environment to prevent further exposure to humans. Previous whole-cell biosensor designs were focused on single-sensing constructs but have had difficulty in distinguishing cadmium from other metal ions such as lead (Pb) and mercury (Hg). We developed a dual-sensing bacterial bioreporter system to detect bioavailable cadmium by employing CadC and CadR as separate metal sensory elements and eGFP and mCherry as fluorescent reporters in one genetic construct. The capability of this dual-sensing biosensor was proved to simultaneously detect bioavailable cadmium and its toxic effects using two sets of sensing systems while still maintaining similar specificity and sensitivity of respective signal-sensing biosensors. The productions of double-color fluorescence were directly proportional to the exposure concentration of cadmium, thereby serving as an effective quantitative biosensor to detect bioavailable cadmium. This novel dual-sensing biosensor was then validated to respond to Cd(II) spiked in environmental water samples. This is the first report of the development of a novel dual-sensing, whole-cell biosensor for simultaneous detection of bioavailable cadmium. The application of two biosensing modules provides versatile biosensing signals and improved performance that can make a significant impact on monitoring high concentration of bioavailable Cd(II) in environmental water to reduce human exposure to the harmful effects of cadmium.

Keywords: CadC; CadR; cadmium detection; fluorescent signal; whole-cell biosensor.


Conflict of interest statement

The authors declare that the research was conducted in the absence of any commercial or financial relationships that could be construed as a potential conflict of interest.

Figures

FIGURE 1
FIGURE 1
Genetic assembly and merger of two independent biosensing modules into one genetic construct for the detection of bioavailable cadmium. The green fluorescent reporter was placed downstream of the cadC promoter and cadC gene (pCadC-G). The red fluorescent reporter was placed under the regulation of the native cadR promoter (pCadR-R). Two independent sensing modules were integrated into one genetic construct (pCadC-G-CadR-R).
FIGURE 2
FIGURE 2
Models for single and double fluorescent indication of cadmium exposure. The apo-form dimeric CadC bound to the cadC promoter represses transcription of the green fluorescent reporter. The binding of Cd(II) causes the conformational change of dimeric CadC, and then, it will dissociate from the cadC promoter to activate the transcription of the green fluorescent reporter (schematic in green box). The dimeric CadR acts as both a transcription repressor (with no cadmium exposure) and an activator (with intracellular cadmium exposure). When the concentration of intracellular Cd(II) increases, dimeric CadR bound to the cadR divergent promoter will activate transcription of the red fluorescent reporter (schematic in red box). With the integration of two independent sensing modules, the resultant biosensor cell can detect Cd(II) with double-color fluorescence output (overlap between the green and red boxes).
FIGURE 3
FIGURE 3
The responses of single-sensing biosensors toward nine different metal ions. After being exposed to 5, 25, and 125 μM concentrations of the specifically labeled metal ions at 37°C for 12 h, both of fluorescent signals were determined. (A) TOP10/pCadC-G. (B) TOP10/pCadR-R. The fluorescent signal was indicated as a fluorescence count value (unit = cnt), and fluorescent values were divided by the optical density at 600 nm. Results are the average of at least three independent experiments performed in triplicate. The data values shown for each metal exposure group were obtained by subtracting the control values (with no metal exposure) from the experimental values.
FIGURE 4
FIGURE 4
Fluorescent signals generated by single-sensing biosensors after exposure to gradient concentrations of Cd(II). After exposure to gradient concentrations of Cd(II) generated from a double dilution method, both fluorescent signals were determined after 12 h of incubation at 37°C. Fluorescence intensity values were normalized using the absorbance at 600 nm. Results are the average of at least three independent experiments performed in triplicate. Detection limit of whole-cell biosensor TOP10/pCadC-G (A). The asterisk indicates a significant increase (two-tailed t-test, P < 0.001) in fluorescent intensity, in comparison to the same biosensor exposed to 0 μM Cd(II). Detection limit of whole-cell biosensor TOP10/pCadR-R (C). The asterisk indicates a significant increase (two-tailed t-test, P < 0.01) in fluorescent intensity, in comparison to the same biosensor exposed to 0 μM Cd(II). Response curves of whole-cell biosensor (B) TOP10/pCadC-G and (D) TOP10/pCadR-R in response to different Cd(II) concentrations. The fluorescent signal was indicated as a fluorescence count value (unit = cnt). The data values shown for each metal exposure group were obtained by subtracting the control values (with no metal exposure) from the experimental values. The typical photographs of engineered bacterial cell cultures induced by the above 50 μM Cd(II) are shown.
FIGURE 5
FIGURE 5
The response of the dual-sensing biosensor toward different metal ions. Double-color fluorescence of whole-cell biosensor TOP10/pCadC-G-CadR-R in the presence of different metal ions was determined after a 12-h incubation at 37°C. Fluorescent values were divided by the optical density at 600 nm. The data values shown for each metal exposure group were obtained by subtracting the control values (with no metal exposure) from the experimental values. Results are the average of at least three independent experiments performed in triplicate.
FIGURE 6
FIGURE 6
Influence of non-responsive metal ions on the response of the dual-sensing biosensor toward Cd(II). Double-color fluorescence derived from TOP10/pCadC-G-CadR-R exposed with 5 μM Cd(II) in the presence of various non-responsive metal ions. After a 12-h incubation at 37°C, bacterial cell density (OD600) was measured (point line diagram, right-Y scale) using a microplate reader, and both eGFP (green bars) and mCherry (red bars) fluorescent intensities were determined using a fluorescence spectrophotometer (bar chart, left-Y scale). The fluorescent signal was indicated as a fluorescence count value (unit = cnt), and fluorescence intensity values were normalized using the absorbance at 600 nm. The data values shown for each metal exposure group were obtained by subtracting the control values (with no metal exposure) from the experimental values. Results are the average of at least three independent experiments performed in triplicate.
FIGURE 7
FIGURE 7
Influence of responsive non-target Pb(II) and Hg(II) on the response of the dual-sensing biosensor toward Cd(II). Double-color fluorescence derived from TOP10/pCadC-G-CadR-R exposed to 5 μM Cd(II) in the presence of increased concentrations of (A) Pb(II) and (B) Hg(II). After a 12-h incubation at 37°C, bacterial cell density was measured (point line diagram, right-Y scale), and both eGFP (green bars) and mCherry (red bars) fluorescence were determined (bar chart, left-Y scale). The fluorescence intensity ratios (eGFP/mCherry) were shown in the tables below the corresponding figures. The fluorescent signal was indicated as a fluorescence count value (unit = cnt), and fluorescence intensity values were normalized using the absorbance at 600 nm. The data values shown for each metal exposure group were obtained by subtracting the control values (with no metal exposure) from the experimental values. Results are the average of at least three independent experiments performed in triplicate.
FIGURE 8
FIGURE 8
Double-color fluorescence generated by the dual-sensing biosensor after exposure to gradient concentrations of Cd(II). Both fluorescent signals were determined after a 12-h incubation with gradient concentrations of Cd(II) at 37°C. The fluorescent signal was indicated as a fluorescence count value (unit = cnt), and fluorescence intensity values were normalized using the absorbance at 600 nm. Results are the average of at least three independent experiments performed in triplicate. (A) Detection limit of the dual-sensing biosensor TOP10/pCadC-G-CadR-R. The asterisk indicates a significant increase (two-tailed t-test, P < 0.001 for eGFP and P < 0.05 for mCherry) in fluorescent intensity, in comparison to the same biosensor exposed to 0 μM Cd(II). (B) Response curves of the dual-sensing biosensor TOP10/pCadC-G-CadR-R in response to different Cd(II) concentrations. The data values shown for each metal exposure group were obtained by subtracting the control values (with no metal exposure) from the experimental values.
FIGURE 9
FIGURE 9
Responses of the dual-sensing biosensor cell toward environmental water samples spiked with different concentrations of Cd(II). Luria-Bertani (LB)-incubated lag-phase cultures of the dual-sensing biosensor TOP10/pCadC-G-CadR-R were exposed to varying concentrations of Cd(II) in the following water samples: purified water, tap water, and lake water. After a 12-h incubation at 37°C, bacterial cell density was measured (point line diagram, right-Y scale), and both eGFP (green bars) and mCherry (red bars) fluorescence were determined (bar chart, left-Y scale). The fluorescent signal was indicated as a fluorescence count value (unit = cnt), and fluorescence intensity values were normalized using the absorbance at 600 nm. The green fluorescent intensity values of TOP10/pCadC-G-CadR-R were obtained by subtracting that of TOP10/pCadC, and the red fluorescent intensity values of TOP10/pCadC-G-CadR-R were obtained by subtracting that of TOP10/pCadR. Results are the average of at least three independent experiments performed in triplicate.
FIGURE 10
FIGURE 10
Fluorescence images of three whole-cell biosensors. (A) The control group, TOP10 harboring the plasmid pCadC-G-CadR-R with no Cd(II) exposure. (B) TOP10 harboring the plasmid pCadC-G with 100 μM Cd(II) exposure. (C) TOP10 harboring the plasmid pCadR-R with 100 μM Cd(II) exposure. (D) TOP10 harboring the plasmid pCadC-G-CadR-R with 100 μM Cd(II) exposure. After a 6-h incubation at 37°C, engineered bacterial cells harboring various biosensor vectors were observed under a fluorescence microscope (×400 magnification). The green fluorescent signal was first detected with a fluorescein isothiocyanate (FITC) filter and then the red fluorescent signal was detected using a Texas Red filter.

Similar articles

Cited by

References

    1. Amaro F., Turkewitz A. P., Martin-Gonzalez A., Gutierrez J. C. (2011). Whole-cell biosensors for detection of heavy metal ions in environmental samples based on metallothionein promoters from Tetrahymena thermophila. Microb. Biotechnol. 4 513–522. 10.1111/j.1751-7915.2011.00252.x - DOI - PMC - PubMed
    1. Bereza-Malcolm L., Aracic S., Kannan R., Mann G., Franks A. E. (2017). Functional characterization of Gram-negative bacteria from different genera as multiplex cadmium biosensors. Biosens Bioelectron. 94 380–387. 10.1016/j.bios.2017.03.029 - DOI - PubMed
    1. Bereza-Malcolm L. T., Mann G., Franks A. E. (2015). Environmental sensing of heavy metals through whole cell microbial biosensors: a synthetic biology approach. ACS Synth. Biol. 4 535–546. 10.1021/sb500286r - DOI - PubMed
    1. Brocklehurst K. R., Hobman J. L., Lawley B., Blank L., Marshall S. J., Brown N. L., et al. (1999). ZntR is a Zn(II)-responsive MerR-like transcriptional regulator of zntA in Escherichia coli. Mol. Microbiol. 31 893–902. 10.1046/j.1365-2958.1999.01229.x - DOI - PubMed
    1. Brocklehurst K. R., Megit S. J., Morby A. P. (2003). Characterisation of CadR from Pseudomonas aeruginosa: a Cd(II)-responsive MerR homologue. Biochem. Biophys. Res. Commun. 308 234–239. 10.1016/s0006-291x(03)01366-4 - DOI - PubMed

LinkOut - more resources