

A Machine Learning Model to Predict the Triple Negative Breast Cancer Immune Subtype
- PMID: 34603338
- PMCID: PMC8484710
- DOI: 10.3389/fimmu.2021.749459
A Machine Learning Model to Predict the Triple Negative Breast Cancer Immune Subtype
Abstract
Background: Immune checkpoint blockade (ICB) has been approved for the treatment of triple-negative breast cancer (TNBC), since it significantly improved the progression-free survival (PFS). However, only about 10% of TNBC patients could achieve the complete response (CR) to ICB because of the low response rate and potential adverse reactions to ICB.
Methods: Open datasets from The Cancer Genome Atlas (TCGA) and Gene Expression Omnibus (GEO) were downloaded to perform an unsupervised clustering analysis to identify the immune subtype according to the expression profiles. The prognosis, enriched pathways, and the ICB indicators were compared between immune subtypes. Afterward, samples from the Molecular Taxonomy of Breast Cancer International Consortium (METABRIC) dataset were used to validate the correlation of immune subtype with prognosis. Data from patients who received ICB were selected to validate the correlation of the immune subtype with ICB response. Machine learning models were used to build a visual web server to predict the immune subtype of TNBC patients requiring ICB.
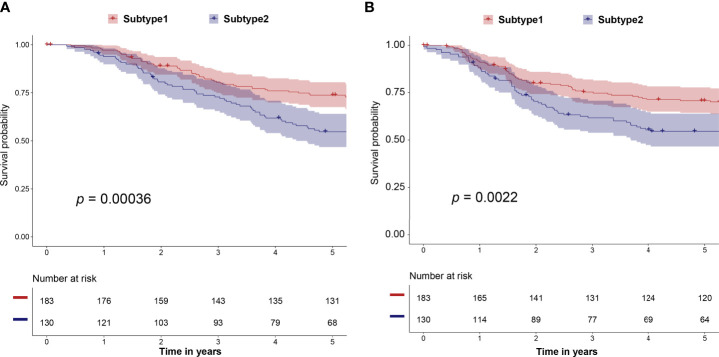
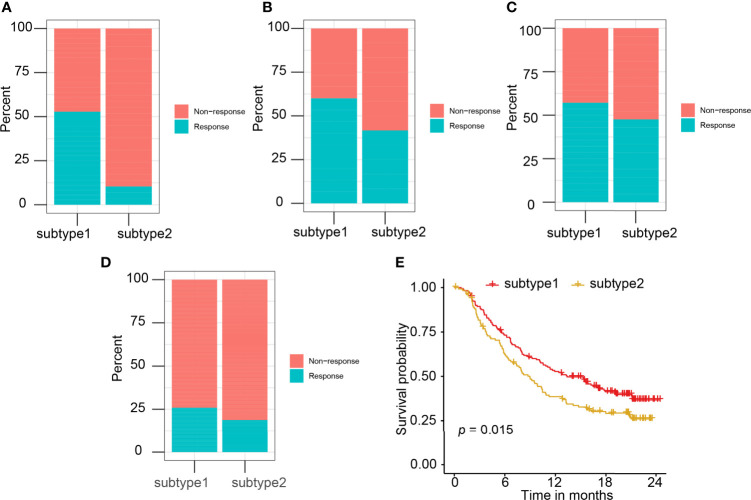
Results: A total of eight open datasets including 931 TNBC samples were used for the unsupervised clustering. Two novel immune subtypes (referred to as S1 and S2) were identified among TNBC patients. Compared with S2, S1 was associated with higher immune scores, higher levels of immune cells, and a better prognosis for immunotherapy. In the validation dataset, subtype 1 samples had a better prognosis than sub type 2 samples, no matter in overall survival (OS) (p = 0.00036) or relapse-free survival (RFS) (p = 0.0022). Bioinformatics analysis identified 11 hub genes (LCK, IL2RG, CD3G, STAT1, CD247, IL2RB, CD3D, IRF1, OAS2, IRF4, and IFNG) related to the immune subtype. A robust machine learning model based on random forest algorithm was established by 11 hub genes, and it performed reasonably well with area Under the Curve of the receiver operating characteristic (AUC) values = 0.76. An open and free web server based on the random forest model, named as triple-negative breast cancer immune subtype (TNBCIS), was developed and is available from https://immunotypes.shinyapps.io/TNBCIS/.
Conclusion: TNBC open datasets allowed us to stratify samples into distinct immunotherapy response subgroups according to gene expression profiles. Based on two novel subtypes, candidates for ICB with a higher response rate and better prognosis could be selected by using the free visual online web server that we designed.
Keywords: TCGA; TNBC (triple negative breast cancer); immune checkpoint blockade; immune subtype; web server.
Copyright © 2021 Chen, Wang, De Wilde, Feng, Su, Torres-de la Roche and Shi.
Conflict of interest statement
The authors declare that the research was conducted in the absence of any commercial or financial relationships that could be construed as a potential conflict of interest.
Figures


Similar articles
-
A novel model associated with tumor microenvironment on predicting prognosis and immunotherapy in triple negative breast cancer.Clin Exp Med. 2023 Nov;23(7):3867-3881. doi: 10.1007/s10238-023-01090-5. Epub 2023 May 23. Clin Exp Med. 2023. PMID: 37219794 Free PMC article.
-
Construction of a stromal cell-related prognostic signature based on a 101-combination machine learning framework for predicting prognosis and immunotherapy response in triple-negative breast cancer.Front Immunol. 2025 May 14;16:1544348. doi: 10.3389/fimmu.2025.1544348. eCollection 2025. Front Immunol. 2025. PMID: 40438115 Free PMC article.
-
A combined hypoxia and immune gene signature for predicting survival and risk stratification in triple-negative breast cancer.Aging (Albany NY). 2021 Aug 2;13(15):19486-19509. doi: 10.18632/aging.203360. Epub 2021 Aug 2. Aging (Albany NY). 2021. PMID: 34341184 Free PMC article.
-
Biomarkers of Immune Checkpoint Blockade Response in Triple-Negative Breast Cancer.Curr Treat Options Oncol. 2021 Mar 20;22(5):38. doi: 10.1007/s11864-021-00833-4. Curr Treat Options Oncol. 2021. PMID: 33743085 Review.
-
Immunotherapy for triple-negative breast cancer: Existing challenges and exciting prospects.Drug Resist Updat. 2017 May;32:1-15. doi: 10.1016/j.drup.2017.07.002. Epub 2017 Aug 19. Drug Resist Updat. 2017. PMID: 29145974 Review.
Cited by
-
Identification of a Two-lncRNA Signature with Prognostic and Diagnostic Value for Hepatocellular Carcinoma.J Oncol. 2022 Jul 21;2022:2687455. doi: 10.1155/2022/2687455. eCollection 2022. J Oncol. 2022. PMID: 36213826 Free PMC article.
-
Artificial intelligence: opportunities and challenges in the clinical applications of triple-negative breast cancer.Br J Cancer. 2023 Jun;128(12):2141-2149. doi: 10.1038/s41416-023-02215-z. Epub 2023 Mar 4. Br J Cancer. 2023. PMID: 36871044 Free PMC article. Review.
-
Machine learning-guided differential gene expression analysis identifies a highly-connected seven-gene cluster in triple-negative breast cancer.Biomedicine (Taipei). 2024 Dec 1;14(4):15-35. doi: 10.37796/2211-8039.1467. eCollection 2024. Biomedicine (Taipei). 2024. PMID: 39777114 Free PMC article.
-
Chemoimmunomodulation in triple negative breast cancer: a key to maximizing anti-PD-1 chemoimmunotherapeutic efficacy.Oncoimmunology. 2025 Dec;14(1):2527303. doi: 10.1080/2162402X.2025.2527303. Epub 2025 Jul 9. Oncoimmunology. 2025. PMID: 40631451 Free PMC article. Review.
-
Patient-specific signaling signatures predict optimal therapeutic combinations for triple negative breast cancer.Mol Cancer. 2024 Jan 16;23(1):17. doi: 10.1186/s12943-023-01921-9. Mol Cancer. 2024. PMID: 38229082 Free PMC article.
References
Publication types
MeSH terms
LinkOut - more resources
Full Text Sources
Research Materials
Miscellaneous