. 2021 Sep 14:12:672702.
doi: 10.3389/fpls.2021.672702. eCollection 2021.

Enzymology and Regulation of δ1-Pyrroline-5-Carboxylate Synthetase 2 From Rice

Affiliations

Enzymology and Regulation of δ1-Pyrroline-5-Carboxylate Synthetase 2 From Rice

Giuseppe Sabbioni et al. Front Plant Sci. .

Abstract

Under several stress conditions, such as excess salt and drought, many plants accumulate proline inside the cell, which is believed to help counteracting the adverse effects of low water potential. This increase mainly relies upon transcriptional induction of δ1-pyrroline-5-carboxylate synthetase (P5CS), the enzyme that catalyzes the first two steps in proline biosynthesis from glutamate. P5CS mediates both the phosphorylation of glutamate and the reduction of γ-glutamylphosphate to glutamate-5-semialdehyde, which spontaneously cyclizes to δ1-pyrroline-5-carboxylate (P5C). In most higher plants, two isoforms of P5CS have been found, one constitutively expressed to satisfy proline demand for protein synthesis, the other stress-induced. Despite the number of papers to investigate the regulation of P5CS at the transcriptional level, to date, the properties of the enzyme have been only poorly studied. As a consequence, the descriptions of post-translational regulatory mechanisms have largely been limited to feedback-inhibition by proline. Here, we report cloning and heterologous expression of P5CS2 from Oryza sativa. The protein has been fully characterized from a functional point of view, using an assay method that allows following the physiological reaction of the enzyme. Kinetic analyses show that the activity is subjected to a wide array of regulatory mechanisms, ranging from product inhibition to feedback inhibition by proline and other amino acids. These findings confirm long-hypothesized influences of both, the redox status of the cell and nitrogen availability, on proline biosynthesis.

Keywords: NADPH/NADP+ ratio; enzyme regulation; product inhibition; proline biosynthesis; redox status; substrate affinity.


Conflict of interest statement

The authors declare that the research was conducted in the absence of any commercial or financial relationships that could be construed as a potential conflict of interest.

Figures

Figure 1
Figure 1
Expression of rice P5CS2 in Escherichia coli. Following the treatment with IPTG, extracts were prepared from bacterial cells transformed with the vector pET151-OsP5CS2. The measurement of NADPH oxidation in extracts prepared 4h after induction showed the presence of a significant rate that was not evident neither in the absence of glutamate nor in extracts from non-induced cells. SDS-PAGE analysis of total protein from the same cultures, harvested at increasing time as indicated, disclosed the appearance of a new band (⇦) with a relative molecular mass (80kDa) that was compatible with that expected for the recombinant protein (A). When the time-course of the glutamate-dependent NADPH oxidation was measured, the attainment of maximal specific activity values was found 4–5h after induction (⇩); thereafter, activity levels decreased progressively with time. Data are mean±SE over triplicates. SDS-PAGE analysis of parallel samples, shown as insets, revealed a similar pattern for the 80kDa band among soluble proteins; on the contrary, once the maximal levels was reached, it remains subsequently constant among total proteins (B). Inclusion bodies were isolated by differential centrifugation from extracts from induced E. coli cells, and treated with increasing concentration of urea. SDS-PAGE analysis of the supernatant of the samples in this way obtained showed quantitative solubilization of the 80kDa band at urea levels exceeding 4M. Affinity chromatography in the presence of 6M urea allowed the recovery of substantial levels of this protein, which eluted from the Ni++-agarose column at 100mM imidazole. The number of the lanes in the lower gel refers to the fraction of the eluate that was analyzed; nI, inclusion bodies from non-induced cells; I, induced cells; and MM, molecular weight markers (C). Cell-free extracts were prepared from bacterial cells harvested 4h after IPTG treatment, and extracts were loaded onto a Ni++-agarose column. Proteins were then eluted by a stepwise imidazole gradient, and fractions were analyzed by SDS-PAGE. The samples eluted with 500mM imidazole contained a single, homogeneous band with a relative molecular mass of about 80kDa. Also in this case, numbers of the lanes in the gel refer to the fractions of the eluate that were analyzed; E, extract; MM, molecular weight markers (D). All experiments were repeated three times on independent samples (biological replications), and very similar results were obtained.
Figure 2
Figure 2
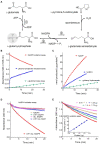
Activity of recombinant rice P5C synthetase 2. (A) shows the reaction catalyzed by the enzyme: following glutamate phosphorylation and ADP release, glutamyl-phosphate is reduced using NADPH as the electron donor, yielding glutamate semialdehyde that spontaneously cyclizes to P5C. Three assay methods have been described: the glutamate kinase assay, which measures the formation of γ-glutamyl-hydroxamate in the absence of NADPH (①); the glutamyl-phosphate reductase assay, which follows the reverse, P5C- and Pi-dependent reduction of NADP+ in the absence of glutamate (③); the NADPH oxidation assay in the presence of all three substrate, thereby following the full forward, physiological reaction of the enzyme (①+②). The purified protein was assayed with these three methods using aliquots corresponding to 2, 2, and 1μg protein, respectively (B). To obtain a quantitative comparison of the three methods, data in (A) were used to calculate the absolute amounts of the product formed in each case per μg of protein (C). The NADPH oxidation assay was performed by incubating 1μg of the purified protein with 0.4mM NADPH in the presence of an array of all possible combinations of the other substrates. A mixture containing ATP and NADH instead of NADPH was also included. Non-limiting levels of all three substrates were required to maintain the rate of NADPH oxidation over time (D). Because an initial burst of NADPH consumption was evident also in the absence of ATP and glutamate, the activity of increasing amounts of protein was measured against exact blanks in which glutamate had been omitted (E). The inset shows that in this case activity values, calculated by interpolation of the linear rate of NADPH oxidation, were strictly proportional to the amount of the enzyme. In all cases, results are means±SE over three technical replications. Each experiment was repeated three times with different enzyme preparations, obtaining very similar patterns.
Figure 3
Figure 3
Substrate affinity and catalytic properties of rice P5C synthetase 2. Enzyme activity was measured by the NADPH oxidation assay at varying the concentration of glutamate (A), ATP (B), or NADPH (C) while maintaining the fixed concentrations of the other substrates (20mM glutamate, 4mM ATP, and 0.4mM NADPH). Lineweaver-Burk plots of data (the inset in each panel) allowed calculation of apparent affinities and Vmax values (Table 1). Presented results are means±SE over three technical replicates. The experiments were repeated three times with different enzyme preparations, obtaining very similar values. In panel (B), the solid line refers to non-linear interpolation obtained by considering ATP concentrations up to 4mM, whereas the dashed line is that obtained by considering all the experimental values using a substrate inhibition model. To gain information on the reaction mechanism of this multisubstrate enzyme, a combined Lineweaver-Burk graph was plotted (D).
Figure 4
Figure 4
Effect of reaction products and related amino acids on the activity of rice P5C synthetase 2. The activity of the purified protein was assayed in the presence of increasing concentrations of the final product of the pathway, L-proline, and its 4C (A2CA) and 6C (pipecolic acid) analogues (A); of the D-isomer and other natural and synthetic analogues of proline (B); of the four enzyme products (C); of some amino acids that are metabolically interconnected with proline, or represent a cellular index of nitrogen availability (D). Results were expressed as per cent of mean values in untreated controls. Presented data are means±SE over three technical replicates. Each experiment was repeated three times with different enzyme preparations, and virtually identical patterns were obtained. Ornithine and arginine were added as hydrochlorides. To rule out the possibility that effects may depend on a consequent change in pH and not to the added substances, the actual pH in each sample was measured with a microelectrode at the end of the incubation. Non-linear regression of data (log[inhibitor] vs. normalized response – variable slope) was performed using GraphPad Prism; IC50 values and their confidence intervals are reported in Table 2.
Figure 5
Figure 5
Effect of anions and cations on the activity of rice P5C synthetase 2. The steady state rate of the enzyme was measured in the presence or in the absence of increasing concentrations of chlorides of various cations (A) or the sodium salts of various anions (B), ranging from 0.3mM to 1M. To minimize ion presence in the assay mixture, in the former case, Tris-HCl buffer was replaced with 10mM potassium phosphate buffer, pH 7.5, whereas in the latter case, its concentration was lowered to 10mM. The actual pH in each sample was measured with a microelectrode at the end of the incubation, to ensure that the addition of salts did not cause a pH change in the reaction mixture. Activity was expressed as per cent of mean value in untreated controls. Data are means±SE over three technical replicates. The experiments were repeated three times with different enzyme preparations, and almost identical patterns were obtained. To calculate the concentration of Mg++ ions able to inhibit activity by 50%, data were expressed with respect to parallel samples containing equimolar amounts of NaCl, to compensate the stimulatory effect of chlorides in the range 10–200mM.

Similar articles

Cited by

References

    1. Ahanger M. A., Akram N. A., Ashraf M., Alyemeni M. N., Wijaya L., Ahmad P. (2017). Plant responses to environmental stresses-from gene to biotechnology. AoB Plants 9:plx025. doi: 10.1093/aobpla/plx025, PMID: - DOI - PMC - PubMed
    1. Ann-Brittedfast T. N., Ericsson A., Nordén L.-G. (1994). Accumulation of amino acids in some boreal forest plants in response to increased nitrogen availability. New Phytol. 126, 137–143. doi: 10.1111/j.1469-8137.1994.tb07539.x - DOI
    1. Annunziata M. G., Ciarmiello L. F., Woodrow P., Dell'Aversana E., Carillo P. (2019). Spatial and temporal profile of glycine betaine accumulation in plants under abiotic stresses. Front. Plant Sci. 10:230. doi: 10.3389/fpls.2019.00230, PMID: - DOI - PMC - PubMed
    1. Anwar A., She M., Wang K., Riaz B., Ye X. (2018). Biological roles of ornithine aminotransferase (OAT) in plant stress tolerance: present progress and future perspectives. Int. J. Mol. Sci. 19:3681. doi: 10.3390/ijms19113681, PMID: - DOI - PMC - PubMed
    1. Baxter C. J., Redestig H., Schauer N., Repsilber D., Patil K. R., Nielsen J., et al. . (2007). The metabolic response of heterotrophic Arabidopsis cells to oxidative stress. Plant Physiol. 143, 312–325. doi: 10.1104/pp.106.090431, PMID: - DOI - PMC - PubMed