. 2021 Sep 16:12:724517.
doi: 10.3389/fpls.2021.724517. eCollection 2021.

A Systematic Narration of Some Key Concepts and Procedures in Plant Breeding

Affiliations

A Systematic Narration of Some Key Concepts and Procedures in Plant Breeding

Weikai Yan. Front Plant Sci. .

Abstract

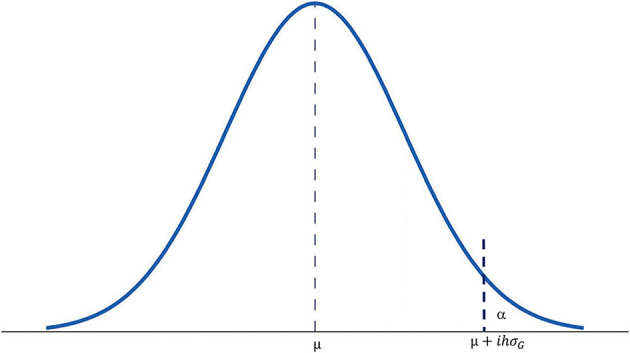
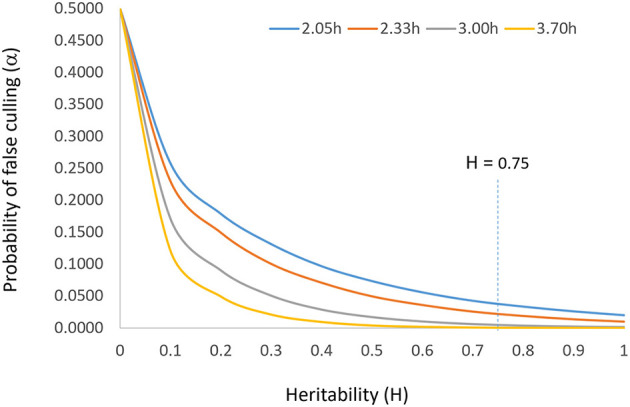
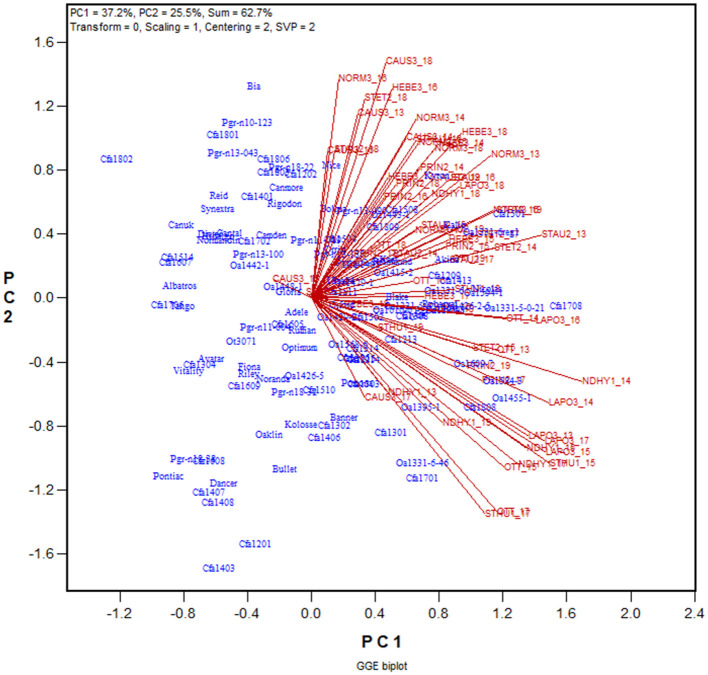
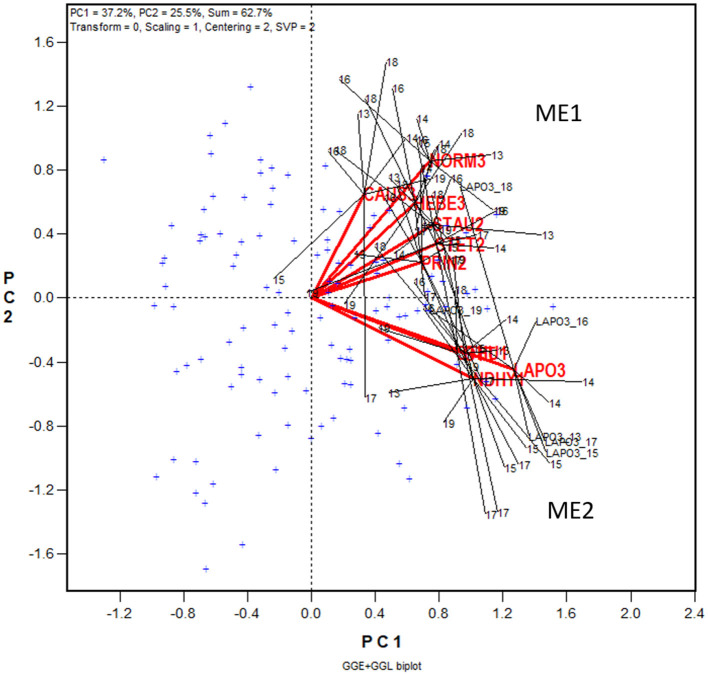
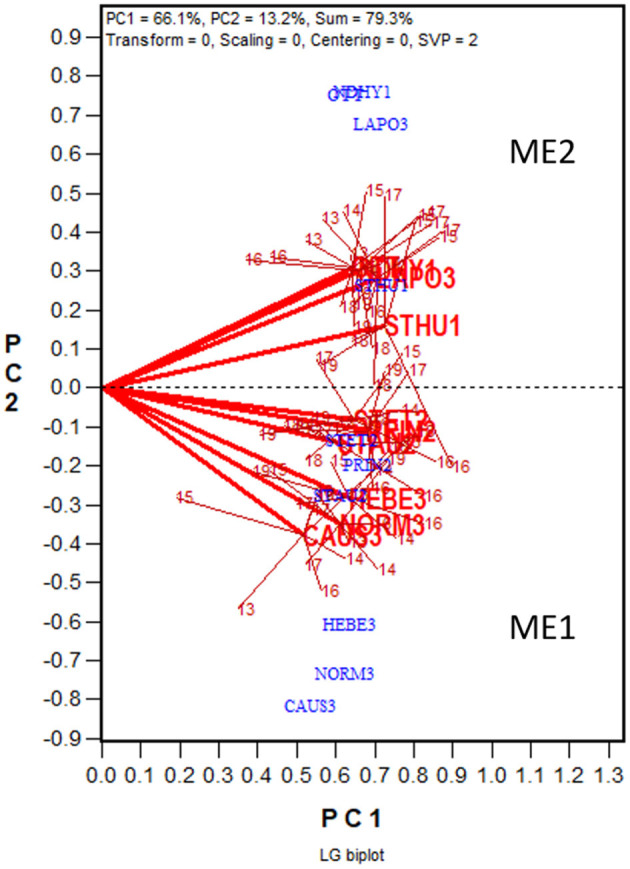
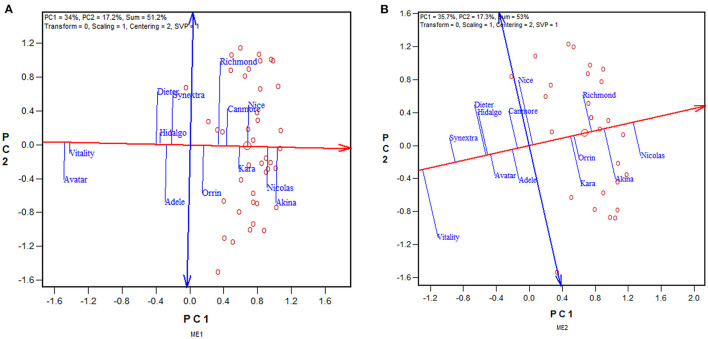
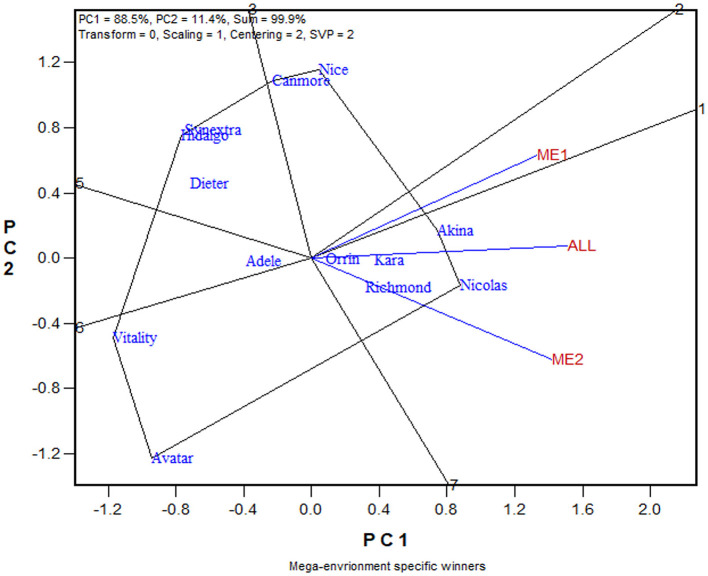
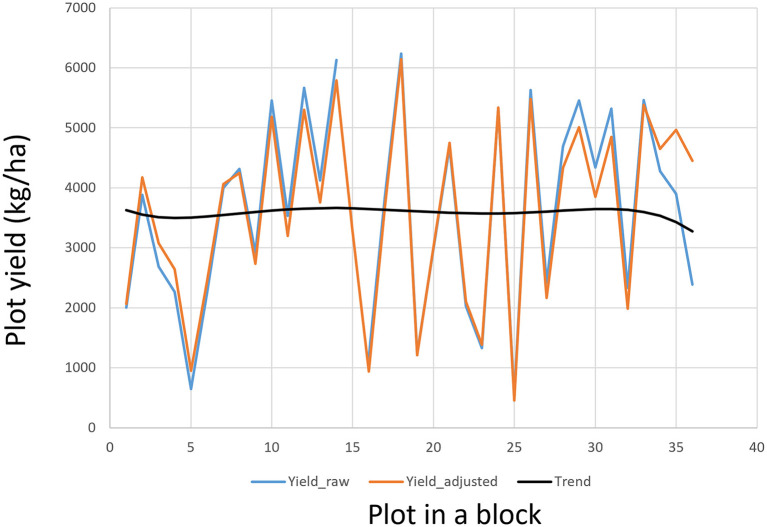
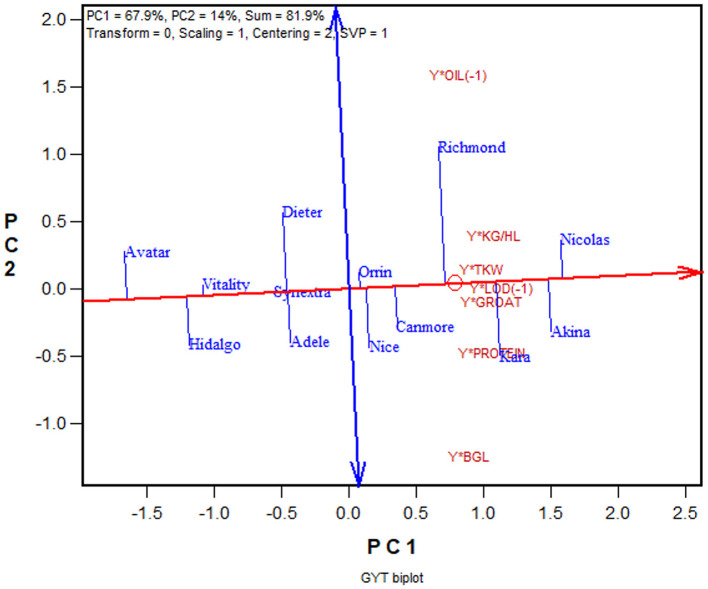
The goal of a plant breeding program is to develop new cultivars of a crop kind with improved yield and quality for a target region and end-use. Improved yield across locations and years means better adaptation to the climatic, soil, and management conditions in the target region. Improved or maintained quality renders and adds value to the improved yield. Both yield and quality must be considered simultaneously, which constitutes the greatest challenge to successful cultivar development. Cultivar development consists of two stages: the development of a promising breeding population and the selection of the best genotypes out of it. A complete breeder's equation was presented to cover both stages, which consists of three key parameters for a trait of interest: the population mean (μ), the population variability (σ G ), and the achieved heritability (h 2 or H), under the multi-location, multi-year framework. Population development is to maximize μσ G and progeny selection is to improve H. Approaches to improve H include identifying and utilizing repeatable genotype by environment interaction (GE) through mega-environment analysis, accommodating unrepeatable GE through adequate testing, and reducing experimental error via replication and spatial analysis. Related concepts and procedures were critically reviewed, including GGE (genotypic main effect plus genotype by environment interaction) biplot analysis, GGE + GGL (genotypic main effect plus genotype by location interaction) biplot analysis, LG (location-grouping) biplot analysis, stability analysis, spatial analysis, adequate testing, and optimum replication. Selection on multiple traits includes independent culling and index selection, for the latter GYT (genotype by yield*trait) biplot analysis was recommended. Genomic selection may provide an alternative and potentially more effective approach in all these aspects. Efforts were made to organize and comment on these concepts and procedures in a systematic manner.

Keywords: biplot analysis; breeder's equation; genotype by environment interaction; heritability; mega-environment analysis; multi-trait selection; optimum replication; optimum testing.


Conflict of interest statement

The author declares that the research was conducted in the absence of any commercial or financial relationships that could be construed as a potential conflict of interest.

Figures

Figure 1
Figure 1
A chart of normal distribution to show the relationships among various parameters in the Complete Breeder's Equation. μ is the mean of the breeding population; σG is the square root of the genotypic variance of the population; i is the artificially set selection intensity in the unit of σG; h is the square root of achieved heritability (h2 or H); α is the portion of the population to be selected; it is also the probability that the best genotypes are not included in the selected portion.
Figure 2
Figure 2
The relationship between heritability (H or h2) and probability of false culling (α) at four levels of selection intensity (i). It is suggested that the probability of false culling that can be tolerated be set according to the population size (n) such that α = 1/n; i can then be determined by α by consulting the normal distribution table. The vertical line of H = 0.75 indicates the target heritability to be achieved for reliable selection.
Figure 3
Figure 3
GGE biplot to show the relative yield of 116 oat genotypes in 67 trials from the 2013–2019 Quebec provincial oat trials. The genotypes are displayed in blue and the trials in red. Each trial is displayed as a location-year combination. The Quebec locations are: NDHY1 (St Hyacinthus) and STHU1 (St. Huber) in Zone 1, PINT2 (Pintendre), PRIN2 (Princeville), STAU2 (St. Augusta), and STET2 (St. Etienne) in Zone 2, and NORM3 (Normandin), CAUS3 (Causapscal), HEBE3 (Hebertville), and LAPO3 (La Pocatière) in Zone 3. OTT (Ottawa) is a location in Ontario. PC1 and PC2 are the first two principal components from singular value decomposition of the trial-standardized yield data (“Scaling = 1,” “Centering = 2”), with the singular values fully partitioned to the trial scores (“SVP = 2”) for proper visualization of the correlations among trials.
Figure 4
Figure 4
GGE + GGL biplot modified from Figure 3 to show two groups of locations or oat mega-environments (ME) in Quebec. Mega-environment 1 (ME1) consists of Zone 2 and Zone 3 locations PINT2, PRIN2, STAU2, STET2, CAUS3, HEBE3, and NORM3, and mega-environment 2 (ME2) includes locations NDHY1, STHU1, LAPO3, and OTT. The trials conducted at each location are presented as a cluster of trials, with the location name placed at the center and the individual trials, indicated by the last two digits of the year, placed around it, and the trials are connected to the center with straight lines. Two locations are regarded as belonging to the same mega-environment if their clusters overlap; they are regarded as belonging to different mega-environments otherwise. The variation in the placement of the locations between mega-environments represents repeatable GE and the variation in the placement of the trials within mega-environments represents unrepeatable GE. The genotypes are displayed as “+” in blue for clarity.
Figure 5
Figure 5
LG biplot to show two oat mega-environments in Quebec. PC1 and PC2 are the first two principal components from singular value decomposition of the location by trial two-way table of correlations, without centering (“Centering = 0”) or scaling (“Scaling = 0”). The LG biplot is a location by trial biplot, with the locations presented in blue and the trials in red. The trials conducted at each location are presented as a cluster of trials, with the location name placed at the center and the individual trials, indicated by the last two digits of the year, placed around it. The trials are connected to the location with straight lines. Two locations are regarded as belonging to the same mega-environment (ME) if their clusters overlap; they are regarded as belonging to different mega-environments otherwise. The same two MEs (ME1 and ME2) shown in Figure 4 are shown in this LG biplot. The variation in the placement of the locations between mega-environments represents repeatable GE and the variation in the placement of the trials within mega-environments represents unrepeatable GE.
Figure 6
Figure 6
GGE biplots to show the mean yield and instability of 13 oat cultivars in (A) mega-environment 1 (ME1) and (B) mega-environment 2 (ME2), across 2013–2019. See Figure 4 and associated text for the definitions of ME1 and ME2. PC1 and PC2 are the first two principal components from singular value decomposition of trial-standardized yield data (“Centering = 2,” “Scaling = 1”). The singular values were entirely partitioned to the genotypic scores (“SVP = 1”) for proper genotype evaluation. The trials are represented by “o” for clarity. The red line with a single arrow is the average environment axis (AEA), the arrow pointing to higher mean yield. The blue line with arrows on both ends is the instability axis, the arrows pointing to greater instability in either direction.
Figure 7
Figure 7
The which-won-where view of the GGE biplot to show the relative yield of 13 oat cultivars in mega-environment 1 (ME1), mega-environment 2 (ME2), and the undivided Quebec oat growing regions (ALL). The polygon was formed by connecting the genotypes that are placed away from the biplot origin in all directions. For each polygon side a line perpendicular to it was drawn from the biplot origin. These lines dissect the biplot into sectors. For each sector, the genotype at the vertex is the nominal highest yielder for the environments or mega-environments fell in it. In this case, Akina was the highest yielder in ME1 while Nicolas was the highest yielder in both ME2 and “ALL.”
Figure 8
Figure 8
An example to show the plot values within a block as adjusted according to the field trend modeled by a polynomial regression.
Figure 9
Figure 9
GYT biplot to display the yield-trait combinations of 13 oat cultivars tested in the 2013–2019 Quebec provincial oat trials. The biplot was based on singular value decomposition of yield-trait combination standardized data (“Centering = 2, Scaling = 1”). The red line with a single arrow is the average yield-trait axis, the arrow pointing to higher GYT index. The blue line with arrows on both ends indicate contrasting trait profiles of the genotypes. For example, it showed Richmond to be strong yield-oil combination but weak in yield-β-glucan combination, while Kara had the opposite trait profile to that of Richmond.

Similar articles

Cited by

References

    1. Alwala S., Kwolek T., McPherson M., Pellow J., Meyer D. (2010). A comprehensive comparison between Eberhart and Russell joint regression and GGE biplot analyses to identify stable and high yielding maize hybrids. Field Crops Res. 119, 225–230. 10.1016/j.fcr.2010.07.010 - DOI
    1. Amira J. O., Ojo D. K., Ariyo O. J., Oduwaye O. A., Ayo-Vaughan M. A. (2013). Relative discriminating powers of GGE and AMMI models in the selection of tropical soybean genotypes. Afr. Crop Sci. J. 21, 67–73.
    1. Annicchiarico P. (2021). Breeding gain from exploitation of regional adaptation: an Alfalfa case study. Crop Sci. 61, 2254–2271. 10.1002/csc2.20423 - DOI
    1. Arief V. N., DeLacy I. H., Crossa J., Payne T., Singh R., Braun H. J., et al. . (2015). Evaluating testing strategies for plant breeding field trials: redesigning a CIMMYT international wheat nursery. Crop Sci. 55, 164–177. 10.2135/cropsci2014.06.0415 - DOI
    1. Asins M. J. (2002). Present and future of quantitative trait locus analysis in plant breeding. Plant Breed. 121, 281–291. 10.1046/j.1439-0523.2002.730285.x - DOI - PubMed

Publication types