. 2021 Sep 17:12:708275.
doi: 10.3389/fgene.2021.708275. eCollection 2021.

Integrative Analyses of Genes Associated With Right Ventricular Cardiomyopathy Induced by Tricuspid Regurgitation

Affiliations

Integrative Analyses of Genes Associated With Right Ventricular Cardiomyopathy Induced by Tricuspid Regurgitation

Chengnan Tian et al. Front Genet. .

Abstract

Tricuspid regurgitation (TR) induces right ventricular cardiomyopathy, a common heart disease, and eventually leads to severe heart failure and serious clinical complications. Accumulating evidence shows that long non-coding RNAs (lncRNAs) are involved in the pathological process of a variety of cardiovascular diseases. However, the regulatory mechanisms and functional roles of RNA interactions in TR-induced right ventricular cardiomyopathy are still unclear. Accordingly, we performed integrative analyses of genes associated with right ventricular cardiomyopathy induced by TR to study the roles of lncRNAs in the pathogenesis of this disease. In this study, we used high-throughput sequencing data of tissue samples from nine clinical cases of right ventricular myocardial cardiomyopathy induced by TR and nine controls with normal right ventricular myocardium from the Genotype-Tissue Expression database. We identified differentially expressed lncRNAs and constructed a protein-protein interaction and lncRNA-messenger RNA (mRNA) co-expression network. Furthermore, we determined hub lncRNA-mRNA modules related to right ventricular myocardial disease induced by TR and constructed a competitive endogenous RNA network for TR-induced right ventricular myocardial disease by integrating the interaction of lncRNA-miRNA-mRNA. In addition, we analyzed the immune infiltration using integrated data and the correlation of each immune-related gene with key genes of the integrated expression matrix. The present study identified 648 differentially expressed mRNAs, 201 differentially expressed miRNAs, and 163 differentially expressed lncRNAs. Protein-protein interaction network analysis confirmed that ADRA1A, AVPR1B, OPN4, IL-1B, IL-1A, CXCL4, ADCY2, CXCL12, GNB4, CCL20, CXCL8, and CXCL1 were hub genes. CTD-2314B22.3, hsa-miR-653-5p, and KIF17ceRNA; SRGAP3-AS2, hsa-miR-539-5p, and SHANK1; CERS6-AS1, hsa-miR-497-5p, and OPN4; INTS6-AS1, hsa-miR-4262, and NEURL1B; TTN-AS1, hsa-miR-376b-3p, and TRPM5; and DLX6-AS1, hsa-miR-346, and BIRC7 axes were obtained by constructing the ceRNA networks. Through the immune infiltration analysis, we found that the proportion of CD4 and CD8 T cells was about 20%, and the proportion of fibroblasts and endothelial cells was high. Our findings provide some insights into the mechanisms of RNA interaction in TR-induced right ventricular cardiomyopathy and suggest that lncRNAs are a potential therapeutic target for treating right ventricular myocardial disease induced by TR.

Keywords: immune cell infiltration; lncrna-mRNA co-expression network; long non-coding RNAs; right ventricular cardiomyopathy; tricuspid regurgitation.


Conflict of interest statement

The authors declare that the research was conducted in the absence of any commercial or financial relationships that could be construed as a potential conflict of interest.

Figures

FIGURE 1
FIGURE 1
Differential micro RNA (miRNA)-long non-coding RNA (lncRNA)-messenger RNA (mRNA) group analysis. Integrated data for miRNA-lncRNA-mRNA differential analysis show the results in a volcano plot and heat map (Figures 1A–F); the miRNA-lncRNA-mRNA differential heat map shows the results (Figures 1A, C, E); the miRNA-lncRNA-mRNA differential volcano plot shows the results (Figures 1B, D, F).
FIGURE 2
FIGURE 2
Gene ontology (GO)/Kyoto Encyclopedia of Genes and Genomes (KEGG) pathway enrichment of differential messenger RNA in the dataset. GO pathway enrichment analysis results for differential genes (Figures 2A, D); KEGG pathway enrichment results (Figures 2B,E), REACTOME pathway enrichment results (Figures 2C, F); differential genes with logFC > -1.5 (Figures 2A–C); differential genes with logFC < −1.5 differential genes (Figures 2D–F).
FIGURE 3
FIGURE 3
Gene ontology (GO)/Kyoto Encyclopedia of Genes and Genomes (KEGG) pathway enrichment analysis and visualization of messenger RNAs after intersection of micro RNA target genes. Visualization of GO pathway enrichment analysis results for differential target predicted crossover genes (Figures 3A, D); visualization of KEGG pathway enrichment results (Figures 3B, E); visualization of REACTOME pathway enrichment results (Figures 3C, F); differential target predicted crossover genes with logFC > −1.5 (Figures 3A–C); differential genes with logFC < −1.5 (Figures 3D–F).
FIGURE 4
FIGURE 4
Gene set enrichment analysis (GSEA) enrichment analysis based on integrated expression matrix and grouping. Based on the integrated expression matrix, the samples were divided into cardiomyopathy and normal groups, and then the GSEA enrichment analysis was performed after grouping; the pathways that were positively associated with cardiomyopathy are mainly enriched (Figure 4A); the pathways that were negatively associated with cardiomyopathy are mainly enriched (Figure 4B).
FIGURE 5
FIGURE 5
Differential genes and up- and down-regulated messenger RNAs after intersection constructed for protein-protein interaction-HUB analysis. Differentially up-regulated, differentially down-regulated, differentially up-regulated after intersection, differentially down-regulated after intersection gene (Figures 5A–H); differentially up-regulated hub gene (Figures 5A, B); differentially down-regulated key hub gene (Figures 5C, D); differentially up-regulated after intersection hub gene (Figures 5E, F); differentially down-regulated hub gene after intersection (Figures 5G, H).
FIGURE 6
FIGURE 6
Gene set enrichment analysis (GSEA) enrichment analysis based on the hub gene. GSEA enrichment analysis was performed based on differentially down-regulated hub genes (Figure 6A), and GSEA enrichment analysis was performed based on differentially up-regulated hub genes (Figure 6B). GSEA enrichment analysis was performed on hub genes that were down-regulated after the intersection of miRNA target genes and differential genes (Figure 6C), and GSEA enrichment analysis was performed on the hub genes that were up-regulated after the intersection of miRNA target genes and differential genes (Figure 6D).
FIGURE 7
FIGURE 7
Construction of competing endogenous RNA network interactions based on differential micro RNA (miRNA)-messenger RNA (mRNA), long non-coding RNA (lncRNA)-miRNA, and long non-coding RNA-messenger RNA. The results of miRNA prediction combined with mRNA for network interaction analysis (Figures 7A–D); the results of lncRNA-miRNA-mRNA network interactions are shown (Figure 7E); the intersection results of predicted mRNA, miRNA with differential miRNA, and mRNA, respectively (Figures 7F, G). The key miRNA-mRNAs were screened for downstream pathway analysis and prediction (Figure 7H).
FIGURE 8
FIGURE 8
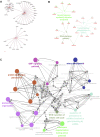
Pathway enrichment analysis of long non-coding RNA-micro RNA (miRNA)-messenger RNA (mRNA)-Kyoto Encyclopedia of Genes and Genomes/gene ontology pathway. Combining the above predicted mRNA-miRNA prediction results, the miRNAs and mRNAs with key predicted interactions were enriched for miRNA and mRNA functions using ClueGO and Cluepedia (Figures 8A–C).
FIGURE 9
FIGURE 9
Immune infiltration analysis of integrated data and correlation of hub genes with immune cells. The results of immune infiltration evaluation of the integrated samples (Figure 9A). Evaluation of the correlation between each immune cell and key hub gene (Figure 9B). Correlation coefficients of the proportion of immune cells infiltrating the samples in the disease group (Figure 9C).

Similar articles

Cited by

References

    1. Agarwal V., Bell G. W., Nam J. W., Bartel D. P. (2015). Predicting Effective microRNA Target Sites in Mammalian mRNAs. Elife 4, e05005. 10.7554/eLife.05005 - DOI - PMC - PubMed
    1. Alexanian M., Ounzain S. (2020). Long Noncoding RNAs in Cardiac Development. Cold Spring Harb Perspect. Biol. 12 (11), a037374. 10.1101/cshperspect.a037374 - DOI - PMC - PubMed
    1. Ali H., Braga L., Giacca M. (2020). Cardiac Regeneration and Remodelling of the Cardiomyocyte Cytoarchitecture. FEBS J. 287 (3), 417–438. 10.1111/febs.15146 - DOI - PubMed
    1. Bindea G., Galon J., Mlecnik B. (2013a). CluePedia Cytoscape Plugin: Pathway Insights Using Integrated Experimental and In Silico Data. Bioinformatics 29 (5), 661–663. 10.1093/bioinformatics/btt019 - DOI - PMC - PubMed
    1. Bindea G., Mlecnik B., Hackl H., Charoentong P., Tosolini M., Kirilovsky A., et al. (2009). ClueGO: a Cytoscape Plug-In to Decipher Functionally Grouped Gene Ontology and Pathway Annotation Networks. Bioinformatics 25 (8), 1091–1093. 10.1093/bioinformatics/btp101 - DOI - PMC - PubMed