

Identification of Transcription Factor-Related Gene Signature and Risk Score Model for Colon Adenocarcinoma
- PMID: 34603375
- PMCID: PMC8485095
- DOI: 10.3389/fgene.2021.709133
Identification of Transcription Factor-Related Gene Signature and Risk Score Model for Colon Adenocarcinoma
Abstract
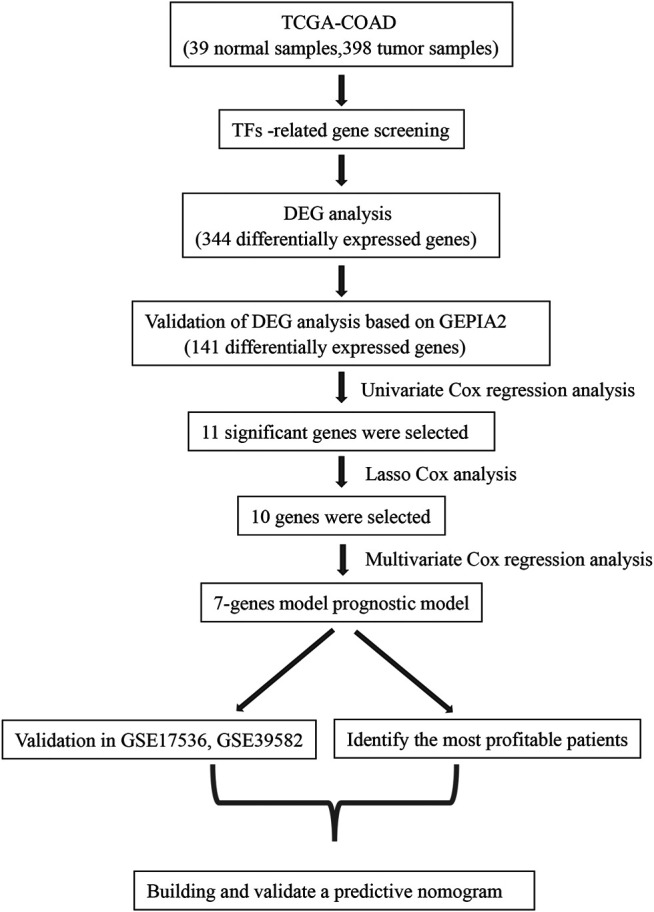
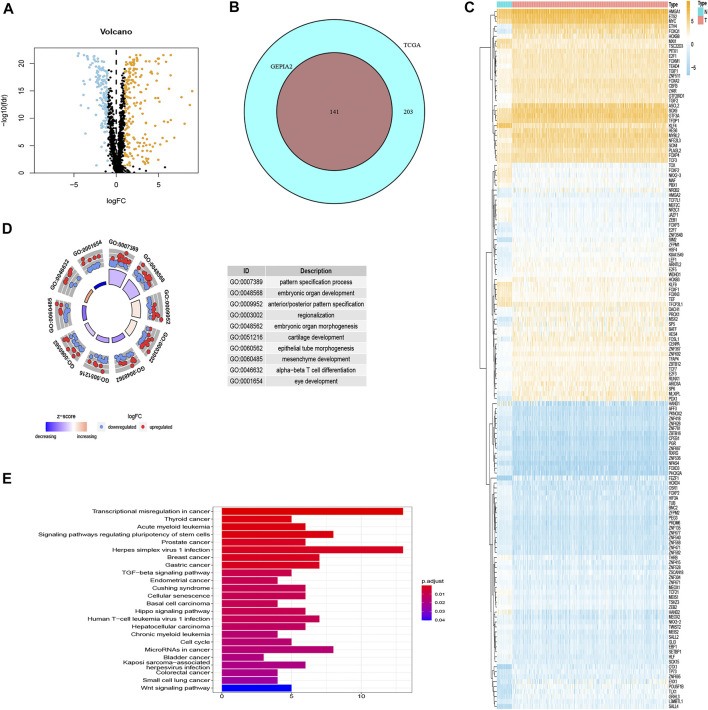
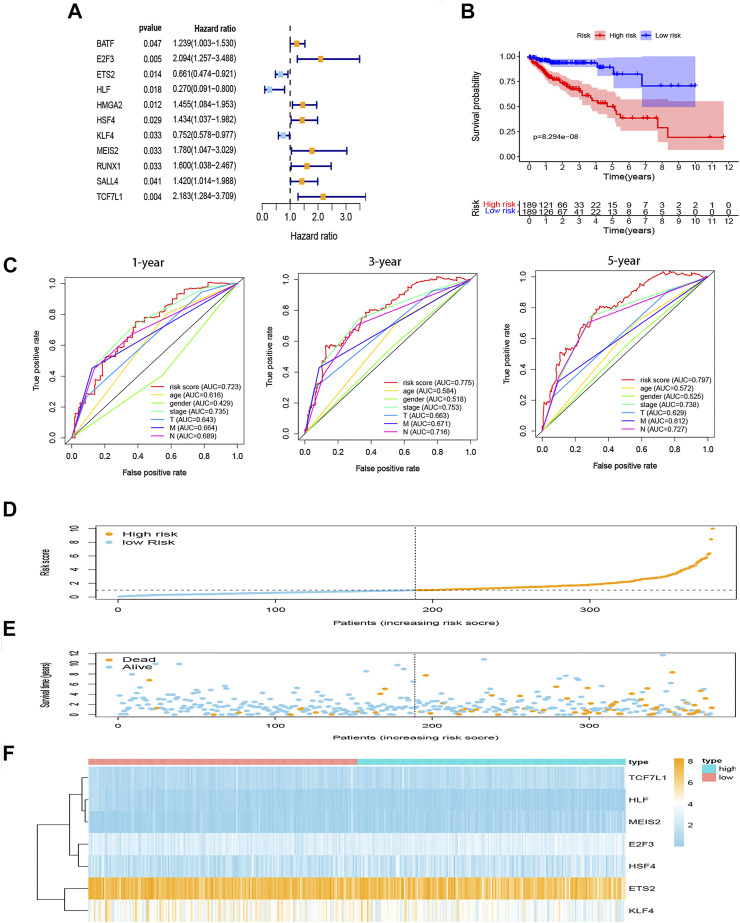
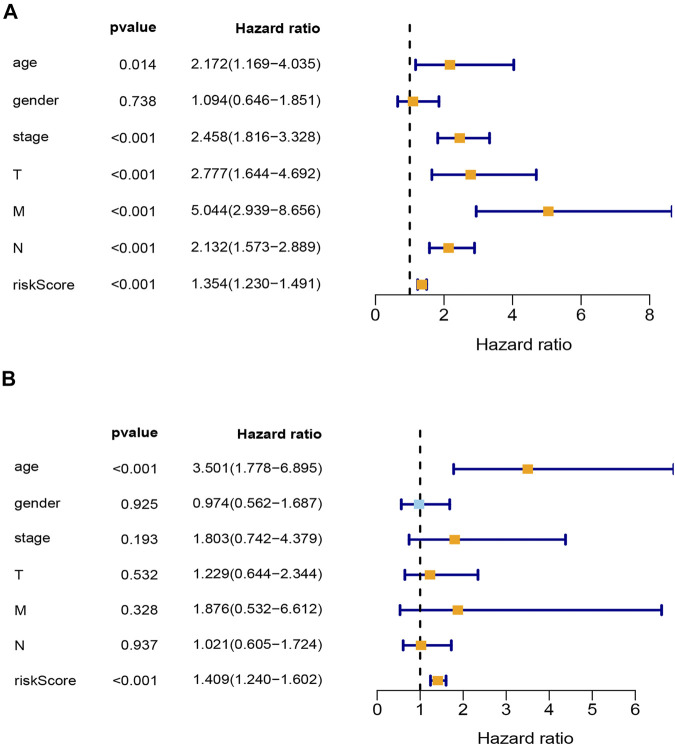
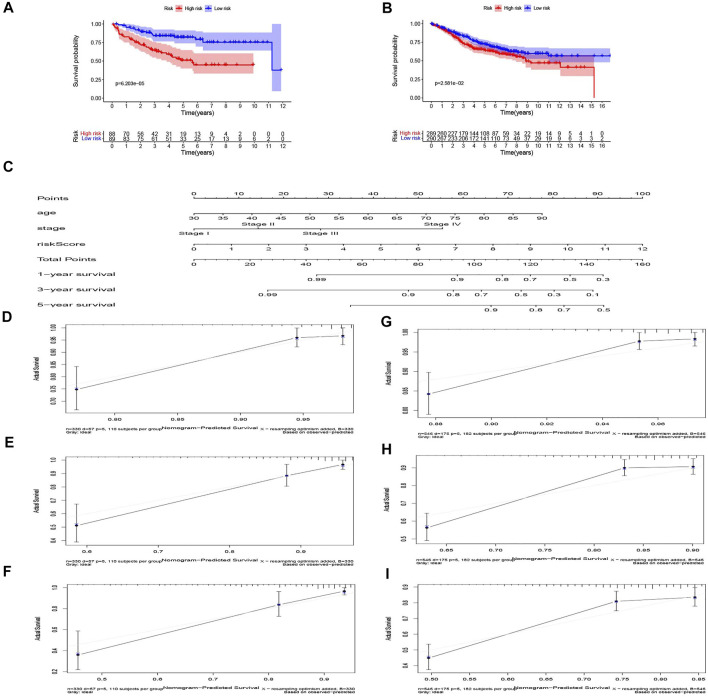
The prognosis of colon adenocarcinoma (COAD) remains poor. However, the specific and sensitive biomarkers for diagnosis and prognosis of COAD are absent. Transcription factors (TFs) are involved in many biological processes in cells. As the molecule of the signal pathway of the terminal effectors, TFs play important roles in tumorigenesis and development. A growing body of research suggests that aberrant TFs contribute to the development of COAD, as well as to its clinicopathological features and prognosis. In consequence, a few studies have investigated the relationship between the TF-related risk model and the prognosis of COAD. Therefore, in this article, we hope to develop a prognostic risk model based on TFs to predict the prognosis of patients with COAD. The mRNA transcription data and corresponding clinical data were downloaded from TCGA and GEO. Then, 141 differentially expressed genes, validated by the GEPIA2 database, were identified by differential expression analysis between normal and tumor samples. Univariate, multivariate and Lasso Cox regression analysis were performed to identify seven prognostic genes (E2F3, ETS2, HLF, HSF4, KLF4, MEIS2, and TCF7L1). The Kaplan-Meier curve and the receiver operating characteristic curve (ROC, 1-year AUC: 0.723, 3-year AUC: 0.775, 5-year AUC: 0.786) showed that our model could be used to predict the prognosis of patients with COAD. Multivariate Cox analysis also reported that the risk model is an independent prognostic factor of COAD. The external cohort (GSE17536 and GSE39582) was used to validate our risk model, which indicated that our risk model may be a reliable predictive model for COAD patients. Finally, based on the model and the clinicopathological factors, we constructed a nomogram with a C-index of 0.802. In conclusion, we emphasize the clinical significance of TFs in COAD and construct a prognostic model of TFs, which could provide a novel and reliable model for the prognosis of COAD.
Keywords: bioinformatics; colon adenocarcinoma; nomogram; risk score; transcription factors.
Copyright © 2021 Lin, Cao, Yu and Cai.
Conflict of interest statement
The authors declare that the research was conducted in the absence of any commercial or financial relationships that could be construed as a potential conflict of interest.
Figures

Similar articles
-
Identification of the Pyroptosis-Related Gene Signature and Risk Score Model for Colon Adenocarcinoma.Front Genet. 2021 Dec 6;12:771847. doi: 10.3389/fgene.2021.771847. eCollection 2021. Front Genet. 2021. PMID: 34938319 Free PMC article.
-
Construction and validation of a cuproptosis-related lncRNA signature as a novel and robust prognostic model for colon adenocarcinoma.Front Oncol. 2022 Jul 28;12:961213. doi: 10.3389/fonc.2022.961213. eCollection 2022. Front Oncol. 2022. PMID: 35965536 Free PMC article.
-
A Novel Pyroptosis-Related Gene Signature for Predicting the Prognosis and the Associated Immune Infiltration in Colon Adenocarcinoma.Front Oncol. 2022 Jul 14;12:904464. doi: 10.3389/fonc.2022.904464. eCollection 2022. Front Oncol. 2022. PMID: 35912258 Free PMC article.
-
Identification of a novel prognostic signature composed of 3 cuproptosis-related transcription factors in colon adenocarcinoma.Genes Genomics. 2023 Aug;45(8):1047-1061. doi: 10.1007/s13258-023-01406-5. Epub 2023 Jun 15. Genes Genomics. 2023. PMID: 37318704
-
Exploration of Potential Roles of m5C-Related Regulators in Colon Adenocarcinoma Prognosis.Front Genet. 2022 Feb 24;13:816173. doi: 10.3389/fgene.2022.816173. eCollection 2022. Front Genet. 2022. PMID: 35281843 Free PMC article.
Cited by
-
Six Genes Associated with Lymphatic Metastasis in Colon Adenocarcinoma Linked to Prognostic Value and Tumor Immune Cell Infiltration.Evid Based Complement Alternat Med. 2022 Aug 29;2022:4304361. doi: 10.1155/2022/4304361. eCollection 2022. Evid Based Complement Alternat Med. 2022. PMID: 36072412 Free PMC article.
-
An integrated bioinformatic investigation of mitochondrial energy metabolism genes in colon adenocarcinoma followed by preliminary validation of CPT2 in tumor immune infiltration.Front Immunol. 2022 Sep 13;13:959967. doi: 10.3389/fimmu.2022.959967. eCollection 2022. Front Immunol. 2022. PMID: 36177002 Free PMC article.
-
Transcription factors-related molecular subtypes and risk prognostic model: exploring the immunogenicity landscape and potential drug targets in hepatocellular carcinoma.Cancer Cell Int. 2024 Jan 4;24(1):9. doi: 10.1186/s12935-023-03185-1. Cancer Cell Int. 2024. PMID: 38178084 Free PMC article.
-
Integrative Molecular Analyses of an Individual Transcription Factor-Based Genomic Model for Lung Cancer Prognosis.Dis Markers. 2021 Dec 7;2021:5125643. doi: 10.1155/2021/5125643. eCollection 2021. Dis Markers. 2021. PMID: 34925645 Free PMC article.
References
LinkOut - more resources
Full Text Sources
Research Materials
Miscellaneous