

Meta-analysis: Congruence of genomic and phenotypic differentiation across diverse natural study systems
- PMID: 34603492
- PMCID: PMC8477602
- DOI: 10.1111/eva.13264
Meta-analysis: Congruence of genomic and phenotypic differentiation across diverse natural study systems
Abstract
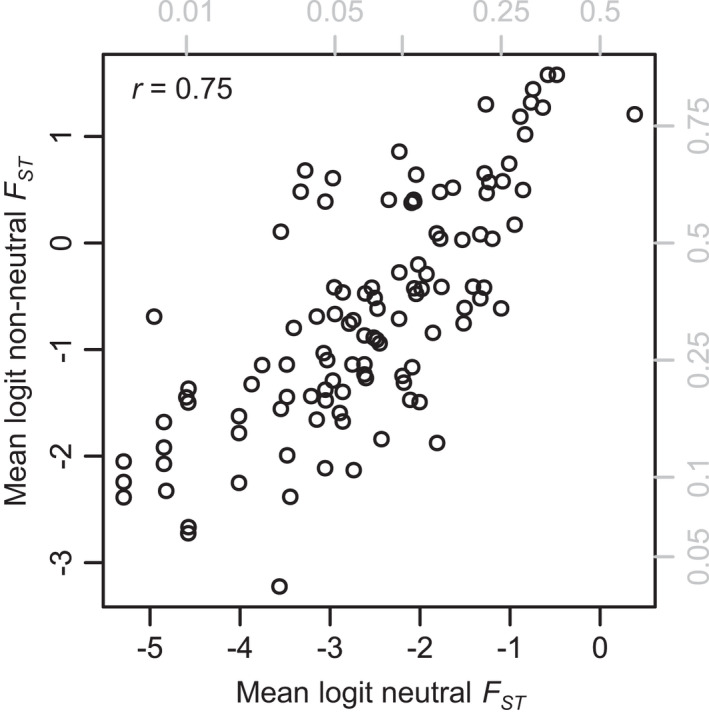
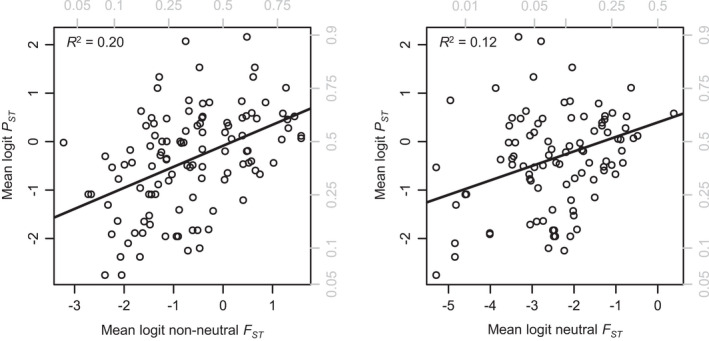
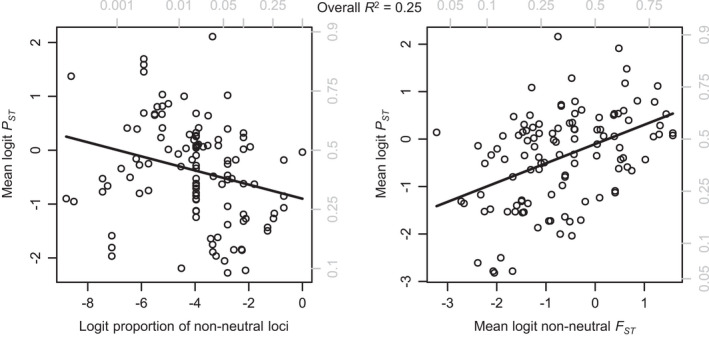
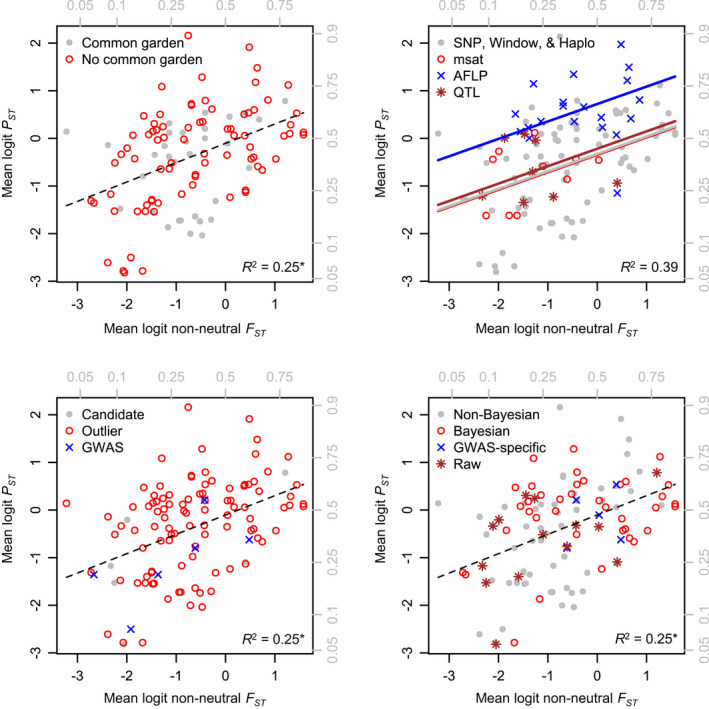
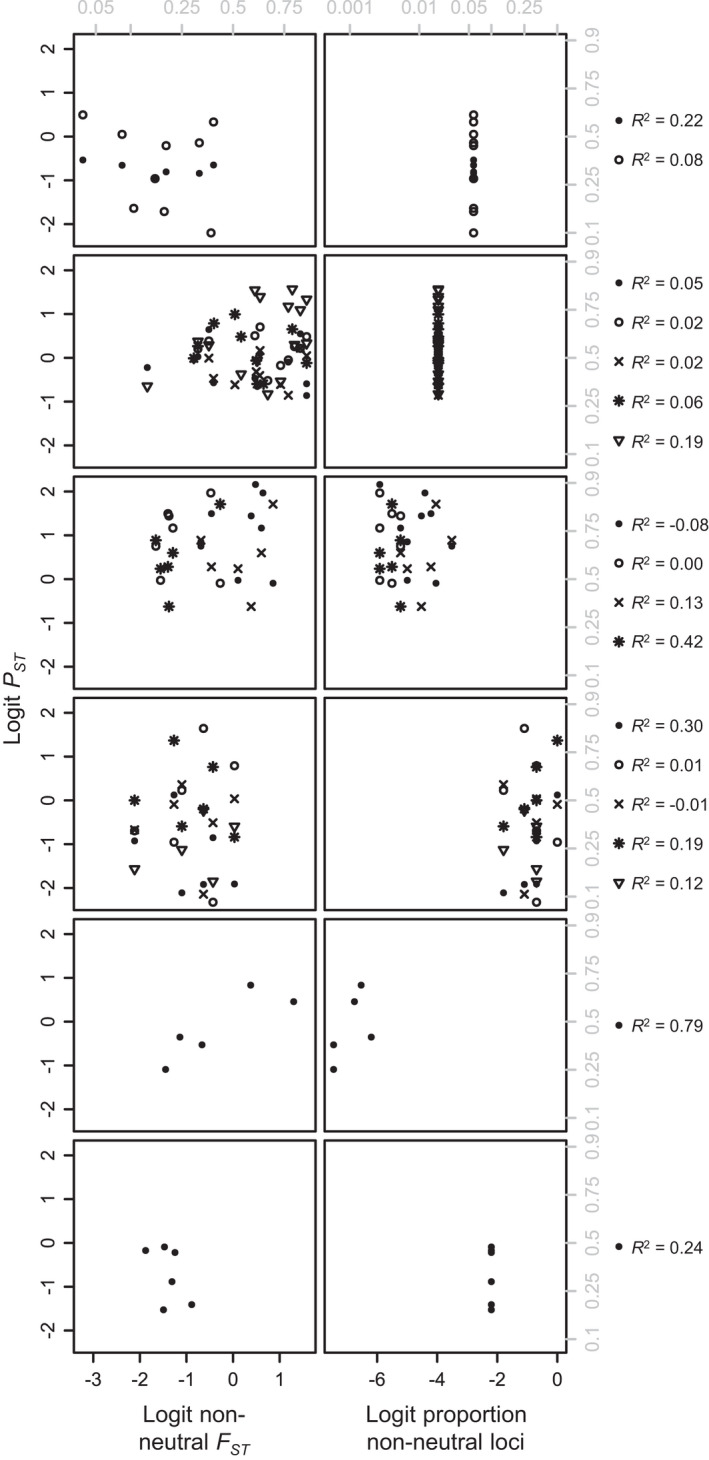
Linking genotype to phenotype is a primary goal for understanding the genomic underpinnings of evolution. However, little work has explored whether patterns of linked genomic and phenotypic differentiation are congruent across natural study systems and traits. Here, we investigate such patterns with a meta-analysis of studies examining population-level differentiation at subsets of loci and traits putatively responding to divergent selection. We show that across the 31 studies (88 natural population-level comparisons) we examined, there was a moderate (R 2 = 0.39) relationship between genomic differentiation (F ST ) and phenotypic differentiation (P ST ) for loci and traits putatively under selection. This quantitative relationship between P ST and F ST for loci under selection in diverse taxa provides broad context and cross-system predictions for genomic and phenotypic adaptation by natural selection in natural populations. This context may eventually allow for more precise ideas of what constitutes "strong" differentiation, predictions about the effect size of loci, comparisons of taxa evolving in nonparallel ways, and more. On the other hand, links between P ST and F ST within studies were very weak, suggesting that much work remains in linking genomic differentiation to phenotypic differentiation at specific phenotypes. We suggest that linking genotypes to specific phenotypes can be improved by correlating genomic and phenotypic differentiation across a spectrum of diverging populations within a taxon and including wide coverage of both genomes and phenomes.
Keywords: FST; GWAS; PST; candidate gene approaches; natural selection; outlier analysis.
© 2021 The Authors. Evolutionary Applications published by John Wiley & Sons Ltd.
Conflict of interest statement
The authors declare no conflicts of interest.
Figures
Similar articles
-
Divergent selection as revealed by P(ST) and QTL-based F(ST) in three-spined stickleback (Gasterosteus aculeatus) populations along a coastal-inland gradient.Mol Ecol. 2007 Feb;16(4):891-905. doi: 10.1111/j.1365-294X.2006.03190.x. Mol Ecol. 2007. PMID: 17284219
-
Local adaptation in shell shape traits of a brooding chiton with strong population genomic differentiation.Evolution. 2023 Jan 23;77(1):210-220. doi: 10.1093/evolut/qpac011. Evolution. 2023. PMID: 36622696
-
Rapid adaptive divergence between ecotypes of an aquatic isopod inferred from F-Q analysis.Mol Ecol. 2009 Dec;18(23):4912-23. doi: 10.1111/j.1365-294X.2009.04408.x. Epub 2009 Oct 29. Mol Ecol. 2009. PMID: 19878452
-
Divergent selection and heterogeneous genomic divergence.Mol Ecol. 2009 Feb;18(3):375-402. doi: 10.1111/j.1365-294X.2008.03946.x. Epub 2008 Dec 29. Mol Ecol. 2009. PMID: 19143936 Review.
-
Whither Pst? The approximation of Qst by Pst in evolutionary and conservation biology.J Evol Biol. 2011 Jun;24(6):1160-8. doi: 10.1111/j.1420-9101.2011.02268.x. Epub 2011 Apr 4. J Evol Biol. 2011. PMID: 21457173 Review.
Cited by
-
Phylogeography and phenotypic wing shape variation in a damselfly across populations in Europe.BMC Ecol Evol. 2024 Feb 3;24(1):19. doi: 10.1186/s12862-024-02207-4. BMC Ecol Evol. 2024. PMID: 38308224 Free PMC article.
-
Anti-predator defences are linked with high levels of genetic differentiation in frogs.Proc Biol Sci. 2024 Jan 31;291(2015):20232292. doi: 10.1098/rspb.2023.2292. Epub 2024 Jan 24. Proc Biol Sci. 2024. PMID: 38264783 Free PMC article.
-
Secondary contact zone and genetic introgression in closely related haplodiploid social spider mites.Heredity (Edinb). 2024 Oct;133(4):227-237. doi: 10.1038/s41437-024-00708-y. Epub 2024 Aug 2. Heredity (Edinb). 2024. PMID: 39090316
-
The Applied Genomics Development Strategy by the Croatian Academy of Sciences and Arts paves the way for the future development of applied genomics in Croatia.Croat Med J. 2024 Jun 13;65(3):297-302. doi: 10.3325/cmj.2024.65.297. Croat Med J. 2024. PMID: 38868976 Free PMC article. No abstract available.
References
-
- Aria, M., & Cuccurullo, C. (2017). bibliometrix: An R‐tool for comprehensive science mapping analysis. Journal of Informetrics, 11, 959–975. 10.1016/j.joi.2017.08.007 - DOI
-
- Bogue, M. A., Grubb, S. C., Walton, D. O., Philip, V. M., Kolishovski, G., Stearns, T., Dunn, M. H., Skelly, D. A., Kadakkuzha, B., TeHennepe, G., Kunde‐Ramamoorthy, G., & Chesler, E. J. (2018). Mouse Phenome Database: An integrative database and analysis suite for curated empirical phenotype data from laboratory mice. Nucleic Acids Research, 46, D843–D850. 10.1093/nar/gkx1082 - DOI - PMC - PubMed
-
- Bolnick, D. I., Barret, R. D. H., Oke, K. B., Rennison, D. J., & Stuart, Y. E. (2018). (Non)parallel evolution. Annual Review of Ecology, Evolution, and Systematics, 49, 303–330. 10.1146/annurev-ecolsys-110617-062240 - DOI
LinkOut - more resources
Full Text Sources
Miscellaneous
