Integrated Analysis of lncRNA-Associated ceRNA Network Identifies Two lncRNA Signatures as a Prognostic Biomarker in Gastric Cancer
- PMID: 34603561
- PMCID: PMC8479203
- DOI: 10.1155/2021/8886897
Integrated Analysis of lncRNA-Associated ceRNA Network Identifies Two lncRNA Signatures as a Prognostic Biomarker in Gastric Cancer
Abstract
Background: Gastric cancer (GC) is a malignant tumour that originates in the gastric mucosal epithelium and is associated with high mortality rates worldwide. Long noncoding RNAs (lncRNAs) have been identified to play an important role in the development of various tumours, including GC. Yet, lncRNA biomarkers in a competing endogenous RNA network (ceRNA network) that are used to predict survival prognosis remain lacking. The aim of this study was to construct a ceRNA network and identify the lncRNA signature as prognostic factors for survival prediction.
Methods: The lncRNAs with overall survival significance were used to construct the ceRNA network. Function enrichment, protein-protein interaction, and cluster analysis were performed for dysregulated mRNAs. Multivariate Cox proportional hazards regression was performed to screen the potential prognostic lncRNAs. RT-qPCR was used to measure the relative expression levels of lncRNAs in cell lines. CCK8 assay was used to assess the proliferation of GC cells transfected with sh-lncRNAs.
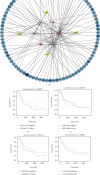
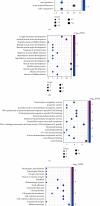
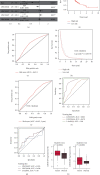
Results: Differentially expressed genes were identified including 585 lncRNAs, 144 miRNAs, and 2794 mRNAs. The ceRNA network was constructed using 35 DElncRNAs associated with overall survival of GC patients. Functional analysis revealed that these dysregulated mRNAs were enriched in cancer-related pathways, including TGF-beta, Rap 1, calcium, and the cGMP-PKG signalling pathway. A multivariate Cox regression analysis and cumulative risk score suggested that two of those lncRNAs (LINC01644 and LINC01697) had significant prognostic value. Furthermore, the results indicate that LINC01644 and LINC01697 were upregulated in GC cells. Knockdown of LINC01644 or LINC01697 suppressed the proliferation of GC cells.
Conclusions: The authors identified 2-lncRNA signature in ceRNA regulatory network as prognostic biomarkers for the prediction of GC patient survival and revealed that silencing LINC01644 or LINC01697 inhibited the proliferation of GC cells.
Copyright © 2021 Shuyan Zhang et al.
Conflict of interest statement
The authors declare no competing interests.
Figures


Similar articles
-
Systematic analysis of lncRNA-miRNA-mRNA competing endogenous RNA network identifies four-lncRNA signature as a prognostic biomarker for breast cancer.J Transl Med. 2018 Sep 27;16(1):264. doi: 10.1186/s12967-018-1640-2. J Transl Med. 2018. PMID: 30261893 Free PMC article.
-
Construction of a potential long noncoding RNA prognostic model involved competitive endogenous RNA for patients with gastric cancer.Medicine (Baltimore). 2024 Jun 14;103(24):e38458. doi: 10.1097/MD.0000000000038458. Medicine (Baltimore). 2024. PMID: 38875399 Free PMC article.
-
Identification of a LncRNA based CeRNA network signature to establish a prognostic model and explore potential therapeutic targets in gastric cancer.Sci Rep. 2025 Jul 1;15(1):20891. doi: 10.1038/s41598-025-05105-x. Sci Rep. 2025. PMID: 40595924 Free PMC article.
-
Reconstruction and Analysis of the Differentially Expressed IncRNA-miRNA-mRNA Network Based on Competitive Endogenous RNA in Hepatocellular Carcinoma.Crit Rev Eukaryot Gene Expr. 2019;29(6):539-549. doi: 10.1615/CritRevEukaryotGeneExpr.2019028740. Crit Rev Eukaryot Gene Expr. 2019. PMID: 32422009 Review.
-
Identification of MFI2-AS1, a Novel Pivotal lncRNA for Prognosis of Stage III/IV Colorectal Cancer.Dig Dis Sci. 2020 Dec;65(12):3538-3550. doi: 10.1007/s10620-020-06064-1. Epub 2020 Jan 20. Dig Dis Sci. 2020. PMID: 31960204 Review.
Cited by
-
The implication of integrative multiple RNA modification-based subtypes in gastric cancer immunotherapy and prognosis.iScience. 2024 Jan 12;27(2):108897. doi: 10.1016/j.isci.2024.108897. eCollection 2024 Feb 16. iScience. 2024. PMID: 38318382 Free PMC article.
-
Decoding the regulatory landscape of lncRNAs as potential diagnostic and prognostic biomarkers for gastric and colorectal cancers.Clin Exp Med. 2024 Jan 31;24(1):29. doi: 10.1007/s10238-023-01260-5. Clin Exp Med. 2024. PMID: 38294554 Free PMC article. Review.
-
Integrated Analysis of miR-7-5p-Related ceRNA Network Reveals Potential Biomarkers for the Clinical Outcome of Gastric Cancer.J Oncol. 2022 Feb 14;2022:8204818. doi: 10.1155/2022/8204818. eCollection 2022. J Oncol. 2022. PMID: 35466319 Free PMC article.
-
Screening and validation of platelet activation-related lncRNAs as potential biomarkers for prognosis and immunotherapy in gastric cancer patients.Front Genet. 2022 Sep 14;13:965033. doi: 10.3389/fgene.2022.965033. eCollection 2022. Front Genet. 2022. PMID: 36186426 Free PMC article.
-
Identification of optimal feature genes in patients with thyroid associated ophthalmopathy and their relationship with immune infiltration: a bioinformatics analysis.Front Endocrinol (Lausanne). 2023 Oct 13;14:1203120. doi: 10.3389/fendo.2023.1203120. eCollection 2023. Front Endocrinol (Lausanne). 2023. PMID: 37900130 Free PMC article.
References
-
- McLean R. H., Sardi A. Gastric cancer: an overview with emphasis on early gastric cancer. Maryland Medical Journal . 1998;47(4):191–194. - PubMed
MeSH terms
Substances
LinkOut - more resources
Full Text Sources
Medical
Miscellaneous

