. 2021 Sep 21:2021:5529518.
doi: 10.1155/2021/5529518. eCollection 2021.

One-Two Punch Therapy for the Treatment of T-Cell Malignancies Involving p53-Dependent Cellular Senescence

Affiliations

One-Two Punch Therapy for the Treatment of T-Cell Malignancies Involving p53-Dependent Cellular Senescence

Yingjie Qing et al. Oxid Med Cell Longev. .

Abstract

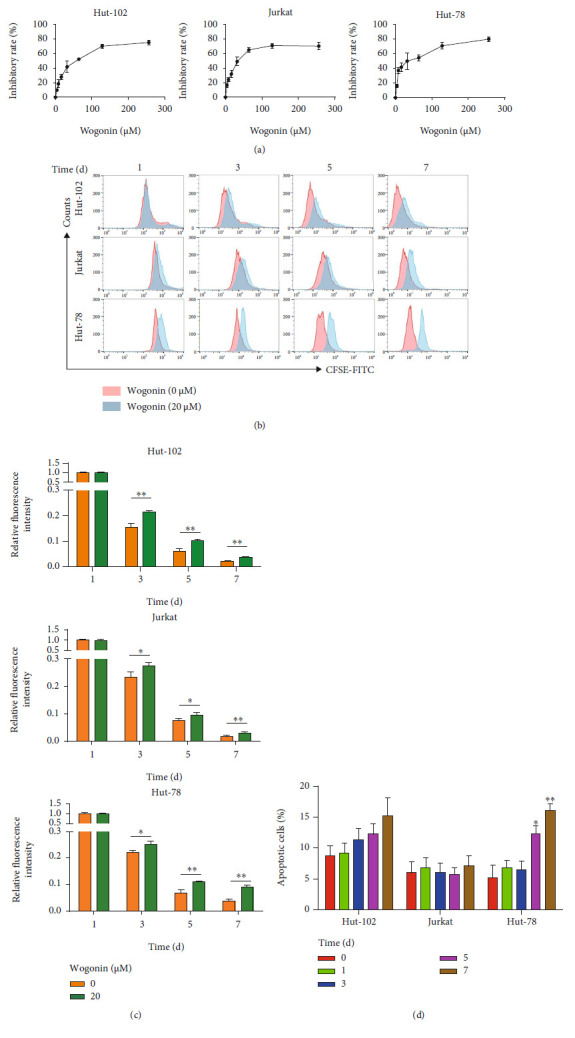
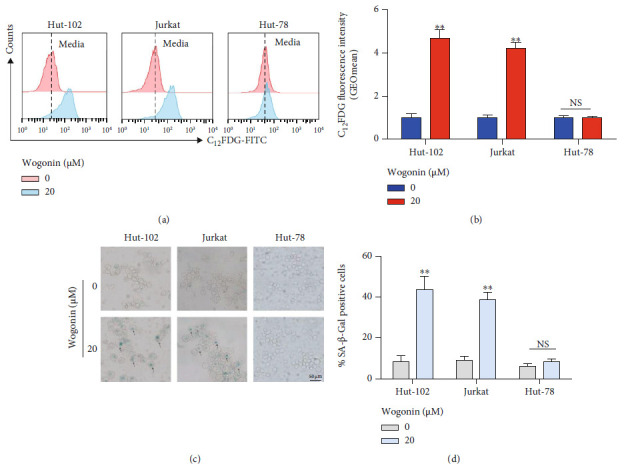
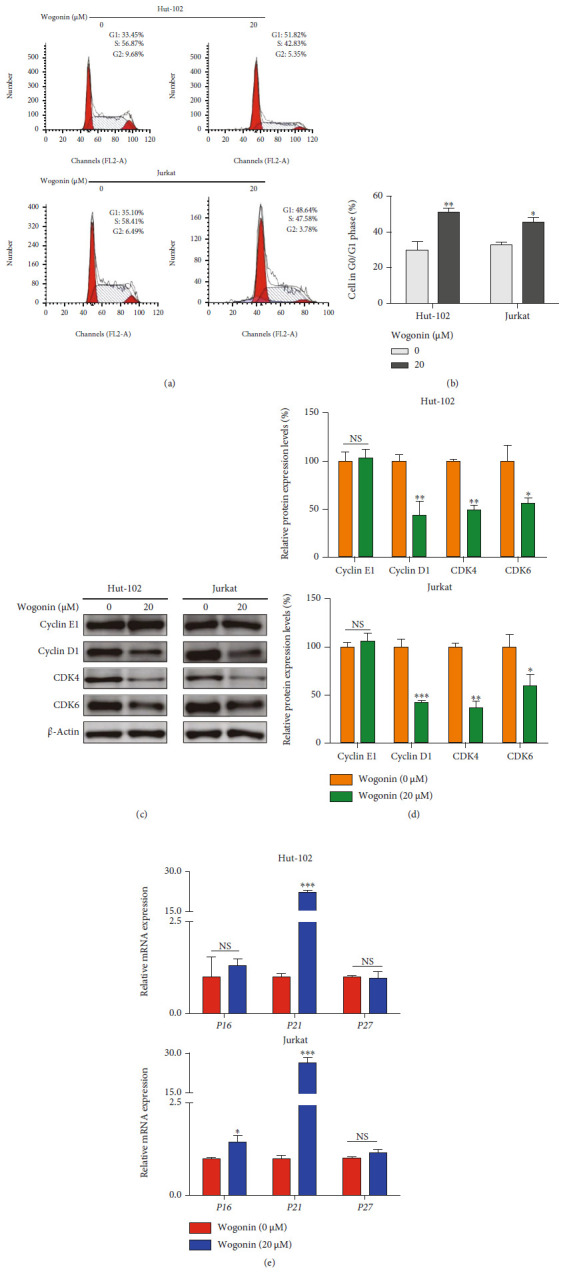
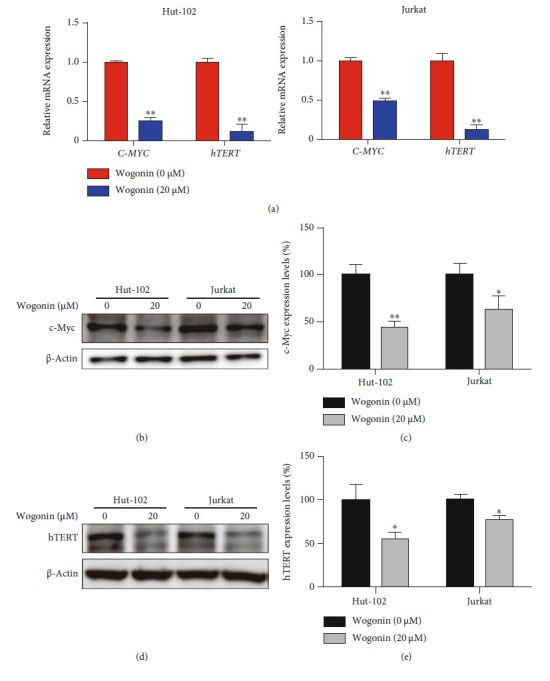
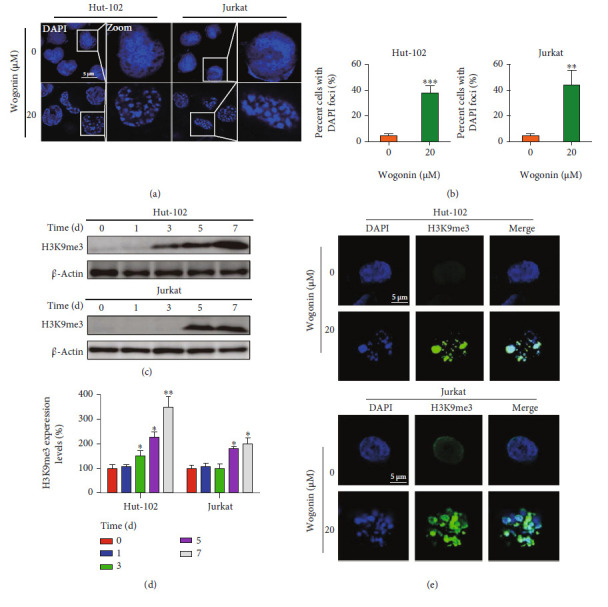
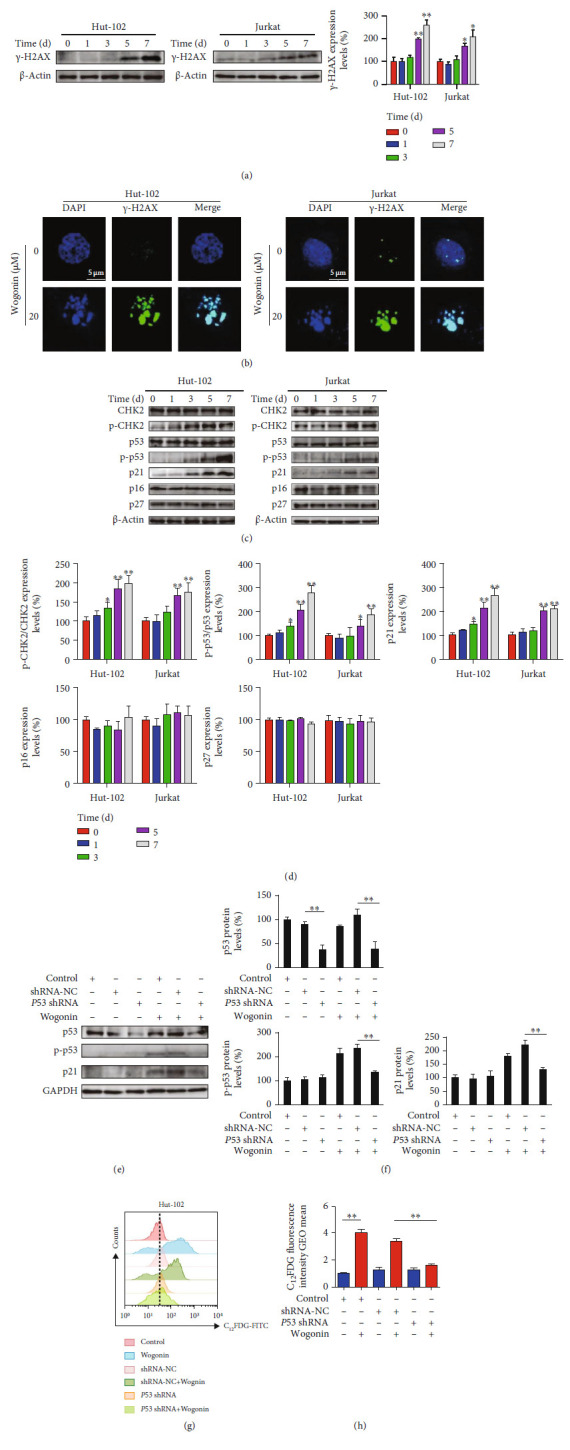
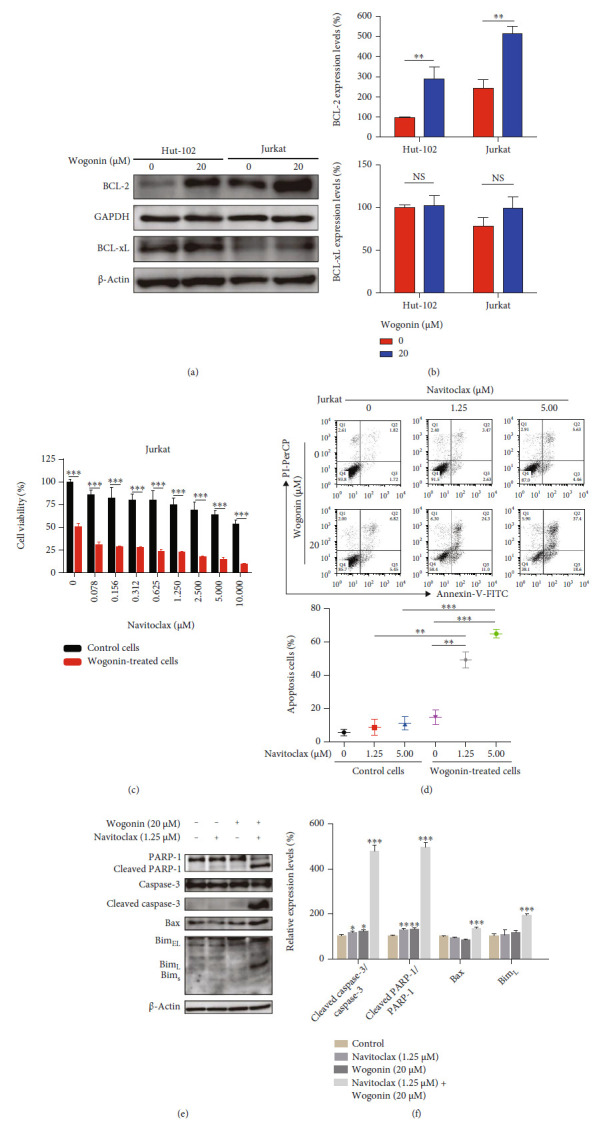
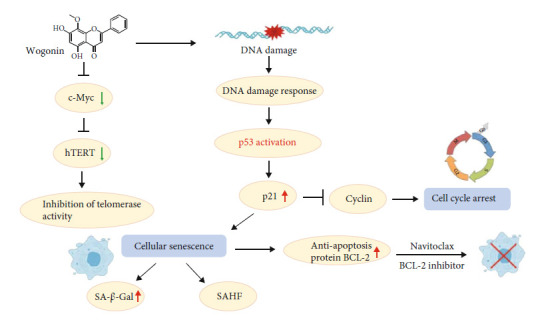
T-cell malignancies are still difficult to treat due to a paucity of plans that target critical dependencies. Drug-induced cellular senescence provides a permanent cell cycle arrest during tumorigenesis and cancer development, particularly when combined with senolytics to promote apoptosis of senescent cells, which is an innovation for cancer therapy. Here, our research found that wogonin, a well-known natural flavonoid compound, not only had a potential to inhibit cell growth and proliferation but also induced cellular senescence in T-cell malignancies with nonlethal concentration. Transcription activity of senescence-suppression human telomerase reverse transcriptase (hTERT) and oncogenic C-MYC was suppressed in wogonin-induced senescent cells, resulting in the inhibition of telomerase activity. We also substantiated the occurrence of DNA damage during the wogonin-induced aging process. Results showed that wogonin increased the activity of senescence-associated β-galactosidase (SA-β-Gal) and activated the DNA damage response pathway mediated by p53. In addition, we found the upregulated expression of BCL-2 in senescent T-cell malignancies because of the antiapoptotic properties of senescent cells. Following up this result, we identified a BCL-2 inhibitor Navitoclax (ABT-263), which was highly effective in decreasing cell viability and inducing apoptotic cell death in wogonin-induced senescent cells. Thus, the "one-two punch" approach increased the sensibility of T-cell malignancies with low expression of BCL-2 to Navitoclax. In conclusion, our research revealed that wogonin possesses potential antitumor effects based on senescence induction, offering a better insight into the development of novel therapeutic methods for T-cell malignancies.


Conflict of interest statement

The authors declare that they have no conflicts of interest.

Figures

Figure 1
Figure 1
Wogonin induced growth inhibition but not apoptosis in Hut-102 and Jurkat cells. (a) Hut-102, Jurkat, and Hut-78 cells were exposed to wogonin at indicated concentrations (0-256 μM), respectively. The inhibitory rate of cell viability was measured by the CCK8 assay after 24 h. (b) Hut-102, Jurkat, and Hut-78 cells were treated with or without 20 μM wogonin; then, the cells were labeled with CFSE for 1, 3, 5, and 7 d, respectively. Results of CFSE expression were analyzed by flow cytometry. (c) Quantification of CFSE expression. Ordinate represents relative changes of fluorescence intensity (GEOmean). Significant difference represents the fluorescent intensity between the control group and wogonin group in the same day. Columns represent the mean from three parallel experiments (mean ± SEM). p < 0.05, ∗∗p < 0.01, compared with the control group. (d) Hut-102, Jurkat, and Hut-78 cells were treated with 20 μM wogonin for the indicated times (0, 1, 3, 5, and 7 d). Then, the cell apoptosis rates were analyzed via Annexin V/PI staining by flow cytometry. Columns represent the mean from three parallel experiments (mean ± SEM). p < 0.05, ∗∗p < 0.01, compared with the control group.
Figure 2
Figure 2
Wogonin induced cellular senescence in Hut-102 and Jurkat cells but not Hut-78 cells. (a) Cells (Hut-102, Jurkat, and Hut-78 cells) were treated with or without 20 μM wogonin for 5 d. SA-β-Gal activity was measured by C12FDG fluorogenic substrate of SA-β-galactosidase using flow cytometry. Representative peak graphs from one of the three independent experiments, illustrating C12FDG fluorescence. (b) Quantification of SA-β-Gal activity measured by C12FDG fluorescence. The dark blue histogram represents control cells, and the red histogram represents cells that were cultured in the presence of 20 μM wogonin. Columns represent the mean from three parallel experiments (mean ± SEM). p < 0.05, ∗∗p < 0.01, compared with the control group. (c) SA-β-Gal activity was measured by SA-β-Gal staining in cells (Hut-102, Jurkat, and Hut-78 cells) treated with or without 20 μM wogonin for 5 d. Representative images from one of the three independent experiments. Representative pictures are shown (magnification, ×200). (d) Quantification of SA-β-Gal activity measured by cell staining. The grey histogram represents control cells, and the blue histogram represents cells that were cultured in the presence of 20 μM wogonin. Columns represent the mean from three parallel experiments (mean ± SEM). p < 0.05, ∗∗p < 0.01, compared with the control group.
Figure 3
Figure 3
Wogonin-induced cell cycle arrest was accompanied by cellular senescence. (a) Hut-102 and Jurkat cells were treated with or without 20 μM wogonin for 5 d. Representative cell cycle was performed by PI staining and analyzed by flow cytometry. (b) The percentages of cells in the G0/G1 phases of the cell cycle following 20 μM wogonin treatment for 5 d are shown. Columns represent the mean from three parallel experiments (mean ± SEM). p < 0.05, ∗∗p < 0.01, compared with the control group. (c) Hut-102 and Jurkat cells were treated with or without 20 μM wogonin for 5 d. Western blot analyses of cell cycle regulatory proteins cyclin E1, cyclin D1, CDK4, and CDK6. β-Actin was used as loading controls. (d) Relative protein expression levels of cyclin D1, cyclin E1, CDK4, and CDK6 were determined. Columns represent the mean from three parallel experiments (mean ± SEM). p < 0.05, ∗∗p < 0.01, compared with the control group. (e) The relative mRNA levels of P16, P21, and P27 in control and wogonin-treated Hut-102 and Jurkat cells. Columns represent the mean from three parallel experiments (mean ± SEM). p < 0.05, ∗∗p < 0.01, and ∗∗∗p < 0.001, compared with the control group.
Figure 4
Figure 4
Wogonin suppressed telomerase activity by inhibition of hTERT and c-Myc in wogonin-induced senescent cells. (a) Hut-102 and Jurkat cells were treated with or without 20 μM wogonin for 5 d. The relative mRNA level of hTERT and C-MYC was measured by RT-PCR. Columns represent the mean from three parallel experiments (mean ± SEM). p < 0.05, ∗∗p < 0.01, compared with the control group. (b) Hut-102 and Jurkat cells were treated with or without 20 μM wogonin for 5 d. The expression of c-Myc protein was performed by western blot. β-Actin was used as loading controls. (c) Relative protein expression level of c-Myc. Columns represent the mean from three parallel experiments (mean ± SEM). p < 0.05, ∗∗p < 0.01, compared with the control group. (d) Hut-102 and Jurkat cells were treated with or without 20 μM wogonin for 5 d. The expression of hTERT protein was performed by western blot. β-Actin was used as loading controls. (e) Relative protein expression level of hTERT. Columns represent the mean from three parallel experiments (mean ± SEM). p < 0.05, ∗∗p < 0.01, compared with the control group.
Figure 5
Figure 5
Wogonin induced senescence-associated heterochromatin foci in senescent cells. (a) Hut-102 and Jurkat cells were treated with or without 20 μM wogonin for 5 d; then, the cells were fixed and permeabilized, and nuclei were stained with DAPI (blue). SAHF formed in wogonin-treated Hut-102 and Jurkat cells. Representative confocal images for wogonin-induced SAHF formation in cells from confocal laser scanning microscopy are shown (original magnification ×1000; immersion objective ×100/×100 with immersion oil type). Images are representative of three independent experiments. (b) The percentage of positive cells with the DNA agglutination points (DAPI foci) was counted (with 20 cells counted per field). Columns represent the mean from three parallel experiments (mean ± SEM). ∗∗p < 0.01, ∗∗∗p < 0.001, compared with the control group. (c) Hut-102 and Jurkat cells were treated with or without 20 μM wogonin for 5 d. The expression of the SAHF marker protein H3K9me3 in control and wogonin-treated Hut-102 and Jurkat cells was performed by western blot. β-Actin was used as loading controls. (d) Relative protein expression level of H3K9me3 was determined. Columns represent the mean from three parallel experiments (mean ± SEM). p < 0.05, ∗∗p < 0.01, compared with the control group. (e) Hut-102 and Jurkat cells were treated with or without 20 μM wogonin for 5 d; then, the cells were fixed, permeabilized, and stained with an antibody against H3K9me3 (green), while nuclei were stained with DAPI (blue). Immunofluorescent images showed the distribution of H3K9me3 in Hut-102 and Jurkat cells (original magnification ×1000; immersion objective ×100/×100 with immersion oil type). Images are representative of three independent experiments.
Figure 6
Figure 6
Wogonin induced cellular senescence through p53-mediated DNA damage response. (a) Hut-102 and Jurkat cells were treated with or without 20 μM wogonin for the indicated time periods, and western blot was used to detect the expression change of the DNA damage marker protein γ-H2AX. β-Actin was used as loading controls. Relative protein expression level of γ-H2AX was determined. Columns represent the mean from three parallel experiments (mean ± SEM). p < 0.05, ∗∗p < 0.01, compared with the control group. (b) Hut-102 and Jurkat cells were treated with or without 20 μM wogonin for 5 d; then, the cells were fixed, permeabilized, and stained with an antibody against γ-H2AX (green), while nuclei were stained with DAPI (blue). Immunofluorescent images showed the distribution of γ-H2AX in Hut-102 and Jurkat cells (original magnification ×1000; immersion objective ×100/×100 with immersion oil type). Images are representative of three independent experiments. (c) Hut-102 and Jurkat cells were treated with or without 20 μM wogonin for the indicated time periods (0, 1, 3, 5, and 7 d), and western blot was performed to detect the expression changes of CHK2, p-CHK2 (T68), p53, p-p53 (Ser15), p21, p16, and p27. β-Actin was used as loading controls. (d) Relative protein expression levels of p-CHK2/CHK2, p-p53/p53, p21, p16, and p27 were determined. Columns represent the mean from three parallel experiments (mean ± SEM). p < 0.05, ∗∗p < 0.01, compared with the control group. (e) The protein expression levels of p53, p-p53 (Ser15), and p21 were detected by western blot. P53 shRNA-transfected Hut-102, shRNA-NC, and control Hut-102 cells were treated with or without 20 μM wogonin for 5 d. GAPDH was used as loading controls. (f) Relative protein expression levels of p53, p-p53 (Ser15), and p21. Columns represent the mean from three parallel experiments (mean ± SEM). p < 0.05, ∗∗p < 0.01, compared with the control group. (g) Hut-102 cells were transfected with P53 shRNA and shRNA-NC by a lentiviral vector. P53 shRNA-transfected Hut-102, shRNA-NC, and control Hut-102 cells were treated with or without 20 μM wogonin for 5 d. The activity of SA-β-Gal was measured by flow cytometry (cells were stained with C12FDG). (h) Relative SA-β-Gal activity was assessed by using the GEOmean of groups, which represented C12FDG fluorescence intensity. Columns represent the mean from three parallel experiments (mean ± SEM). p < 0.05, ∗∗p < 0.01, compared with the NC group.
Figure 7
Figure 7
Wogonin-induced cellular senescence sensitized Navitoclax to kill T-cell malignancy cells. (a) Hut-102 and Jurkat cells were treated with or without 20 μM wogonin for 5 d, and western blot was used to detect the expression change of BCL-2 and BCL-xL. GAPDH and β-actin were used as loading controls. (b) Relative protein expression levels of BCL-2 and BCL-xL. Columns represent the mean from three parallel experiments (mean ± SEM). p < 0.05, ∗∗p < 0.01, compared with the control group. (c) Jurkat cells were exposed to 20 μM wogonin for 5 d, and then, control or wogonin-treated Jurkat cells were treated with the indicated concentrations of Navitoclax (0-10 μM) for 48 h. Cell viability was assayed by CCK8. The data represent the mean ± SEM of three different experiments. ∗∗∗p < 0.001, compared with the control group. (d) Jurkat cells were exposed to 20 μM wogonin for 5 d, and then, control or wogonin-treated Jurkat cells were then treated with the indicated concentrations of Navitoclax (1.25, 5 μM) for 48 h. Cell apoptosis was assayed by flow cytometry after Annexin-V/PI staining. Data represent the mean from three parallel experiments (mean ± SEM). p < 0.05, ∗∗p < 0.01, and ∗∗∗p < 0.001, compared with the control group. (e) Jurkat cells were exposed to 20 μM wogonin for 5 d, and then, control or wogonin-treated Jurkat cells were then treated with the indicated concentrations of Navitoclax (1.25 μM) for 48 h. The protein expression levels of PARP-1, cleaved PARP-1, caspase-3, cleaved caspase-3, Bax, and Bim were analyzed by western blot. β-Actin were used as loading controls. (f) Relative protein expression levels of cleaved caspase-3/caspase-3, cleaved PARP-1/PARP-1, Bax, and BimL. Columns represent the mean from three parallel experiments (mean ± SEM). p < 0.05, ∗∗p < 0.01, and ∗∗∗p < 0.001, compared with the control group.
Figure 8
Figure 8
Graphical abstract on the mechanisms of one-two punch therapy involved in wogonin-induced cellular senescence in T-cell malignancies.

Similar articles

Cited by

References

    1. The Non-Hodgkin's Lymphoma Classification Project. A clinical evaluation of the International Lymphoma Study Group classification of non-Hodgkin's lymphoma. Blood . 1997;89(11):3909–3918. doi: 10.1182/blood.V89.11.3909. - DOI - PubMed
    1. Aifantis I., Raetz E., Buonamici S. Molecular pathogenesis of T-cell leukaemia and lymphoma. Nature reviews Immunology . 2008;8(5):380–390. doi: 10.1038/nri2304. - DOI - PubMed
    1. Maciocia P. M., Wawrzyniecka P. A., Philip B., et al. Targeting the T cell receptor β-chain constant region for immunotherapy of T cell malignancies. Nature Medicine . 2017;23(12):1416–1423. doi: 10.1038/nm.4444. - DOI - PubMed
    1. Mamonkin M., Rouce R. H., Tashiro H., Brenner M. K. A T-cell-directed chimeric antigen receptor for the selective treatment of T-cell malignancies. Blood . 2015;126(8):983–992. doi: 10.1182/blood-2015-02-629527. - DOI - PMC - PubMed
    1. Palomero T., Ferrando A. Targeted cellular immunotherapy for T cell malignancies. Nature Medicine . 2017;23(12):1402–1403. doi: 10.1038/nm.4458. - DOI - PMC - PubMed

MeSH terms