. 2021 Aug 17;12(37):12302-12314.
doi: 10.1039/d1sc03813c. eCollection 2021 Sep 29.

Two-step anti-cooperative self-assembly process into defined π-stacked dye oligomers: insights into aggregation-induced enhanced emission

Affiliations

Two-step anti-cooperative self-assembly process into defined π-stacked dye oligomers: insights into aggregation-induced enhanced emission

Yvonne Vonhausen et al. Chem Sci. .

Abstract

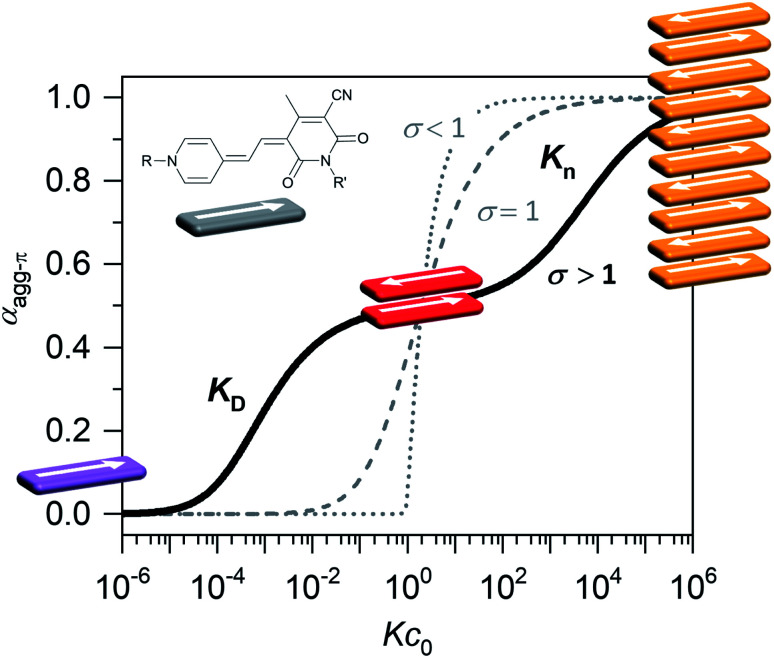
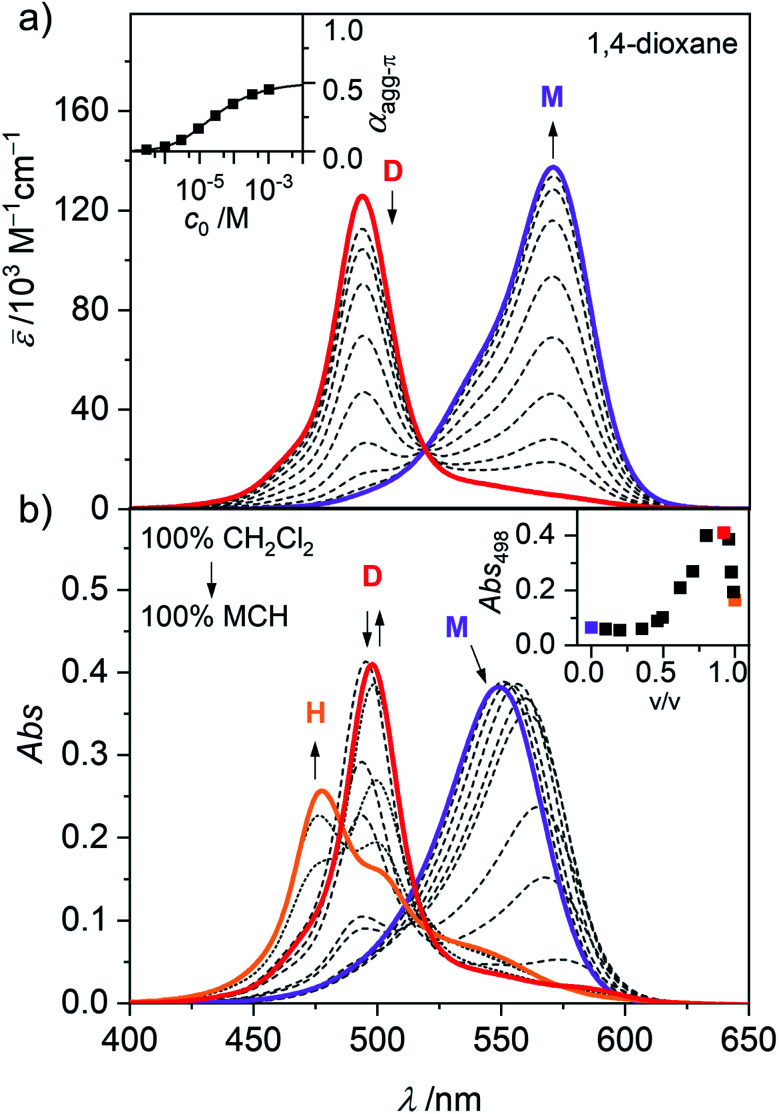
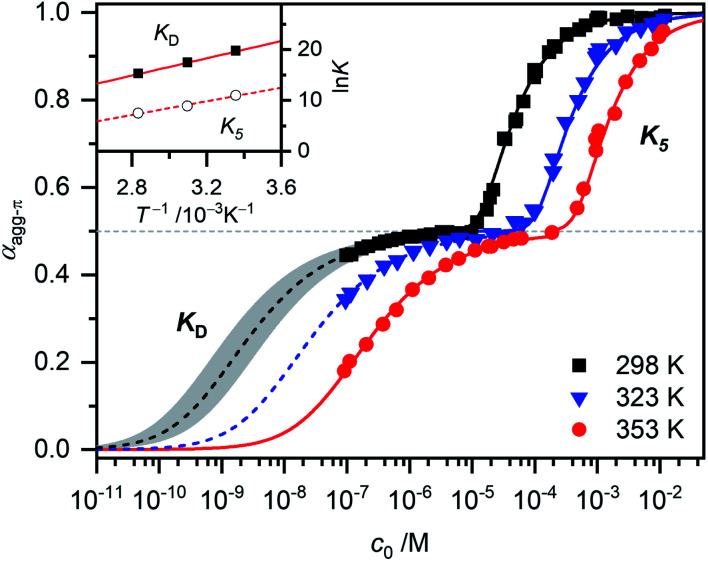
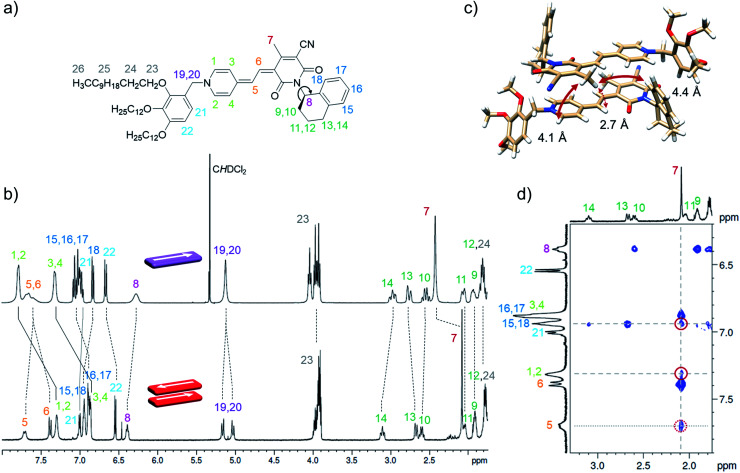
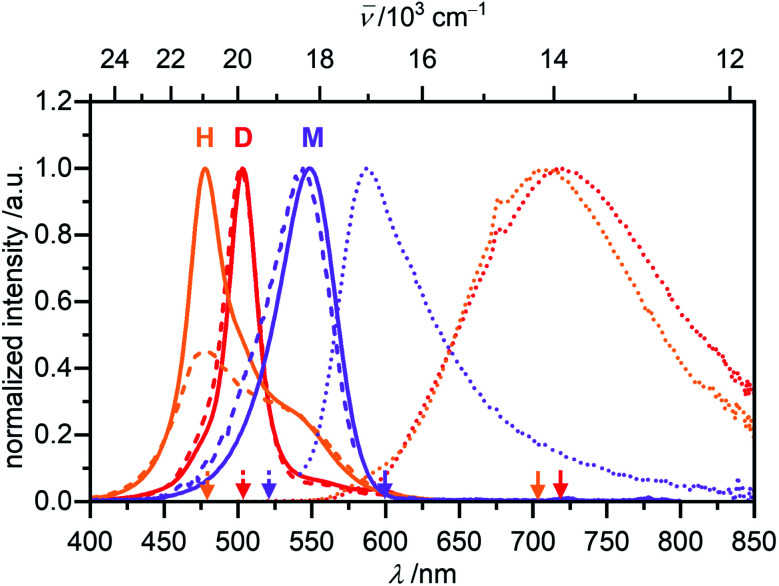
Aggregation-induced emission enhancement (AIEE) phenomena received great popularity during the last decade but in most cases insights into the packing structure - fluorescence properties remained scarce. Here, an almost non-fluorescent merocyanine dye was equipped with large solubilizing substituents, which allowed the investigation of it's aggregation behaviour in unpolar solvents over a large concentration range (10-2 to 10-7 M). In depth analysis of the self-assembly process by concentration-dependent UV/Vis spectroscopy at different temperatures revealed a two-step anti-cooperative aggregation mechanism. In the first step a co-facially stacked dimer is formed driven by dipole-dipole interactions. In a second step these dimers self-assemble to give an oligomer stack consisting of about ten dyes. Concentration- and temperature-dependent UV/Vis spectroscopy provided insight into the thermodynamic parameters and allowed to identify conditions where either the monomer, the dimer or the decamer prevails. The centrosymmetric dimer structure could be proven by 2D NMR spectroscopy. For the larger decamer atomic force microscopy (AFM), diffusion ordered spectroscopy (DOSY) and vapour pressure osmometric (VPO) measurements consistently indicated that it is of small and defined size. Fluorescence, circular dichroism (CD) and circularly polarized luminescence (CPL) spectroscopy provided insights into the photofunctional properties of the dye aggregates. Starting from an essentially non-fluorescent monomer (Φ Fl = 0.23%) a strong AIEE effect with excimer-type fluorescence (large Stokes shift, increased fluorescence lifetime) is observed upon formation of the dimer (Φ Fl = 2.3%) and decamer (Φ Fl = 4.5%) stack. This increase in fluorescence is accompanied for both aggregates by an aggregation-induced CPL enhancement with a strong increase of the g lum from ∼0.001 for the dimer up to ∼0.011 for the higher aggregate. Analysis of the radiative and non-radiative decay rates corroborates the interpretation that the AIEE effect originates from a pronounced decrease of the non-radiative rate due to π-π-stacking induced rigidification that outmatches the effect of the reduced radiative rate that originates from the H-type exciton coupling in the co-facially stacked dyes.


Conflict of interest statement

There are no conflicts to declare.

Figures

Fig. 1
Fig. 1. Degree of aggregated π-faces (αagg-π) as a function of Kc0 according to the isodesmic (dashed grey line), cooperative (dotted grey line) and anti-cooperative (solid black line) model with a dimer nucleus, governed by the cooperativity parameter σ = KD/Kn. Inset shows the dipolar chromophore of merocyanine 1.
Scheme 1
Scheme 1. Synthesis of enantiopure merocyanine 1. (a) HBr, (CH2O)n, HOAc, 70 °C, 4 h. (b) 4-Picoline, MeCN, 90 °C, 18 h, 42% over two steps. (c) NCCH2CO2Et, MeOH, reflux, 48 h. (d) AcCH2CO2Et, piperidine, 100 °C, 24 h, 21% over two steps. (e) N,N′-Diphenylformamidine, Ac2O, rt to 90 °C, 45 min. (f) KOAc, 100 °C, 14 h, 19% over two steps.
Fig. 2
Fig. 2. (a) Concentration-dependent UV/Vis absorption spectra (dashed grey lines) of merocyanine 1 in 1,4-dioxane at 298 K. Arrows indicate the spectral changes upon decreasing the concentration from c0 = 1.1 × 10⁻³ to 3.0 × 10⁻⁷ M. Colored spectra are calculated spectra for the individual monomer (M, violet) and dimer (D, red) species from global fit analysis according to the dimer model. Inset shows the concentration-dependent degree of aggregated π-faces (αagg-π) calculated from the concentration-dependent UV/Vis spectra at 571 nm (■) and the dimerization isotherm (solid line) based on the dimerization constant obtained from global fit analysis. (b) Solvent-dependent UV/Vis absorption spectra of merocyanine 1 in mixtures of CH2Cl2 and MCH (c0 = 3.2 × 10⁻⁴ M, 298 K). Arrows indicate spectral changes upon increasing the volume fraction of MCH from 0% to 90% (dashed lines) and to 100% (dotted lines). The spectra with a MCH content of 0% (violet), 90% (red) and 100% (orange) are marked in color. Inset shows the absorbance at 498 nm as a function of the volume fraction of MCH.
Fig. 3
Fig. 3. Concentration-dependent UV/Vis absorption spectra (dashed lines) of merocyanine 1 in MCH at (a) 298 K, (b) 323 K and (c) 353 K. Arrows indicate the spectral changes during the disassembly process from higher aggregates (H) to dimers (D) and monomers (M) upon decreasing the concentration from c0 = 1.0 × 10⁻² to 9.8 × 10⁻⁸ M. Colored spectra are calculated spectra of the individual species from global fit analysis according to the dimer (2M ⇌ D) and pentamer (5D ⇌ H) models. Insets show the concentration-dependent fraction of molecules xic0−1 of 1 present as higher aggregate (orange), dimer (red) and monomer (violet) in MCH at the respective temperatures according to multiple linear regression analysis.
Fig. 4
Fig. 4. Fraction of aggregated π-faces αagg-π of merocyanine 1 in MCH calculated from spectroscopic data at 298 K (black symbols), 323 K (blue symbols) and 353 K (red symbols) according to eqn (3) and (4). Simulated curves according to dimer (αagg-π < 0.5, eqn (5)) and pentamer model (αagg-π > 0.5, eqn (6) and (7)) calculated with binding constants from global fit analysis (solid lines) or estimated binding constants (dashed lines) are shown for comparison. Grey area marks a range of αagg-π for 9.0 × 10⁸ M−1 > KD > 2.0 × 10⁸ M−1. Inset shows the van't Hoff plot for the calculation of thermodynamic parameters for dimerization (KD) and formation of the higher aggregate (K5).
Fig. 5
Fig. 5. AFM height images of (a) dimer samples of merocyanine 1 in MCH (c0 = 8.7 × 10⁻⁶ M) and (b) higher aggregate sample of merocyanine 1 in MCH diluted from c0 = 9.7 × 10⁻⁴ M to c0 = 0.5 × 10⁻⁴ M and subsequent spin-coating onto TPA-functionalized SiOx/AlOx substrates. Insets show the respective cross-section analysis of the yellow dashed lines.
Fig. 6
Fig. 6. (a) Molecular structure of merocyanine 1 with proton assignment in color. (b) Relevant section of the 1H NMR spectra of the monomer (top) of 1 in CD2Cl2 at 295 K (c0 = 9.7 × 10⁻⁴ M, 400 MHz) and the dimer (bottom) in MCH-d14 at 348 K (c0 = 2.2 × 10⁻⁴ M, 600 MHz). (c) Geometry-optimized dimer structure (B97D3/def2-SVP) with distances given for protons showing intermolecular NOE cross peaks with the protons 7 of the CH3 group. (d) Section of the 1H 1H NOESY NMR (600 MHz) spectrum of the dimer of 1 (c0 = 2.7 × 10⁻⁴ M) in MCH-d14 at 348 K. For complete spectrum see ESI.
Fig. 7
Fig. 7. (a) 1H as well as sections of the 1H 13C HSQC NMR (600 MHz) spectrum (for complete spectrum see Fig. S21, ESI†) of the higher aggregate of 1 (c0 = 2.1 × 10⁻³ M) in MCH-d14 at 295 K. Signals of protons with characteristic 13C shift could be assigned in the HSQC spectrum of the higher aggregate and are marked in color. Sketch of cyclic vs. linear arrangement of ten chromophores visualizes the lower degree of symmetry of the linear stack. (b) Geometry-optimized structure of a decamer stack of 1 (PM7, trialkoxypheny substituents replaced by methyl groups after structure optimization to reduce computational effort for the TDDFT calculations). (c) Experimental CD spectrum of the higher aggregate of 1 in MCH (orange, c0 = 1.0 × 10⁻³ M, 298 K) in comparison with calculated CD spectrum (dashed grey) of the structure shown in (b) calculated by TDDFT with the ωB97 functional (def2SVP, PCM, 15 states, half with at half height = 0.18 eV, shifted 0.64 eV toward lower energies and intensity corrected to fit the maximum of the experimental spectrum).
Fig. 8
Fig. 8. Normalized UV/Vis absorption (solid line), fluorescence (dotted line) and excitation (dashed line) spectra of the monomer (violet, c0 = 6.6 × 10⁻⁷ M, λex = 520 nm, λem = 600 nm) of 1 in CH2Cl2, as well as the dimer (red, c0 = 1.7 × 10⁻⁶ M, λex = 502 nm, λem = 720 nm) and the higher aggregate (orange, c0 = 1.0 × 10⁻³ M, λex = 478 nm, λem = 703 nm, front face setup) of 1 in MCH all recorded at room temperature.
Fig. 9
Fig. 9. CPL spectra of the dimer (red, c0 = 6.7 × 10⁻⁶ M, λex = 480 nm) and the higher aggregate (orange, c0 = 1.2 × 10⁻³ M, λex = 470 nm) of merocyanine 1 in MCH recorded at room temperature. The dimer spectrum is depicted with ten-fold increased intensity.

References

    1. Ostroverkhova O. Chem. Rev. 2016;116:13279–13412. doi: 10.1021/acs.chemrev.6b00127. - DOI - PubMed
    1. Bialas D. Kirchner E. Röhr M. I. S. Würthner F. J. Am. Chem. Soc. 2021;143:4500–4518. doi: 10.1021/jacs.0c13245. - DOI - PubMed
    1. Brixner T. Hildner R. Köhler J. Lambert C. Würthner F. Adv. Energy Mater. 2017;7:1700236. doi: 10.1002/aenm.201700236. - DOI
    1. An B.-K. Gierschner J. Park S. Y. Acc. Chem. Res. 2012;45:544–554. doi: 10.1021/ar2001952. - DOI - PubMed
    1. Young R. M. Wasielewski M. R. Acc. Chem. Res. 2020;53:1957–1968. doi: 10.1021/acs.accounts.0c00397. - DOI - PubMed