. 2020 Sep 30;8(1):coaa087.
doi: 10.1093/conphys/coaa087. eCollection 2020.

Effects of acclimation temperature on the thermal physiology in two geographically distinct populations of lake sturgeon (Acipenser fulvescens)

Affiliations

Effects of acclimation temperature on the thermal physiology in two geographically distinct populations of lake sturgeon (Acipenser fulvescens)

William S Bugg et al. Conserv Physiol. .

Abstract

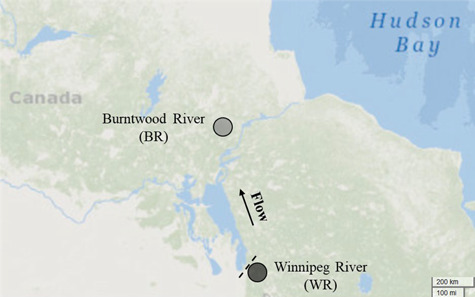
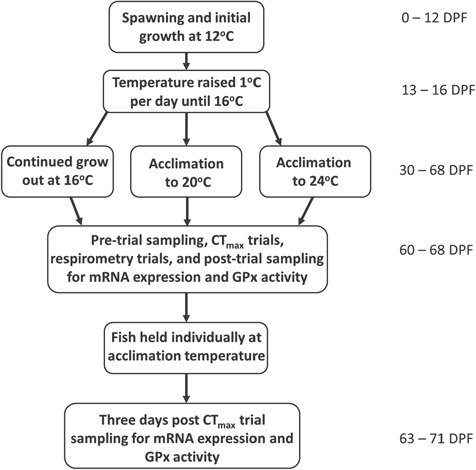
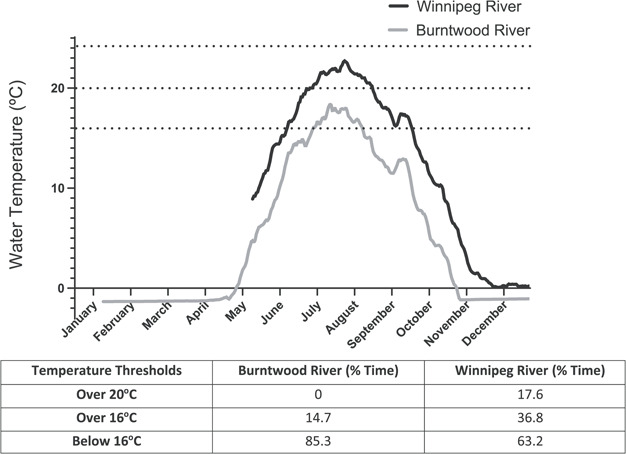
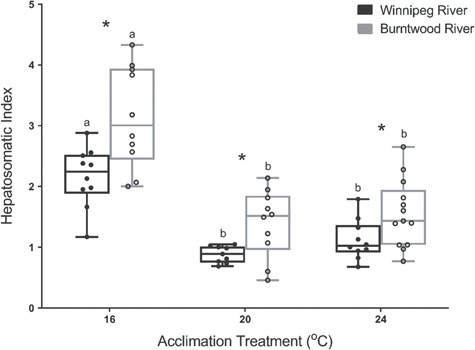
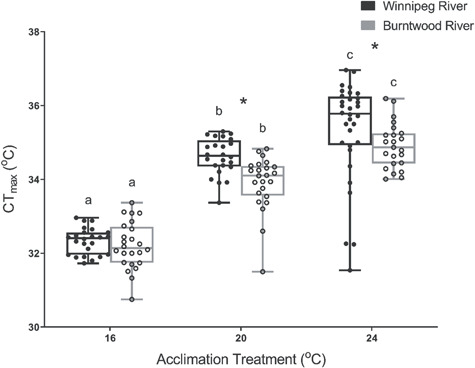
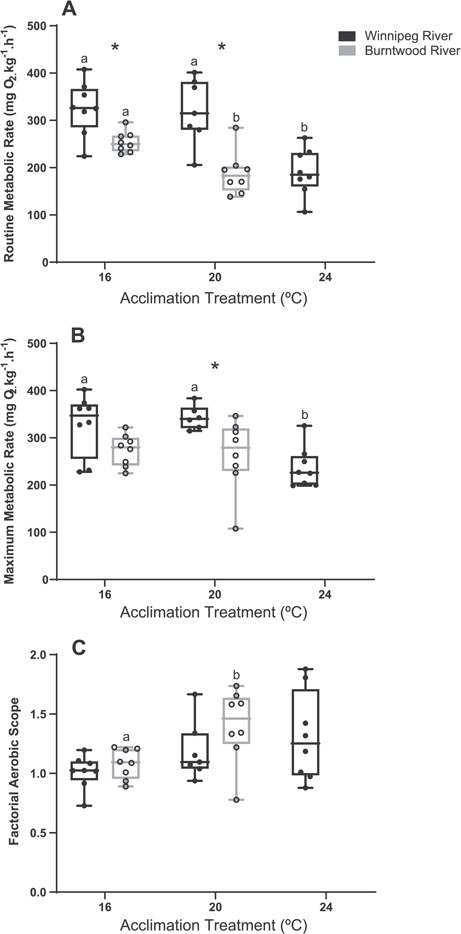
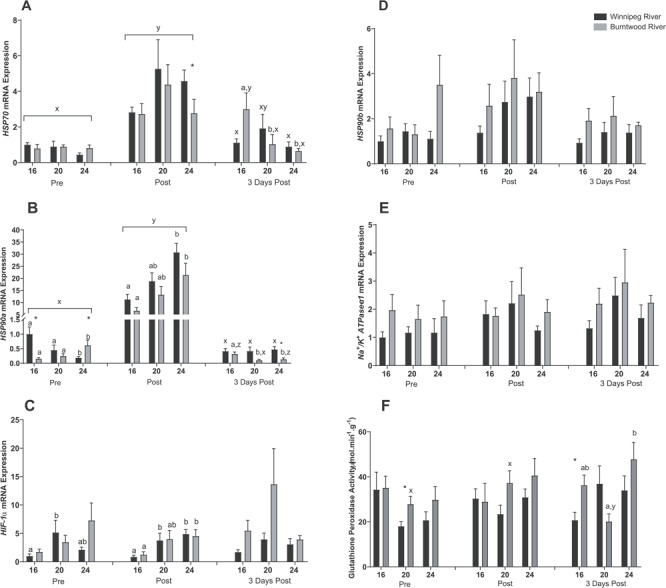
Temperature is one of the most important abiotic factors regulating development and biological processes in ectotherms. By 2050, climate change may result in temperature increases of 2.1-3.4°C in Manitoba, Canada. Lake sturgeon, Acipenser fulvescens, from both northern and southern populations in Manitoba were acclimated to 16, 20 and 24°C for 30 days, after which critical thermal maximum (CTmax) trials were conducted to investigate their thermal plasticity. We also examined the effects of temperature on morphological and physiological indices. Acclimation temperature significantly influenced the CTmax, body mass, hepatosomatic index, metabolic rate and the mRNA expression of transcripts involved in the cellular response to heat shock and hypoxia (HSP70, HSP90a, HSP90b, HIF-1α) in the gill of lake sturgeon. Population significantly affected the above phenotypes, as well as the mRNA expression of Na+/K+ ATPase-α1 and the hepatic glutathione peroxidase enzyme activity. The southern population had an average CTmax that was 0.71 and 0.45°C higher than the northern population at 20 and 24°C, respectively. Immediately following CTmax trials, mRNA expression of HSP90a and HIF-1α was positively correlated with individual CTmax of lake sturgeon across acclimation treatments and populations (r = 0.7, r = 0.62, respectively; P < 0.0001). Lake sturgeon acclimated to 20 and 24°C had decreased hepatosomatic indices (93 and 244% reduction, respectively; P < 0.0001) and metabolic suppression (27.7 and 42.1% reduction, respectively; P < 0.05) when compared to sturgeon acclimated to 16°C, regardless of population. Glutathione peroxidase activity and mRNA expression Na+/K+ ATPase-α1 were elevated in the northern relative to the southern population. Acclimation to 24°C also induced mortality in both populations when compared to sturgeon acclimated to 16 and 20°C. Thus, increased temperatures have wide-ranging population-specific physiological consequences for lake sturgeon across biological levels of organization.

Keywords: Lake Sturgeon; mRNA expression; metabolic rate, acclimation; population-specific responses.


Figures

Figure 1
Figure 1
Geographic locations of two distinct lake sturgeon, Acipenser fulvescens, populations within Manitoba, Canada. Map coordinates span approximately: Lat: 49.5 Lng: −1521.6 SE; Lat: 49.5, Lng: −1551.5 SW; Lat: 60.3 Lng: −1551.5 NW; Lat: 60.3 Lng: −1521.6 NE (National Geographic MapMaker Interactive, 2020). The dotted line on the map indicates the historical barrier of Slave Falls (50° 14′ 34″ N 95°36′ 31″ W) as well as present-day dams separating populations. The grey and black circles indicate the approximate spawning and sampling locations for lake sturgeon on the Burntwood River (BR) and Winnipeg River (WR), respectively
Figure 2
Figure 2
Experimental design and timeline for lake sturgeon, Acipenser fulvescens, acclimation, CTmax (critical thermal maximum) trials, respirometry trials and tissue sampling for mRNA expression as well as GPx (glutathione peroxidase) activity. All-time points are measured as days post-fertilzation (DPF)
Figure 3
Figure 3
Temperature profiles of two distinct lake sturgeon, Acipenser fulvescens, populations. Data for both rivers was measured in 2019 at midnight and % time over-temperature threshold comparisons between the WR and BR populations were based on days where data is available for both populations, 23 May 2019 to 31 December 2019. Tick marks on the x-axis indicate the middle of each given month. Dashed lines indicate the different temperature thresholds and acclimation temperatures used in the current study. The first dotted line at 16°C represents current hatchery conditions and the first acclimation treatment. The second dotted line at 20°C indicates potential increased hatchery temperatures, approximate temperatures that populations are currently exposed to and the second acclimation treatment. The third dotted line at 24°C represents future warming conditions that may be expected in Manitoba, Canada, by 2050
Figure 4
Figure 4
Hepatosomatic index of WR and BR lake sturgeon, Acipenser fulvescens, after 30 days of acclimation to 16, 20 and 24°C. Significance was determined by a two-factor ANOVA (P < 0.05) followed by Tukey’s honestly significant difference post hoc test. Asterisks represent significant differences between populations at each acclimation treatment. Lowercase letters represent significant differences between acclimation treatments, within populations. Box plots represent the mean and 25th and 75th percentiles, whilst whiskers indicate the minimum and maximum values. Dots represent individual data points (n = 10–13 per treatment)
Figure 5
Figure 5
CTmax of WR and BR lake sturgeon, Acipenser fulvescens, after 30 days of acclimation to 16, 20 and 24°C. Significance differences within populations, across acclimation treatments, was determined by Kruskal–Wallis multiple comparisons with P-values adjusted with the Bonferroni method. Significant differences across populations, within a single acclimation treatment, was determined by Wilcoxon signed-rank test. Asterisks represent significant differences between populations at each acclimation treatment. Lowercase letters represent significant differences between acclimation treatments, within populations. Box plots represent the mean and 25th and 75th percentiles, whilst whiskers indicate the minimum and maximum values. Dots represent individual data points (n = 24–32 per treatment)
Figure 6
Figure 6
(A) Resting metabolic rate (RMR), (B) maximum metabolic rate (MMR), (C) factorial aerobic scope (FAS), of WR and BR lake sturgeon, Acipenser fulvescens, after 30 days of acclimation to 16, 20 and 24°C. Significance was determined by a two-factor ANOVA (P < 0.05) followed by Tukey’s honestly significant difference post hoc test. Asterisks represent significant differences between populations at each acclimation treatment. Lowercase letters represent significant differences between acclimation treatments, within populations. Box plots represent the mean and 25th and 75th percentiles, whilst whiskers indicate the minimum and maximum values. Dots represent individual data points (n = 7–8 per treatment)
Figure 7
Figure 7
Gill mRNA expression of (A) HSP70, (B) HSP90a, (C) HIF-1α, (D) HSP90b, (E) Na+/K+ ATPase-α1, (F) liver glutathione peroxidase (GPx) enzyme activity of lake sturgeon, Acipenser fulvescens, acclimated to 16, 20 and 24°C, pre-, immediately post- and 3 days post-CTmax trials. Asterisks represent significance between WR and BR populations of lake sturgeon. Lowercase letters a and b represent significance between acclimation treatments. Lowercase letters x, y and z represent significance between time points (P < 0.05; three-factor ANOVA). Data are expressed as mean +/− SEM [HSP70 n = 6–8, HSP90a n = 6–8, HIF-1α n = 5–8, HSP90b n = 5–8, Na+/K+-α1 n = 5–8, glutathione peroxidase enzyme activity n = 6–8]

Similar articles

Cited by

References

    1. Aidos L, Cafiso A, Bertotto D, Bazzocchi C, Radaelli G, Giancamillo AD (2020) How different rearing temperatures affect growth and stress status of Siberian sturgeon Acipenser baerii larvae. J Fish Biol 96: 913–924. - PubMed
    1. Almroth BC, Asker N, Wassmur B, Rosengren M, Jutfelt F, Grans A, Sundell K, Axelsson M, Sturve J (2015) Warmer water temperature results in oxidative damage in an Antarctic fish, the bald notothen. J Exp Mar Biol Ecol 468: 130–137.
    1. Aloisi DB, Eckes OT, Von Eschen AJ (2019) Development of a growth model for lake sturgeon. N Am J Aquacult 81: 399–405.
    1. Bard B, Kieffer JD (2019) The effects of repeat acute thermal stress on the critical thermal maximum (CTmax) and physiology of juvenile shortnose sturgeon (Acipenser brevirostrum). Can J Zool 97: 567–572.
    1. Beitinger TL, Bennet WA, McCauly RW (2000) Temperature tolerances of North American freshwater fishes exposed to dynamic changes in temperature. Environ Biol Fish 58: 237–275.