. 2021 Mar 17:33:81-98.
doi: 10.1016/j.jare.2021.03.006. eCollection 2021 Nov.

Offspring production of ovarian organoids derived from spermatogonial stem cells by defined factors with chromatin reorganization

Affiliations

Offspring production of ovarian organoids derived from spermatogonial stem cells by defined factors with chromatin reorganization

Huacheng Luo et al. J Adv Res. .

Abstract

Introduction: Fate determination of germline stem cells remains poorly understood at the chromatin structure level.

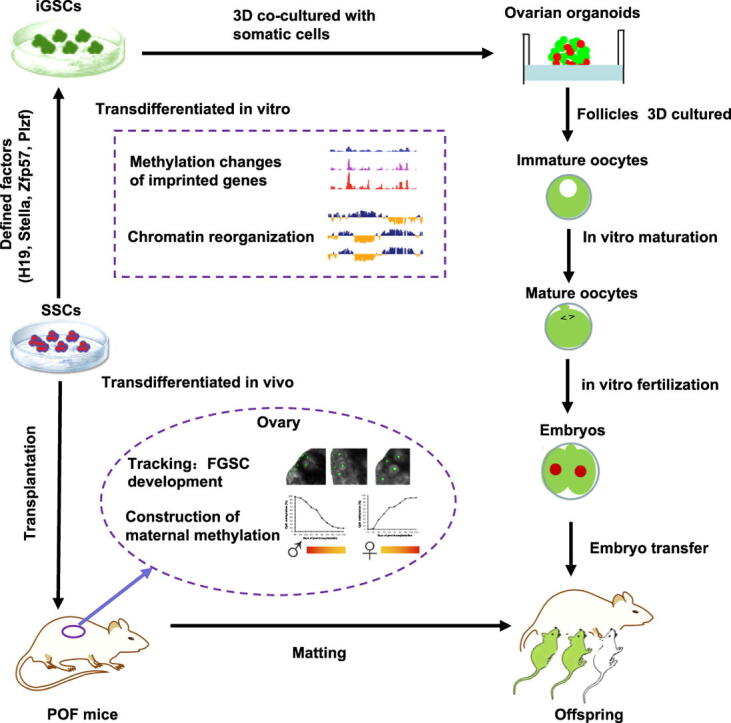
Objectives: Our research hopes to develop successful offspring production of ovarian organoids derived from spermatogonial stem cells (SSCs) by defined factors.

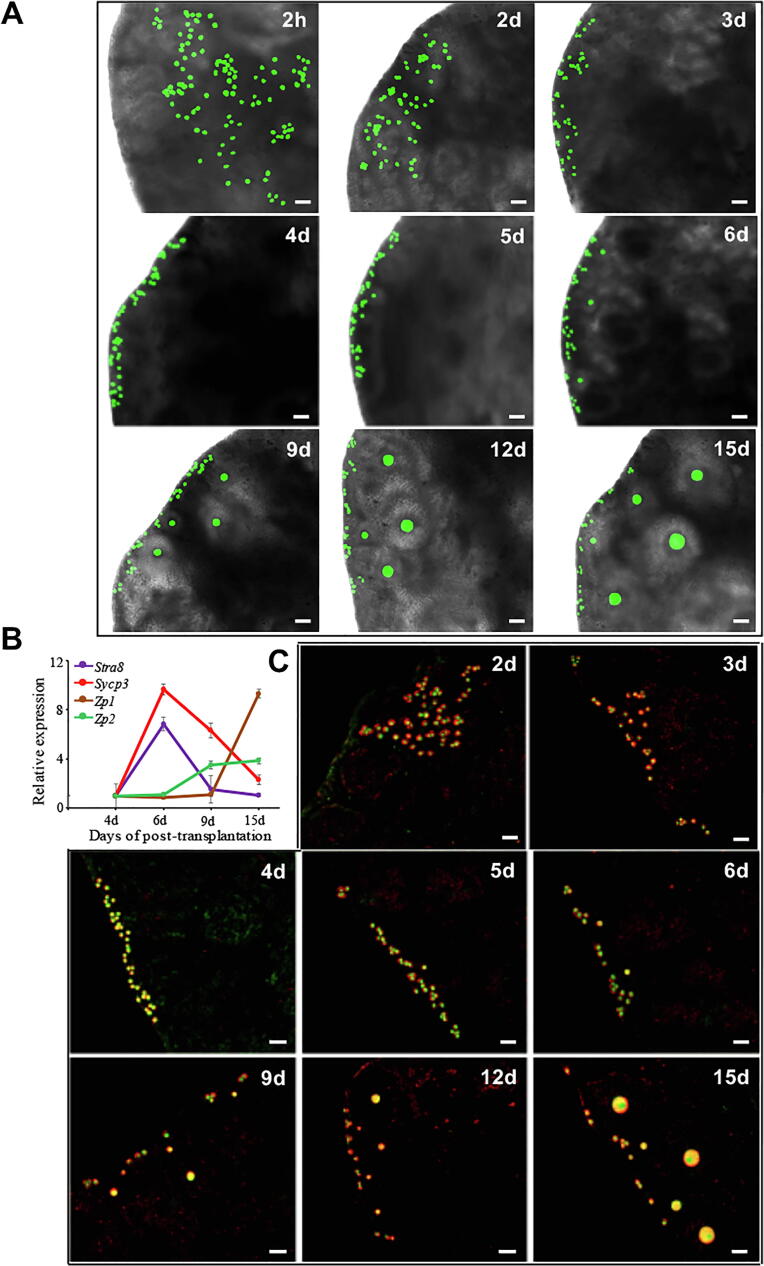
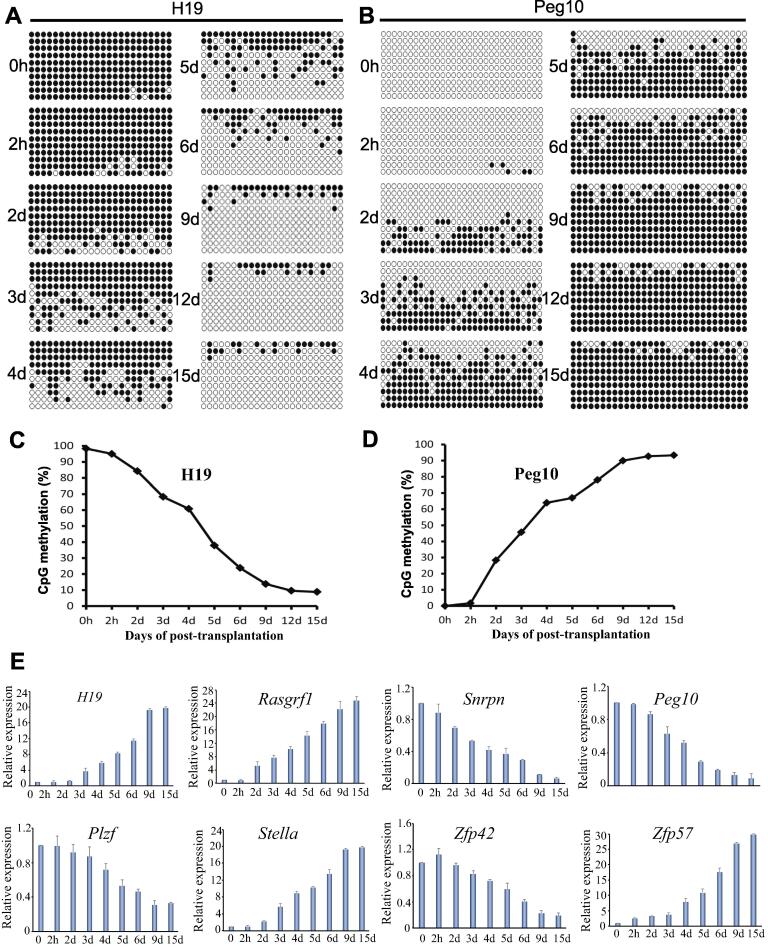
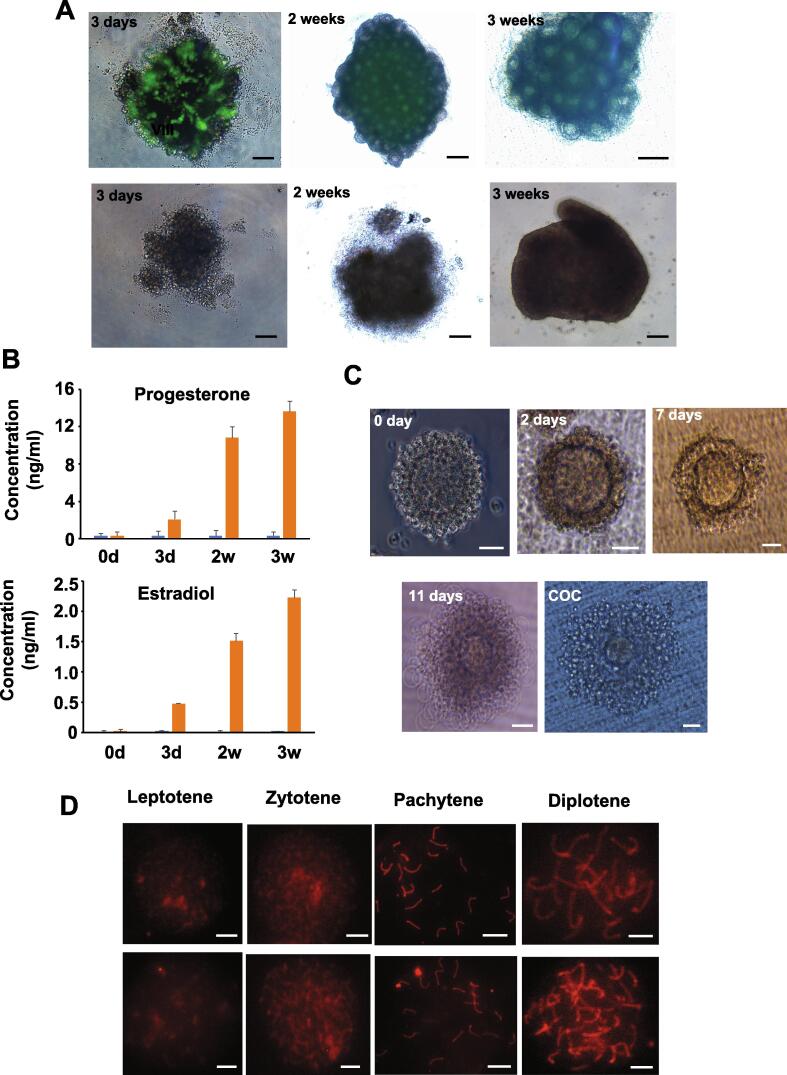
Methods: The offspring production from oocytes transdifferentiated from mouse SSCs with tracking of transplanted SSCs in vivo, single cell whole exome sequencing, and in 3D cell culture reconstitution of the process of oogenesis derived from SSCs. The defined factors were screened with ovarian organoids. We uncovered extensive chromatin reorganization during SSC conversion into induced germline stem cells (iGSCs) using high throughput chromosome conformation.

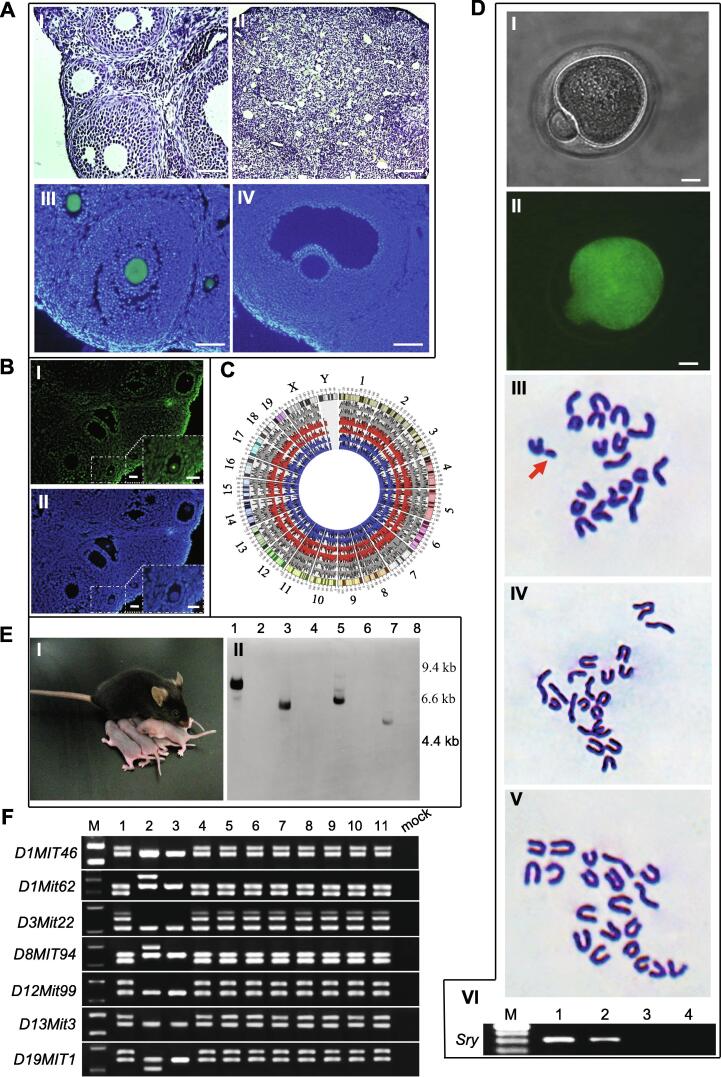
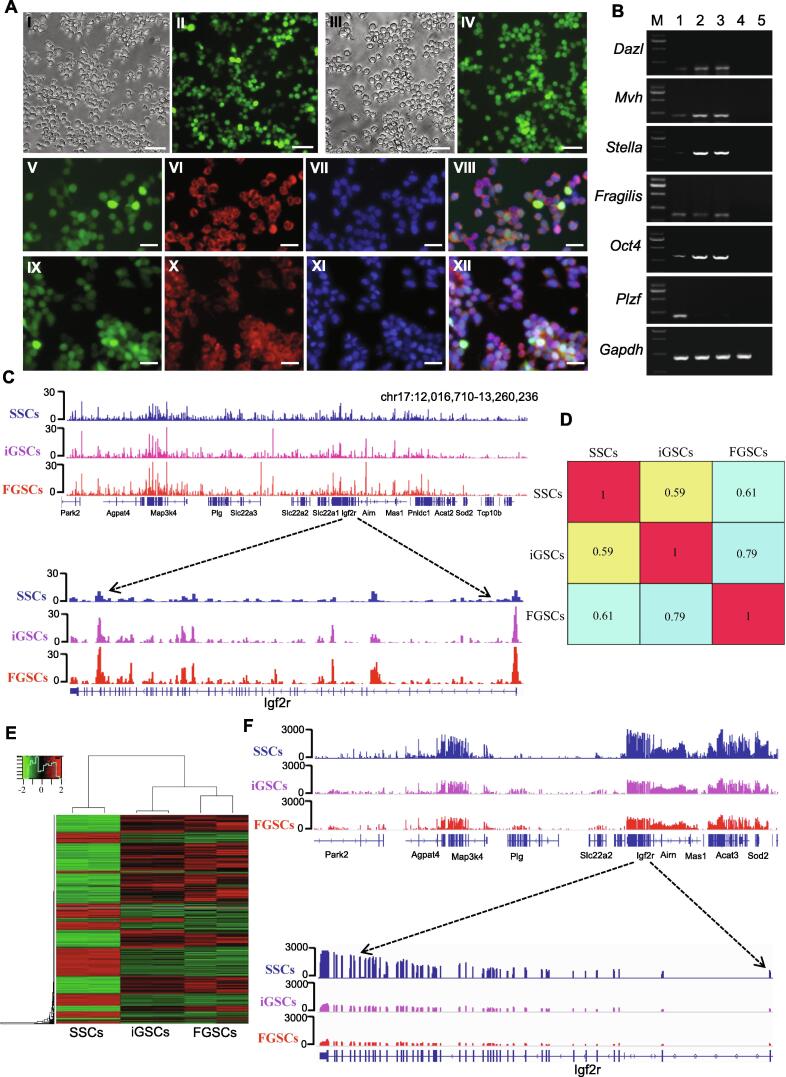
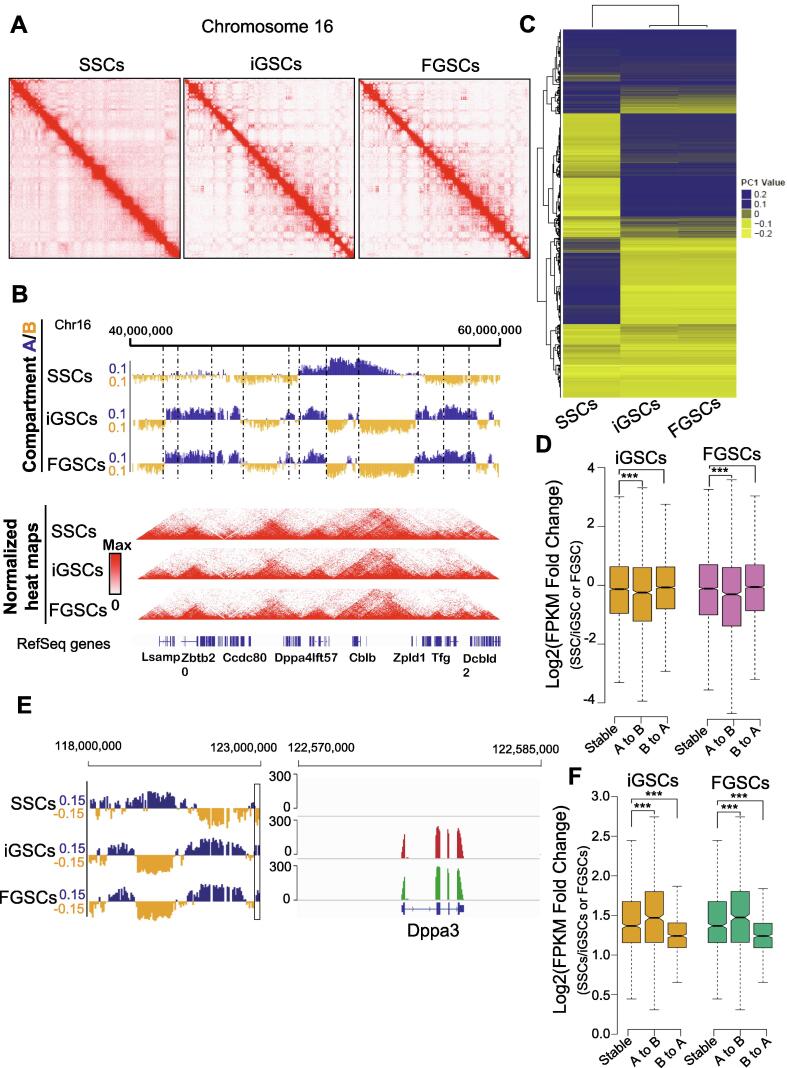
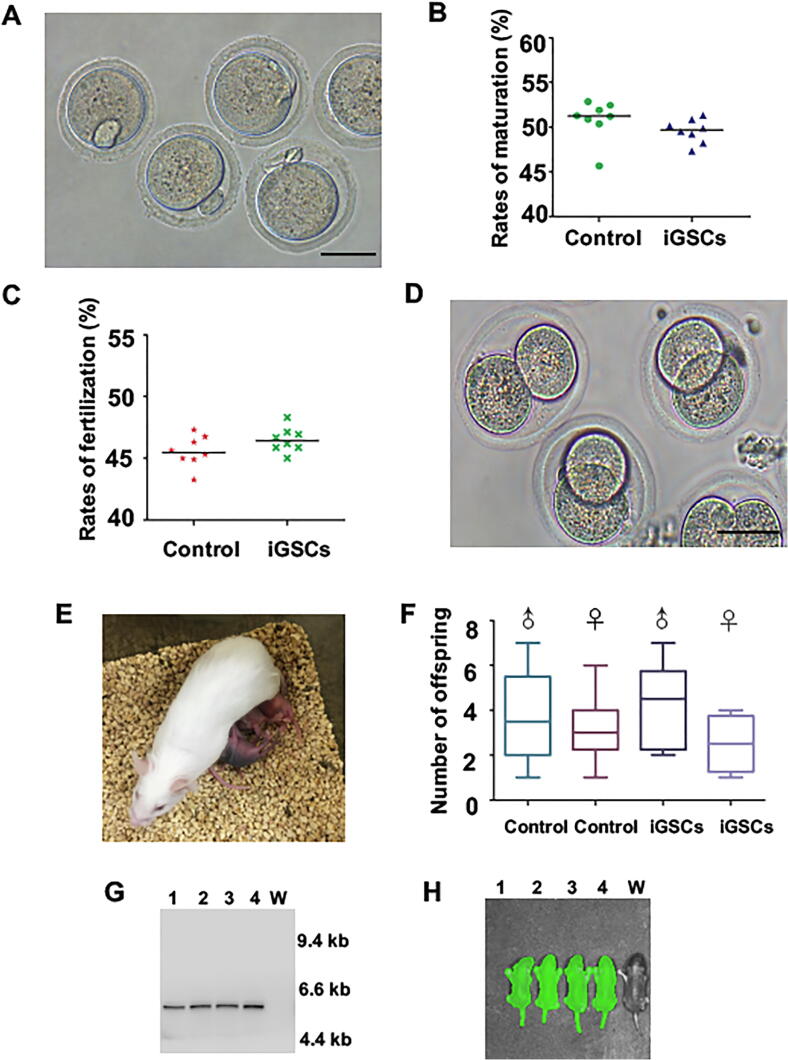
Results: We demonstrate successful production of offspring from oocytes transdifferentiated from mouse spermatogonial stem cells (SSCs). Furthermore, we demonstrate direct induction of germline stem cells (iGSCs) differentiated into functional oocytes by transduction of H19, Stella, and Zfp57 and inactivation of Plzf in SSCs after screening with ovarian organoids. We uncovered extensive chromatin reorganization during SSC conversion into iGSCs, which was highly similar to female germline stem cells. We observed that although topologically associating domains were stable during SSC conversion, chromatin interactions changed in a striking manner, altering 35% of inactive and active chromosomal compartments throughout the genome.

Conclusion: We demonstrate successful offspring production of ovarian organoids derived from SSCs by defined factors with chromatin reorganization. These findings have important implications in various areas including mammalian gametogenesis, genetic and epigenetic reprogramming, biotechnology, and medicine.

Keywords: 3D cell culture; Chromatin reorganization; Defined factors; Induced germline stem cells; Offspring production; Ovarian organoids.


Conflict of interest statement

The authors declared that there is no conflict of interest.

Figures

None
Graphical abstract
Fig. 1
Fig. 1
SSCs transdifferentiate into oocytes in the ovaries of POF recipients and GFP-expressing offspring are generated from the transplanted SSCs from pou5f1/GFP transgenic mice. (A) SSCs were transplanted into the ovaries of POF recipient mice. I, II, Representative morphologies of the ovaries from recipients with (I) or without (II) SSC transplantations. III, Follicles containing GFP-positive (green) oocytes in recipient ovaries at 8 weeks after transplantation of pou5f1/GFP transgenic SSCs. IV, Oocytes in a wild-type ovary without a GFP signal. (B) DNA fluorescence in situ hybridization for SRY. SRY was only localized in oocytes (green) derived from SSCs in ovary (I). Nuclei were counterstained with DAPI (blue) (II). (C) Circos plot showing the coverage from the single cell exon sequencing as a histogram. Grey represents FGSCs; Red represents GV oocytes derived from SSCs in the ovary; Blue represents SSCs. (D) Karyotype analysis of mature oocytes from POF recipient ovaries at 2 months after pou5f1/GFP transgenic SSC transplantation. I, II, Representative morphologies of mature oocytes derived from pou5f1/GFP transgenic SSCs (I) emitting GFP fluorescence (II) under UV light. III–V, Cytogenetic analysis by G-band staining showing that some mature oocytes from SSCs had a karyotype of 20, Y. III: An example of 20, Y in mature oocytes derived from pou5f1/GFP transgenic SSCs. Arrow indicates the Y chromosome. IV: Example of 20, X in mature oocytes derived from pou5f1/GFP transgenic SSCs. V: Representative karyotype (20, X) of wild-type mature oocytes. VI, PCR analysis of Sry. M, 100 bp DNA marker; lane 1, SSCs; lane 2, mature oocytes derived from pou5f1/GFP transgenic SSCs; lane 3, wild-type mature oocytes; lane 4, mock. (E) Example of offspring from POF recipient mice transplanted with pou5f1/GFP transgenic SSCs (I) and an example of a Southern blot of tail DNA (II). Genomic DNA was digested with EcoRI. Marker sizes are indicated to the right of the blot. Lanes 1, 3, 5, and 7: transgenic mice; lanes 2, 4, 6, and 8: wild-type mice. (F) SSLP analysis of parents and their offspring mice through SSLP markers. M: DNA marker; lane 1: donor SSCs; lane 2: female recipients (POF); lane 3: mated males (C57BL/6); lanes 4–11: offspring from eight corresponding recipients females. Scale bars, 50 μm (A I, III, IV), 100 μm (A II), 25 μm (B I, II), 10 μm (D I, II).
Fig. 2
Fig. 2
Tracking of transplanted SSCs in recipient ovaries. (A) Transplanted SSCs from pou5f1/GFP transgenic mice were monitored by confocal laser scanning microscopy at 2 h, and 2, 3, 4, 5, 6, 9, 12, and 15 days after transplantation into recipient ovaries. (B) Gene expression dynamics during oogenesis in transplanted cells at 4, 6, 9, and 15 days after transplantation. (C) Dual immunofluorescence analysis of MVH and GFP expression in transplanted cells at 2, 3, 4, 5, 6, 9, 12, and 15 days after transplantation. Scale bars, 50 μm.
Fig. 3
Fig. 3
Methylation status and gene expression dynamics of transplanted SSCs in recipient ovaries. (A-D), Methylation status of H19 (A, C) and Peg10 (B, D) DMRs in SSCs at 0 and 2 h, and 2, 3, 4, 5, 6, 9, 12, and 15 days after transplantation. DNA methylation levels were analyzed by bisulfite sequencing. Black circles represent methylated cytosine-guanine sites (CpGs), and white circles represent unmethylated CpGs. The percentage of methylated CpG sites is shown in (C) and (D). (E) Gene expression dynamics in transplanted SSCs at 0 and 2 h, 2, 3, 4, 5, 6, 9, and 15 days after transplantation.
Fig. 4
Fig. 4
Characterization of induced germline stem cells derived from SSCs in vitro. (A) Morphology and immunofluorescence detection of MVH and GFP in cultured induced germline stem cells(iGSCs) and FGSCs. I, II, Representative morphology of cultured iGSCs under brightfield (I) and fluorescence (II) microscopies. III, IV, Representative view of cultured FGSCs under brightfield (III) and fluorescence (IV) microscopies. V–VII, Cultured iGSCs were positive for EGFP (V) and MVH (VI) staining. Cells were counterstained with DAPI (VII). VIII, Merge of EGFP, MVH, and DAPI staining. IX–XI, Cultured FGSCs were positive for EGFP (IX) and MVH staining (X). Cells were counterstained with DAPI (XI). XII, Merge of EGFP, MVH, and DAPI staining. (B) RT-PCR analysis of germ cell or germline stem cell markers in SSCs, iGSCs, and FGSCs. Lane M, 250 bp DNA marker; lane 1, SSCs, lane 2, iGSCs, lane 3, FGSCs, lane 4, STO, lane 5, no template control. (C) Genomic view of the DNA methylation pattern defined by MeDIP-seq in the IGV (Integrative Genomics Viewer) genome browser and DNA methylation status of imprinting gene Igf2r in SSCs, iGSCs, and FGSCs. (D) Pairwise correlation comparison of genome-wide DNA methylation among SSCs, iGSCs, and FGSCs. R values (Pearson correlation coefficient) were used to compare the significant correlation both within and between groups and is represented by a color scale. (E) Heat map showing expression profiles of genes among SSCs, iGSCs, and FGSCs. The maps were based on the expression values of all expressed genes detected by high-throughput sequencing. The color scale indicates the expression values. The intensity increases from green to red. Each column represents one sample, and each row represents a transcript. (F) RNA-seq read density over imprinting gene Igf2r in SSCs, iGSCs, and FGSCs. Scale bars, 50 μm (A I-IV), 20 μm (A V-XII).
Fig. 5
Fig. 5
Reorganization of the chromosome structure during SSC conversion to iGSCs. (A) Contact matrices from chromosome 16 in SSCs, iGSCs, and FGSCs. (B) First principal component (PC1) value and normalized Hi-C interaction heat maps at a 40 kb resolution in SSCs, iGSCs, and FGSCs. The PC1 value was used to indicate the A/B compartment status, where a positive PC1 value represents the A compartment (blue) and a negative value represents the B compartment (yellow). Dashed lines indicate TAD boundaries in SSCs. (C) Hieratical clustering of PC1 values for the A/B compartment status in SSCs, iGSCs, and FGSCs. (D) Expression of genes that changed compartment status (“A to B” or “B to A”) or remained the same (“stable”) compared with SSCs (P-value by Wilcoxon’s test). (E) IGV snapshot of Dppa3 (Stella) showing concordance between its expression and PC1 values. (F) Relative MeDIP-seq signal that changed compartment status (“A to B” or “B to A”) or remained the same (“stable”) compared with SSCs (P-value by Wilcoxon’s test). ***p < 0.0001.
Fig. 6
Fig. 6
In vitro production of functional oocyte from iGSCs. (A) Ovarian organoid formation and development. Representative ovarian organoids with a merge of bright field and fluorescence. Up, Ovarian organoids or co-cultures with somatic cells of gonad and iGSCs at 3 days, 2 weeks, and 3 weeks. Down: Images of aggregates formed by somatic cells of gonads and SSCs at 3 days, 2 weeks, and 3 weeks. (B) Trends of progesterone and estradiol in the medium of ovarian organoids with a different time-course. (C) Follicle growth in vitro. Representative follicles isolated from ovarian organoids formed by somatic cells of gonads and iGSCs at 0 days, 2 days, 7 days, 11 days, and Cumulus-oocytes complexes (COC) derived from iGSCs before in vitro maturation. (D) Representative views of each stage of meiotic prophase I during ovarian organoid development after stained with anti-SYCP3 and -H2AX antibodies. Scale bars, 100 μm (A), 20 μm (C 0 day, 2 days and 7 days), 40 μm (C 11 days), 50 μm (C COC), 5 μm (D).
Fig. 7
Fig. 7
Offspring production of functional oocytes from iGSC differentiation in vitro. (A) Mature oocytes from derived iGSCs after in vitro maturation. (B) The percentage of mature cumulus-oocyte complexes derived from iGSCs. Control, the immature oocytes from wild-type mice. (C) The percentage of fertilization of iGSC-derived MII oocytes. Control, MII oocytes from immature oocytes of wild type mice after in vitro maturation. (D) Two-cell embryos derived from iGSCs after in vitro fertilization. (E) Representative offspring derived from iGSC. (F) Number of offspring derived from iGSCs per litter. (G) Offspring were identified by Southern blotting. Lanes 1–4, offspring derived from iGSCs, lane W, wild-type mice. (H) Offspring were identified by fluorescence. Lanes 1–4, offspring derived from iGSCs, lane W, wild-type mice. Scale bars: 50 μm.

Similar articles

Cited by

References

    1. Lieberman-Aiden E., van Berkum N.L., Williams L., Imakaev M., Ragoczy T., Telling A. Comprehensive mapping of long-range interactions reveals folding principles of the human genome. Science. 2009;326:289–293. - PMC - PubMed
    1. Smallwood A., Ren B. Genome organization and long-range regulation of gene expression by enhancers. Curr Opin Cell Biol. 2013;25:387–394. - PMC - PubMed
    1. Gorkin D.U., Leung D., Ren B. The 3D genome in transcriptional regulation and pluripotency. Cell Stem Cell. 2014;14:762–775. - PMC - PubMed
    1. Ke Y., Xu Y., Chen X., Feng S., Liu Z., Sun Y. Cell. 2017;170:367–381 e320. - PubMed
    1. Battulin N., Fishman V.S., Mazur A.M., Pomaznoy M., Khabarova A.A., Afonnikov D.A. Comparison of the three-dimensional organization of sperm and fibroblast genomes using the Hi-C approach. Genome Biol. 2015;16:77. - PMC - PubMed

Publication types