. 2021 Feb 9:33:153-165.
doi: 10.1016/j.jare.2021.01.018. eCollection 2021 Nov.

Diagnosis and prognosis models for hepatocellular carcinoma patient's management based on tumor mutation burden

Affiliations

Diagnosis and prognosis models for hepatocellular carcinoma patient's management based on tumor mutation burden

Bufu Tang et al. J Adv Res. .

Abstract

Introduction: The development and prognosis of HCC involve complex molecular mechanisms, which affect the effectiveness of its treatment strategies. Tumor mutational burden (TMB) is related to the efficacy of immunotherapy, but the prognostic role of TMB-related genes in HCC has not yet been determined clearly.

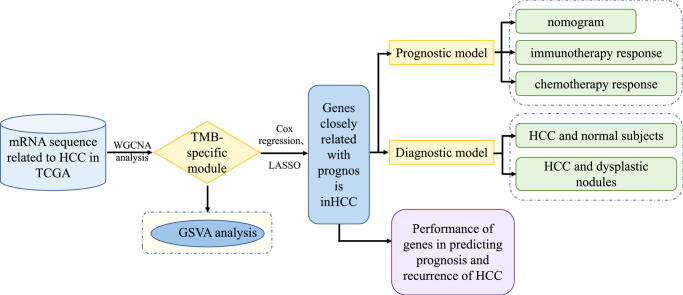
Objectives: In this study, we identified TMB-specific genes with good prognostic value to build diagnostic and prognostic models and provide guidance for the treatment of HCC patients.

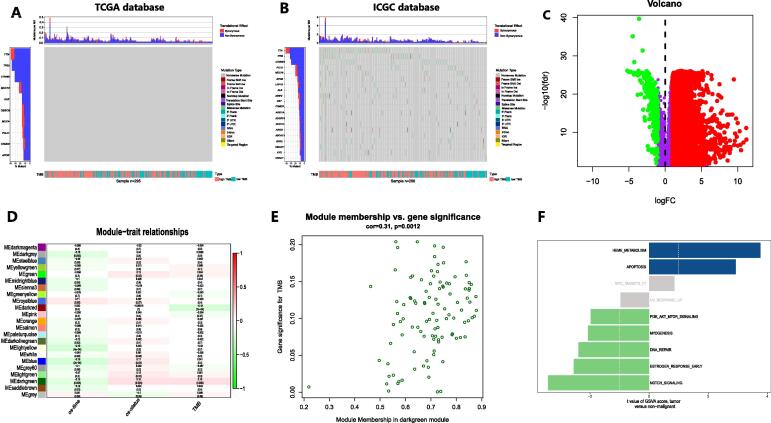
Methods: Weighted gene co-expression network analysis (WGCNA) was applied to identify the TMB-specific genes. And LASSO method and Cox regression were used in establishing the prognostic model.

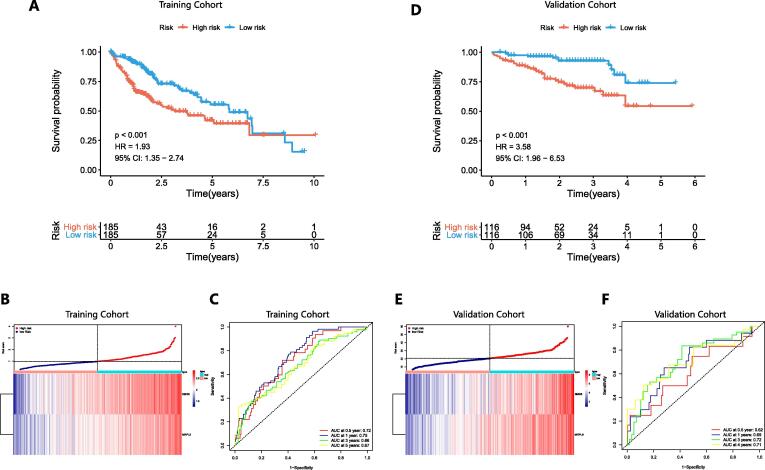
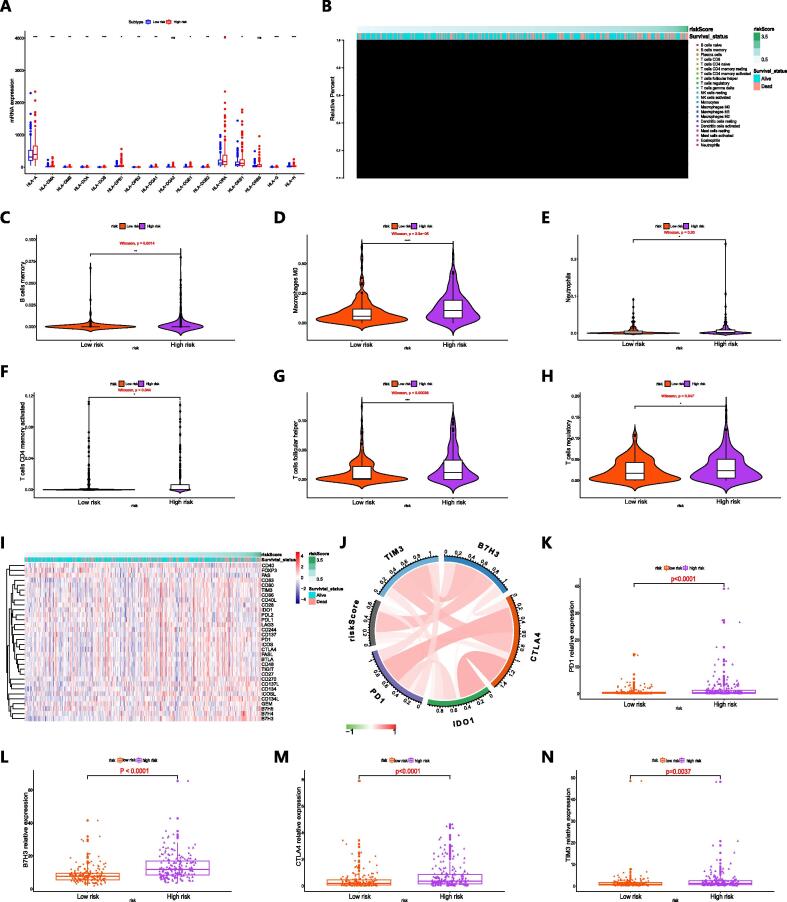
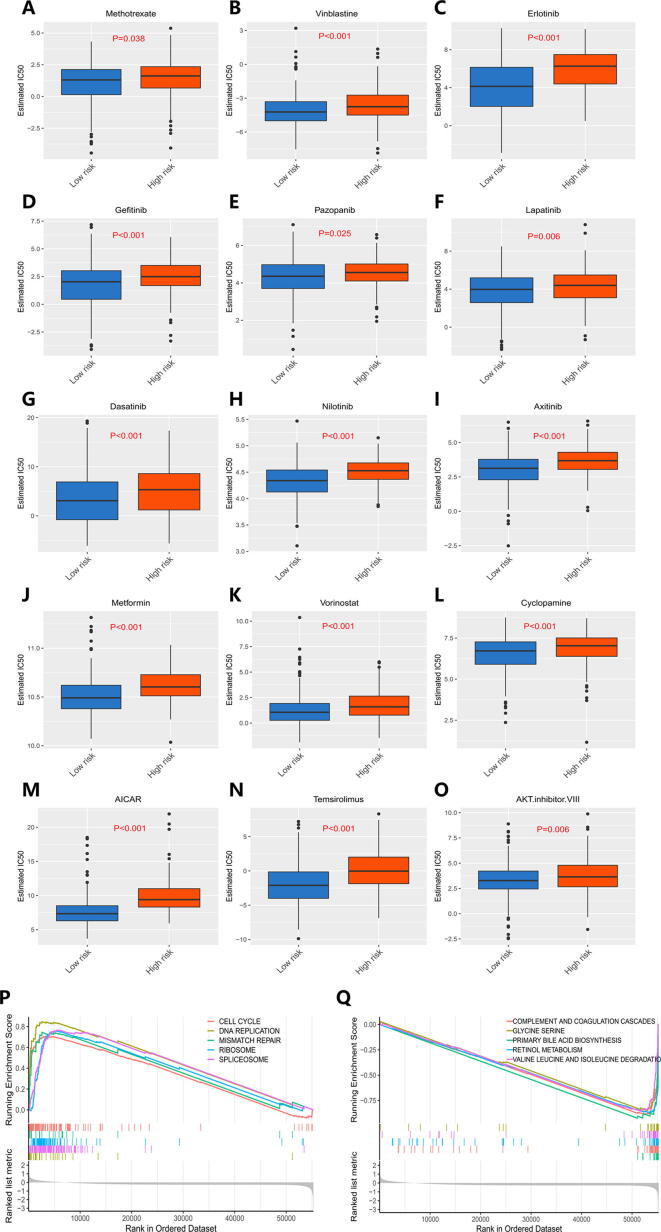
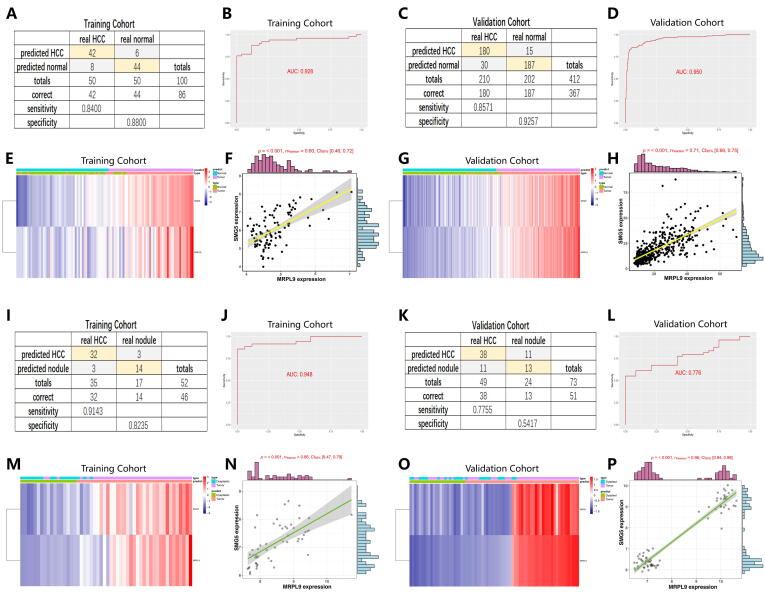
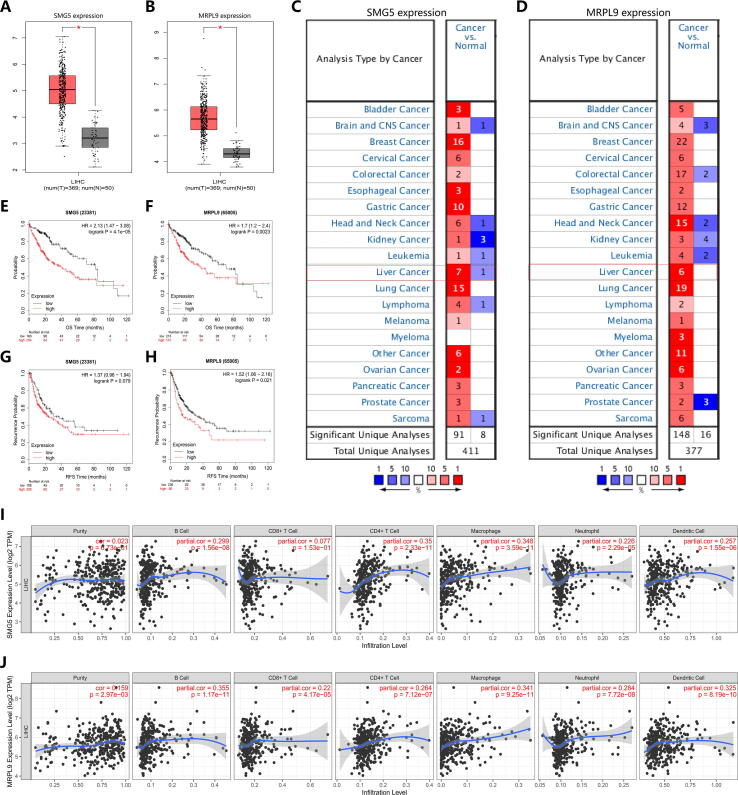
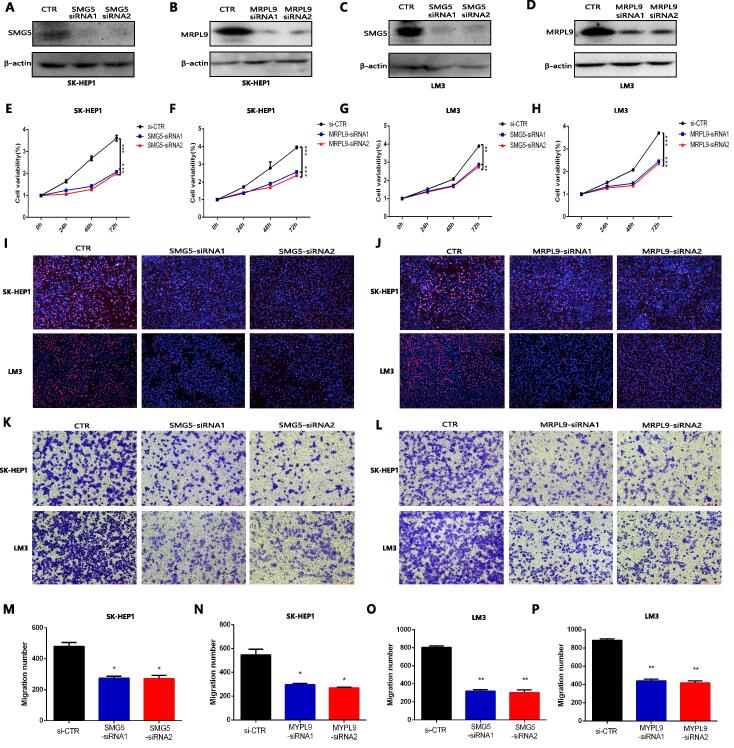
Results: The prognostic model based on SMG5 and MRPL9 showed patients with higher prognostic risk had a remarkedly poorer survival probability than their counterparts with lower prognostic risk in both a TCGA cohort (P < 0.001, HR = 1.93) and an ICGC cohort (P < 0.001, HR = 3.58). In addition, higher infiltrating fractions of memory B cells, M0 macrophages, neutrophils, activated memory CD4 + T cells, follicular helper T cells and regulatory T cells and higher expression of B7H3, CTLA4, PD1, and TIM3 were present in the high-risk group than in the low-risk group (P < 0.05). Patients with high prognostic risk had higher resistance to some chemotherapy and targeted drugs, such as methotrexate, vinblastine and erlotinib, than those with low prognostic risk (P < 0.05). And a diagnostic model considering two genes was able to accurately distinguish patients with HCC from normal samples and those with dysplastic nodules. In addition, knockdown of SMG5 and MRPL9 was determined to significantly inhibit cell proliferation and migration in HCC.

Conclusion: Our study helps to select patients suitable for chemotherapy, targeted drugs and immunotherapy and provide new ideas for developing treatment strategies to improve disease outcomes in HCC patients.

Keywords: Diagnosis; Hepatocellular carcinoma (HCC); Immune checkpoint; Prognosis; TMB.


Conflict of interest statement

The authors declare that the research was conducted in the absence of any commercial or financial relationships that could be construed as a potential conflict of interest.

Figures

None
Graphical abstract
Fig. 1
Fig. 1
Identification of DEGs affecting TMB in HCC. A and B Characteristics of TMB for the TCGA HCC cohort (A) and ICGC HCC cohort (B). C DEGs in the TCGA HCC cohort. D Modules with different traits identified via WGCNA. E Determination of genes in the HCC TMB-specific module. F GSVA for genes in the HCC TMB-specific module.
Fig. 2
Fig. 2
Survival analysis results, distribution of risk scores, and predictive performance in the training set (A-C) and validation set (D-F). A and D K-M curves showing the prognosis differences between the high-risk and low-risk groups. B and E Distribution of prognostic risk and expression of SMG5 and MRPL9 in patients with HCC. C and F ROC curves for validating the specificity and sensitivity of the prognosis model.
Fig. 3
Fig. 3
The independence of the prognosis model its correlation with clinical pathological features in prognosis prediction. A Forest map showing independent predictive factors for prognosis in HCC. B Nomogram for predicting the survival probability in HCC patients at 1, 3 and 5 years. C-E Calibration charts for validating the predictive accuracy of the 1-year, 3-year, and 5-year survival probabilities of the nomogram. F-H ROC curves comparing the predicted performance of the nomogram and single independent predictive factors. I-K Evaluation of the clinical benefits that the nomogram can achieve.
Fig. 4
Fig. 4
The correlation between immune cell infiltration and the expression of immune checkpoints and prognostic model components. A HLA subtype expression in high-risk and low-risk patients. B Distribution of prognostic risk and immune cell infiltration within tumor tissues in patients with HCC. C-H Violin charts revealing the relationship between the fraction of immune cells and prognostic risk score (C memory B cells; D M0 macrophages; E neutrophils; F activated memory CD4 T cells; G follicular helper T cells; H regulatory T cells). I Distribution of prognostic risk score and immune checkpoint expression in patients with HCC. J The association between prognosis risk and immune checkpoints. K-N Column charts showing the expression of immune checkpoints in high-risk and low-risk patients (K PD1; L B7H3; M CTLA4; N TIM3).
Fig. 5
Fig. 5
Response of HCC patients to chemotherapy drugs. A-O Differences in response to chemotherapy drugs between high-risk and low-risk patients. P Top 5 signaling pathways positively regulated by the TMB-specific prognostic model. Q Top 5 signaling pathways negatively regulated by the TMB-specific prognostic model.
Fig. 6
Fig. 6
A diagnostic model for differentiating HCC from normal (A-H) and dysplastic nodule (I-P) samples. A and C Confusion matrix of the binary results in the diagnostic model for distinguishing HCC and normal subjects. B and D ROC curves confirming the predictive accuracy of the diagnostic model. E and G Expression levels of SMG5 and MRPL9 in patients with HCC: distribution of the predicted results and actual results. F and H The correlation between the expression of SMG5 and MRPL9. I and K The specificity and sensitivity of the diagnostic model for distinguishing HCC lesions from dysplastic nodules. J and L ROC curves validating the predictive performance of the diagnostic model. M and O Expression characteristics of SMG5 and MRPL9 in patients with HCC: distribution of the predicted results and actual results. N and P Positive correlation of SMG5 and MRPL9 expression levels.
Fig. 7
Fig. 7
The value of SMG5 and MRPL9 in predicting the prognosis and recurrence of HCC. A-B The expression of SMG5 (A) and MRPL9 (B) as assessed in Oncomine. C-D The expression of SMG5 (C) and MRPL9 (D) as assessed in GEPIA. E-F Survival analysis for SMG5 (E) and MRPL9 (F). G-H Recurrence analysis for SMG5 (G) and MRPL9 (H). I-J The correlation of the expression of SMG5 (I) and MRPL9 (J) with the infiltration of different immune cells.
Fig. 8
Fig. 8
The effect of SMG5 and MRPL9 on the progression of HCC. A–D Western blot analysis confirmed that the expression of SMG5 and MRPL9 was inhibited by SMG5 and MRPL9 siRNA administration. E-H CCK8 assay indicated that SMG5 and MRPL9 inhibition significantly suppressed the proliferation of SK-HEP1 cells (E-F) and LM3 cells (G-H). I-J EdU assay revealed that SMG5 and MRPL9 inhibition showed a significant inhibitory effect on the proliferation of SK-HEP1 cells and LM3 cells, respectively. K-L Transwell migration assays confirmed that SMG5 and MRPL9 inhibition obviously inhibited the migration of SK-HEP1 cells and LM3 cells. M−P Quantitative statistical results of the effects of SMG5 and MRPL9 expression on the migration of SK-HEP1 cells (M−N) and LM3 cells (O-P). Data are shown as the mean ± SD of at least three independent experiments. *P < 0.05, **P < 0.01, ***P < 0.001.

Similar articles

Cited by

References

    1. Yang J.D., Hainaut P., Gores G.J., Amadou A., Plymoth A., Roberts L.R. A global view of hepatocellular carcinoma: trends, risk, prevention and management. Nat Rev Gastroenterol Hepatol. 2019;16:589–604. - PMC - PubMed
    1. Forner A., Reig M., Bruix J. Hepatocellular carcinoma. Lancet (London, England) 2018;391:1301–1314. - PubMed
    1. Aravalli R.N., Steer C.J., Cressman E.N. Molecular mechanisms of hepatocellular carcinoma. Hepatology (Baltimore, MD) 2008;48:2047–2063. - PubMed
    1. Farazi P.A., DePinho R.A. Hepatocellular carcinoma pathogenesis: from genes to environment. Nat Rev Cancer. 2006;6:674–687. - PubMed
    1. Weston A.D., Hood L. Systems biology, proteomics, and the future of health care: toward predictive, preventative, and personalized medicine. J Proteome Res. 2004;3:179–196. - PubMed

Publication types