. 2021 Sep 13:9:e12132.
doi: 10.7717/peerj.12132. eCollection 2021.

Sex- and stage-dependent expression patterns of odorant-binding and chemosensory protein genes in Spodoptera exempta

Affiliations

Sex- and stage-dependent expression patterns of odorant-binding and chemosensory protein genes in Spodoptera exempta

Yonghao Dong et al. PeerJ. .

Abstract

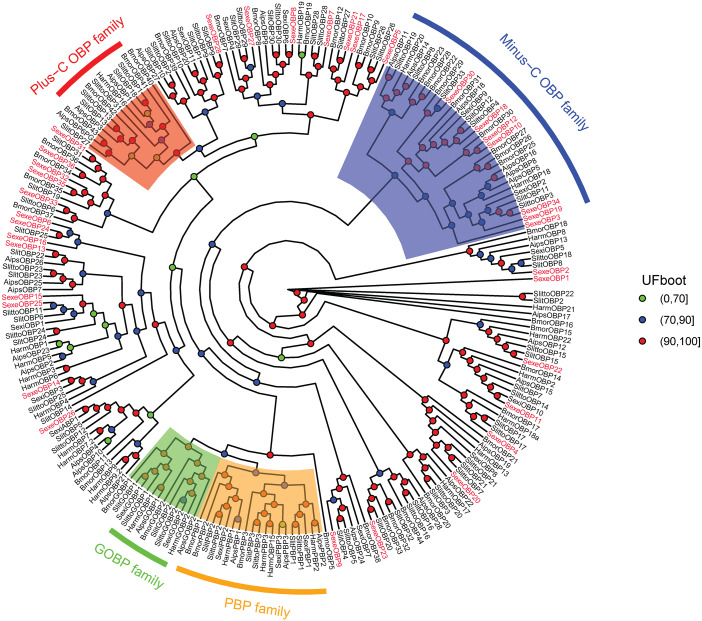
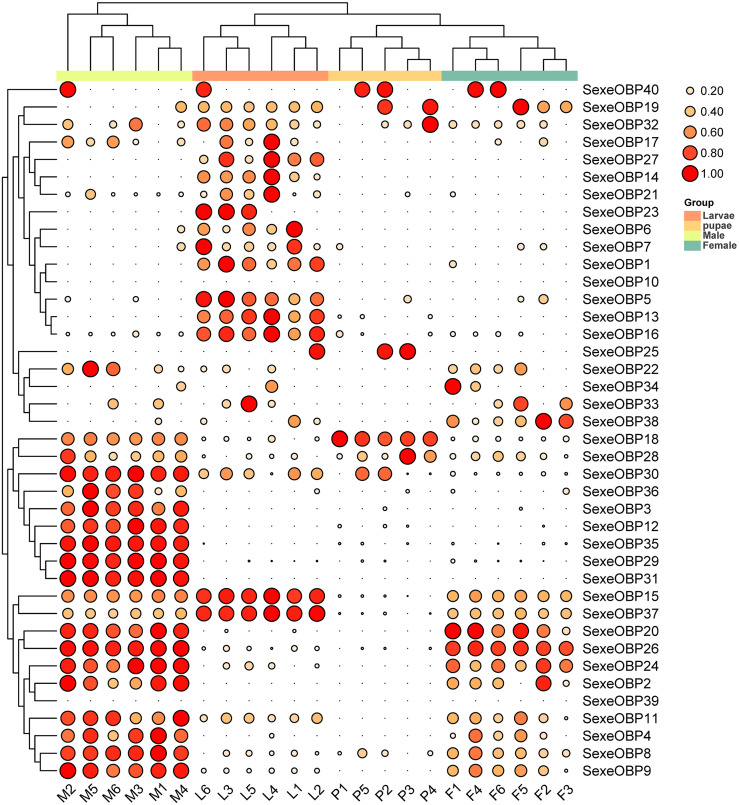
As potential molecular targets for developing novel pest management strategies, odorant-binding proteins (OBPs) and chemosensory proteins (CSPs) have been considered to initiate odor recognition in insects. Herein, we investigated the OBPs and CSPs in a major global crop pest (Spodoptera exempta). Using transcriptome analysis, we identified 40 OBPs and 33 CSPs in S. exempta, among which 35 OBPs and 29 CSPs had intact open reading frames. Sequence alignment indicated that 30 OBPs and 23 CSPs completely contained the conserved cysteines. OBPs of lepidopteran insects usually belonged to classical, minus-C, and plus-C groups. However, phylogenetic analyses indicated that we only identified 28 classical and seven minus-C OBPs in S. exempta, suggesting that we might have missed some typical OBPs in lepidopteran insects, probably due to their low expression levels. All of the CSPs from S. exempta clustered with the orthologs of other moths. The identification and expression of the OBPs and CSPs were well studied in insect adults by transcriptional analyses, and herein we used samples at different stages to determine the expression of OBPs and CSPs in S. exempta. Interestingly, our data indicated that several OBPs and CSPs were especially or more highly expressed in larvae or pupae than other stages, including three exclusively (SexeOBP13, SexeOBP16 and SexeCSP23) and six more highly (SexeOBP15, SexeOBP37, SexeCSP4, SexeCSP8, SexeCSP19, and SexeCSP33) expressed in larvae, two exclusively (SexeCSP6 and SexeCSP20) and three more highly (SexeOBP18, SexeCSP17, and SexeCSP26) expressed in pupae. Usually, OBPs and CSPs had both male- and female-biased expression patterns in adult antennae. However, our whole-body data indicated that all highly expressed OBPs and CSPs in adults were male-biased or did not differ, suggesting diverse OBP and CSP functions in insect adults. Besides identifying OBPs and CSPs as well as their expression patterns, these results provide a molecular basis to facilitate functional studies of OBPs and CSPs for exploring novel management strategies to control S. exempta.

Keywords: Chemosensory protein; Gene expression; Odorant-binding protein; Spodoptera exempta; Transcriptome.


Conflict of interest statement

The authors declare there are no competing interests.

Figures

Figure 1
Figure 1. Amino acid sequence alignment of odorant-binding proteins (OBPs) with intact open reading frames in Spodoptera exempta.
Yellow boxes show the conserved cysteines. The members of minus-c OBP family are highlighted.
Figure 2
Figure 2. Amino acid sequence alignment of chemosensory proteins (CSPs) with intact open reading frames in Spodoptera exempta.
Yellow boxes show the conserved cysteines.
Figure 3
Figure 3. The distribution pattern and SeqLogo of the protein motifs in Spodoptera exempta odorant-binding proteins (OBPs).
The x-axis of motif distribution pattern indicates the length of OBP proteins. The SeqLogo of motifs are visualized by TBtools.
Figure 4
Figure 4. The distribution pattern and SeqLogo of the protein motifs in Spodoptera exempta chemosensory proteins (CSPs).
The x-axis of motif distribution pattern indicates the length of CSP proteins. The SeqLogo of motifs are visualized by TBtools.
Figure 5
Figure 5. Maximum likelihood tree of lepidopteran odorant-binding proteins (OBPs).
The protein names and sequences of the OBPs used here are listed in Supplemental Information 13 and the reference (Gu et al., 2015). In total, 228 OBPs are used, including 35 Spodoptera exempta OBPs, 43 Bombyx mori OBPs, 38 Spodoptera litura OBPs, 36 Spodoptera littoralis OBPs, 26 Helicoverpa armigera OBPs, 17 Spodoptera exigua OBPs, and 33 Agrotis ipsilon OBPs.
Figure 6
Figure 6. Maximum likelihood tree of lepidopteran chemosensory proteins (CSPs).
The protein names and sequences of the CSPs used here are listed in Supplemental Information 16 and the reference (Li et al., 2020). In total, 107 CSPs are used, including 29 Spodoptera exempta CSPs, 15 Plutella xylostella CSPs, 13 Papilio xuthus CSPs, 6 Helicoverpa armigera CSPs, 20 Cnaphalocrocis medinalis CSPs, and 24 Bombyx mori CSPs.
Figure 7
Figure 7. The gene expression patterns among the developmental stages in Spodoptera exempta.
(A) Principal component analysis (PCA) analysis of gene expression at different life stages. The gene expression matrix among the samples are used in PCA, and then visualized by stats R package. (B) Venn diagram showing the number of genes expressed at different life stages.
Figure 8
Figure 8. Expression patterns of odorant-binding proteins (OBPs) among different developmental stages in Spodoptera exempta based on the transcripts per million tags (TPM) values.
The TPM values were normalized by the logarithmic scale with base 2, and then scaled by row. The color and size of the circle indicates the gene expression level. Darker colors and larger circles indicate the genes were highly expressed in the samples. The heatmap was visualized by TBtools.
Figure 9
Figure 9. Expression patterns of chemosensory proteins (CSPs) among the different developmental stages in Spodoptera exempta based on the transcripts per million tags (TPM) values.
The TPM values were normalized by a logarithmic scale with base 2 and then scaled by row. The color and size of a circle indicates the gene expression level. Darker colors and larger circles indicate the genes were highly expressed in the samples. The heatmap was visualized by TBtools.

Similar articles

Cited by

References

    1. Bailey TL, Boden M, Buske FA, Frith M, Grant CE, Clementi L, Ren J, Li WW, Noble WS. MEME SUITE: tools for motif discovery and searching. Nucleic Acids Research. 2009;37(Web Server issue):W202–W208. doi: 10.1093/nar/gkp335. - DOI - PMC - PubMed
    1. Brito NF, Moreira MF, Melo AC. A look inside odorantbinding proteins in insect chemoreception. Journal of Insect Physiology. 2016;95:51–56. doi: 10.1016/j.jinsphys.2016.09.008. - DOI - PubMed
    1. Campanini EB, De Brito RA. Molecular evolution of odorant-binding proteins gene family in two closely related Anastrepha fruit flies. BMC Evolutionary Biology. 2016;16:198. doi: 10.1186/s12862-016-0775-0. - DOI - PMC - PubMed
    1. Chen CJ, Chen H, Zhang Y, Thomas HR, Frank MH, He YH, Xia R. TBtools: an integrative toolkit developed for interactive analyses of big biological data. Molecular Plant. 2000;13:1194–1202. - PubMed
    1. Cook SM, Khan ZR, Pickett JA. The use of push-pull strategies in integrated pest management. Annual Review of Entomology. 2007;52:375–400. doi: 10.1146/annurev.ento.52.110405.091407. - DOI - PubMed