

Capturing spatial dependence of COVID-19 case counts with cellphone mobility data
- PMID: 34603946
- PMCID: PMC8479517
- DOI: 10.1016/j.spasta.2021.100540
Capturing spatial dependence of COVID-19 case counts with cellphone mobility data
Abstract
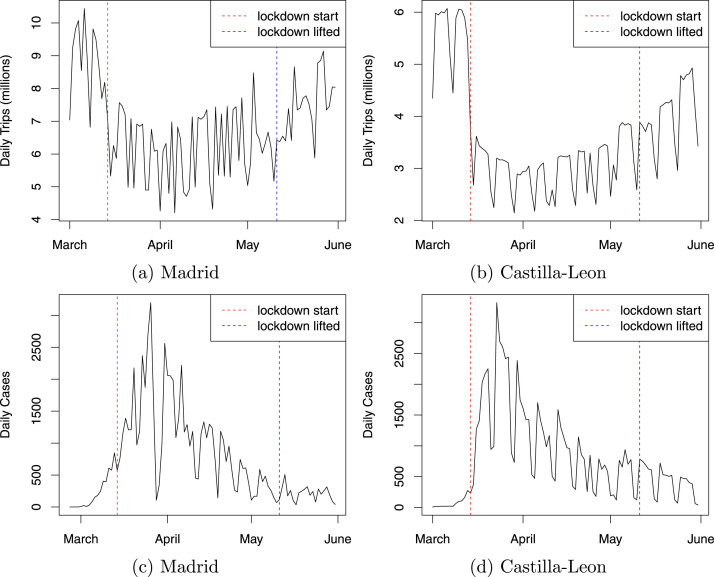
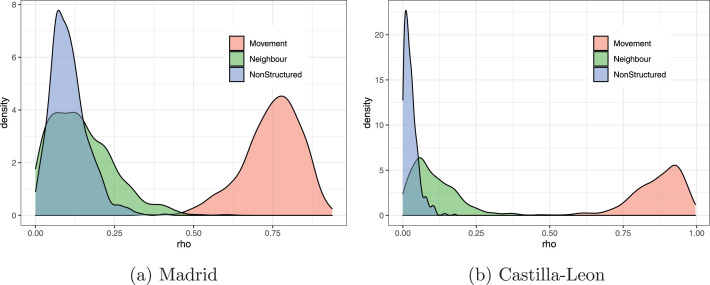
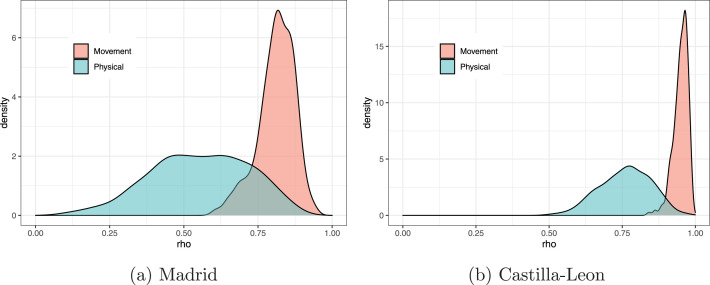
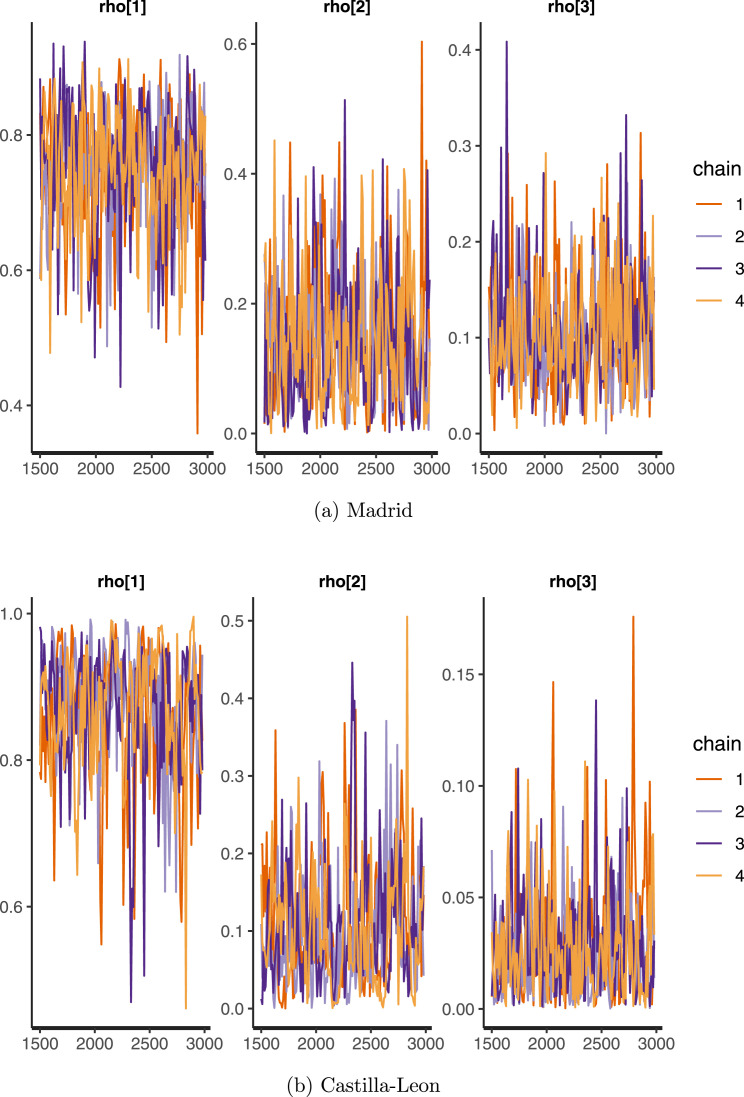
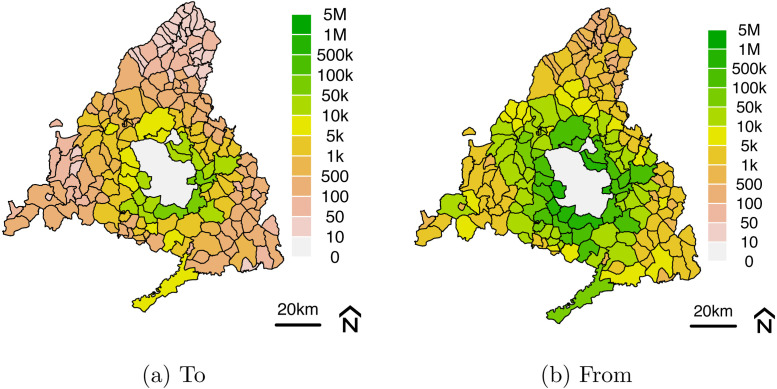
Spatial dependence is usually introduced into spatial models using some measure of physical proximity. When analysing COVID-19 case counts, this makes sense as regions that are close together are more likely to have more people moving between them, spreading the disease. However, using the actual number of trips between each region may explain COVID-19 case counts better than physical proximity. In this paper, we investigate the efficacy of using telecommunications-derived mobility data to induce spatial dependence in spatial models applied to two Spanish communities' COVID-19 case counts. We do this by extending Besag York Mollié (BYM) models to include both a physical adjacency effect, alongside a mobility effect. The mobility effect is given a Gaussian Markov random field prior, with the number of trips between regions as edge weights. We leverage modern parametrizations of BYM models to conclude that the number of people moving between regions better explains variation in COVID-19 case counts than physical proximity data. We suggest that this data should be used in conjunction with physical proximity data when developing spatial models for COVID-19 case counts.
Keywords: Bayesian hierarchical model; Besag York Mollié model; COVID-19; Gaussian Markov random field; Mobility data.
© 2021 Elsevier B.V. All rights reserved.
Conflict of interest statement
The authors declare that they have no known competing financial interests or personal relationships that could have appeared to influence the work reported in this paper.
Figures
References
-
- Anon . 2021. Epidemiological surveillance network of madrid. https://datos.gob.es. (Accessed 10 Jan 2021)
-
- Aràndiga F., Baeza A., Cordero-Carrión I., Donat R., Martí M.C., Mulet P., Yáñez D.F. A spatial-temporal model for the evolution of the COVID-19 pandemic in Spain including mobility. Mathematics. 2020;8(10):1677.
LinkOut - more resources
Full Text Sources