. 2021 Oct;11(10):4287-4298.
doi: 10.21037/qims-21-217.

Ultra-high resolution computed tomography of joints: practical recommendations for acquisition protocol optimization

Affiliations

Ultra-high resolution computed tomography of joints: practical recommendations for acquisition protocol optimization

Pedro Augusto Gondim Teixeira et al. Quant Imaging Med Surg. 2021 Oct.

Abstract

Background: To assess the influence on the spatial resolution of various Ultra-high-resolution computed tomography (CT) parameters and provide practical recommendations for acquisition protocol optimization in musculoskeletal imaging.

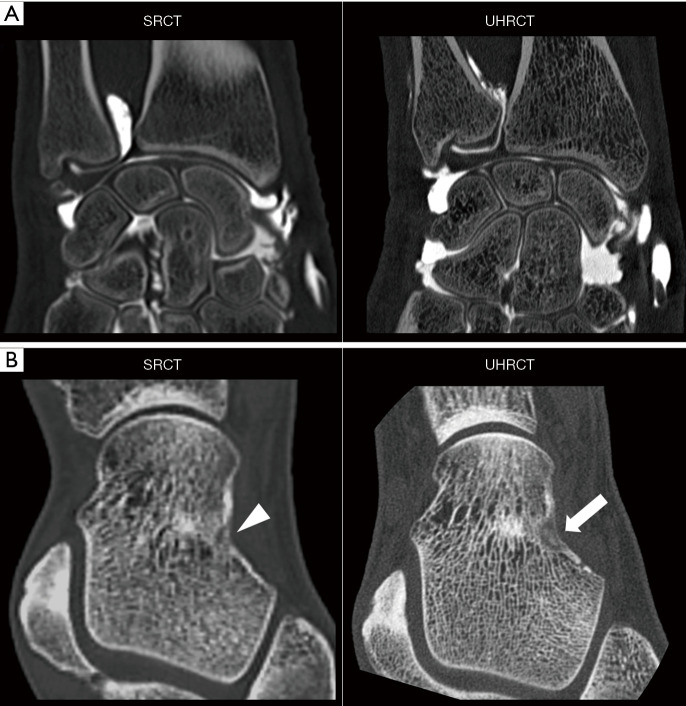
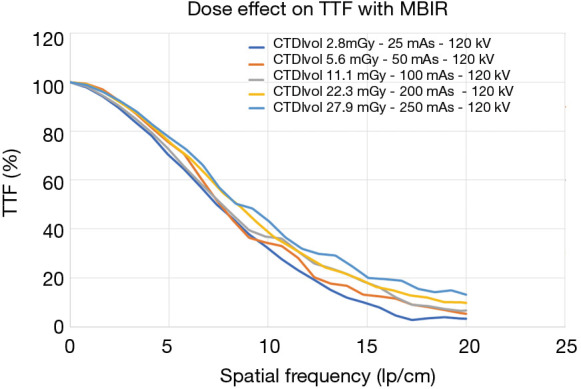
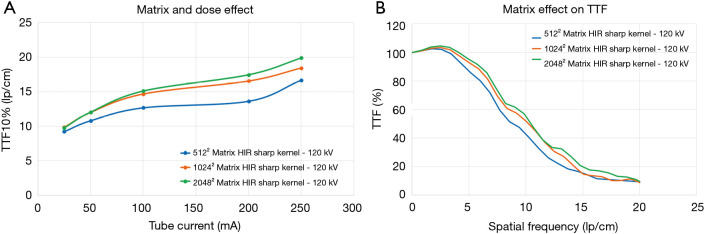
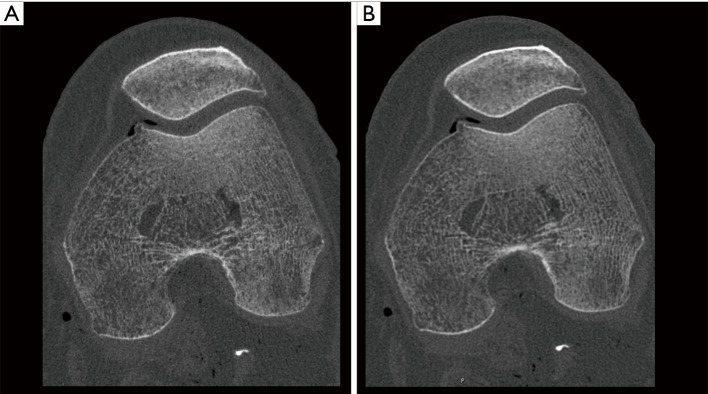
Methods: All acquisitions were performed with an Ultra-high resolution scanner, and variations of the following parameters were evaluated: field-of-view (150-300 mm), potential (80-140 KVp), current (25-250 mAs), focal spot size (0.4×0.5 to 0.8×1.3 mm2), slice thickness (0.25-0.5 mm), reconstruction matrix (512×512 to 2048×2048), and iso-centering (up to 85 mm off-center). Two different image reconstruction algorithms were evaluated: hybrid iterative reconstruction (HIR) and model-based iterative reconstruction (MBIR). CATPHAN 600 phantom images were analyzed to calculate the number of visible line pairs per centimeter (lp/cm). Task transfer function (TTF) curves were calculated to quantitatively evaluate spatial resolution. Cadaveric knee acquisitions were also performed.

Results: Under the conditions studied, the factor that most intensely influenced spatial resolution was the matrix size (additional visualization of up to 8 lp/cm). Increasing the matrix from 512×512 to 2048×2048 led to a 28.2% increase in TTF10% values with a high-dose protocol and a 5.6% increase with a low-dose protocol with no change in the number of visually distinguishable line pairs. The second most important factor affecting spatial resolution was the tube output (29.6% TTF10% gain and 5 additional lp/cm visualized), followed by the reconstruction algorithm choice and lateral displacement (both with a 4 lp/cm gain). Decreasing the slice thickness from 0.5 to 0.25 mm, led to an increase of 3 lp/cm (from 17 to 20 lp/cm) and a 17.3% increase in TTF10% values with no change in the "in-plane" spatial resolution.

Conclusions: This study provides practical recommendations for spatial resolution optimization using Ultra-high-resolution CT.

Keywords: Computed tomography (CT); musculoskeletal imaging; radiation dose; recommendations; spatial resolution.


Conflict of interest statement

Conflicts of Interest: All authors have completed the ICMJE uniform disclosure form (available at http://dx.doi.org/10.21037/qims-21-217). Two authors involved in this work (P.A.G.T and A.B.) participate in a non-remunerated research contract with Canon Medical Systems, manufacturer of the CT scanner used in this study. The other authors have no conflicts of interest to disclose.

Figures

Figure 1
Figure 1
Two examples of the potential clinical impact of UHRCT images for the evaluation of peripheral joints. (A) Comparison between wrist CT arthrography images obtained in a conventional SRCT scanner (120 KVp, 50 mA 512×512 matrix, FOV 15 cm, 1.5 mm, HIR) and a UHRCT scanner 120 KVp, 65 mA 1,024×1,024 matrix, 0.4 mm slice thickness, FOV 14 cm, HIR reconstruction) in two patients with post-traumatic wrist pain. Images are presented in the coronal plane with 1,900 WW and 4,900 WL after a tricompartimental iodinated contrast injection. (B) Comparison between calf CT arthrography images showing an osteoid osteoma of the talus obtained in a conventional SRCT scanner (100 KVp, 150 mA, 512×512 matrix, FOV 29 cm, 0.6 mm slice thickness, and HIR reconstruction) and a UHRCT scanner (120 KVp, 170 mA, 1,024×1,024 matrix, 0.25 mm slice thickness, FOV 7 cm, and HIR reconstruction). Images are presented in the axial plane with 600 WW and 2400 WL. Note the clear gain in spatial resolution on the UHRCT image with a clearer identification of bone trabeculae and articular cartilage surface in (A) and a better depiction of the osteoid osteoma nidus and central calcification in (B) (arrowhead in the SRCT image and arrow in the UHRCT image). This difference in spatial resolution results from the combined effect of various parametric differences in the acquisition protocol. CT, computed tomography; SRCT, standard resolution CT; UHRCT, ultra-high resolution CT; FOV, field-of-view, KVp, tube potential; mA, tube current; WW, window width; WL, window level; HIR, hybrid iterative reconstruction.
Figure 2
Figure 2
TTF curves showing the effect of a dose increase (CTDIvol-32 cm values presented in the graph legend) on spatial resolution with the following protocol: MBIR, FOV 220 mm, 120 KVp, 1,024×1,024 matrix, 0.5 mm slice thickness, 0.4×0.5 mm2 focal spot size. Note that increasing the dose led to a progressive increase in spatial resolution. TTF, task transfer function; CTDIvol, volumic computed tomography dose index; FOV, field-of-view, KVp, tube potential; mAs, tube current; MBIR, model based iterative reconstruction.
Figure 3
Figure 3
Matrix effects on spatial resolution. (A) Graphic demonstrating the effect of the matrix size and dose to TTF10% values with the following acquisition protocol: HIR with a sharp kernel, 220 mm FOV, 120 KVp, 25–250 mA (CTDIvol-32 cm 2.8–27.9 mGy); 0.5 mm slice thickness, 0.4×0.5 mm2 focal spot size. Note that the greatest benefit of increasing the matrix size was seen in higher dose levels. (B) TTF curves demonstrating the matrix effect on spatial resolution with a CTDIvol-32 cm 27.9 mGy (120 KVp, 250 mA). Note that in general, the spatial resolution gain was slightly higher when the matrix size changed from 512×512 to 1,024×1,024 compared to 1,024×1,024 to 2048×2048. TTF, task transfer function; CTDIvol, volumic computed tomography dose index; FOV, field-of-view, KVp, tube potential; mA, tube current; HIR - hybrid iterative reconstruction.
Figure 4
Figure 4
Cadaveric knee images demonstrating the potential impact acquisition parameter optimization on the bone image aspect. All images are presented in the axial plane with 600 WW and 2,400 WL were acquired with a 180 mm FOV and were reconstructed using a HIR algorithm using a standard bone kernel. (A) UHRCT image acquired with 120 KVp and 115 mA, using a 2048×2048 matrix. (B) UHRCT image acquired with 120 KVp and 60 mA, using a 1,024×1,024 matrix. (C) SRCT image acquired with 120 KVp and 110 mA, using a 512×512 matrix. Note the improvement in the sharpness of bone trabeculae in (A) compared to (B) even though both were acquired with a UHRCT scanner. Note also the improvement in the visualization of bone trabeculae in (B) compared to (C) even though the delivered dose was lower in (B). CT, computed tomography; SRCT, standard resolution CT; UHRCT, ultra-high resolution CT; FOV, field-of-view, KVp, tube potential; mA, tube current; WW, window width; WL, window level; HIR - hybrid iterative reconstruction.
Figure 5
Figure 5
Reconstruction algorithm effect on spatial resolution. (A) Graphic demonstrating the effect of the reconstruction algorithm and dose to TTF10% values. Note that these benefits were most important at low doses. (B) TTF curves for MBIR, HIR with the sharp bone kernel and, HIR with the standard bone kernel with the following acquisition protocol: 220 mm FOV, 50 mA, 120 KVp, CTDIvol-32 cm 5.6 mGy, 0.5 mm slice thickness, 1,024×1,024 matrix, 0.4×0.5 mm2 focal spot. TTF, task transfer function; CTDIvol, volumic computed tomography dose index; FOV, field-of-view, KVp, tube potential; mA, tube current; MBIR, model based iterative reconstruction; HIR, hybrid iterative reconstruction.
Figure 6
Figure 6
Reconstruction algorithm effect on spatial resolution evaluated with high-resolution test gauge in a Catphan 600 with the following protocol: 220 mm FOV, 120 KVp, 250 mA (CTDIvol-32 cm 27.9 mGy); 0.5 mm slice thickness, 1,024×1,024 matrix, 0.4×0.5 mm2 focal spot size. Note the progressive increase in the number of identifiable line pairs from A to B to C. CTDIvol, volumic computed tomography dose index; FOV, field-of-view, KVp, tube potential; mA, tube current; HIR - hybrid iterative reconstruction.
Figure 7
Figure 7
Cadaveric knee images demonstrating the potential impact of the reconstruction algorithm on the bone image aspect. Axial images with 600 WW and 2,400 WL, acquired with a 180 mm FOV, 120 KVp, and 60 mA, were reconstructed with a 1,024×1,024 matrix. (A) UHRCT MBIR image. (B) UHRCT image reconstructed with an HIR algorithm using a standard bone kernel. Note the overall improvement in the sharpness of bone trabeculae in (A) compared to (B). CT, computed tomography UHRCT, ultra-high resolution CT; FOV, field-of-view, KVp, tube potential; mA, tube current; WW, window width; WL, window level; MBIR, model based iterative reconstruction; HIR, hybrid iterative reconstruction.
Figure 8
Figure 8
Slice thickness effect in the “through-plane” spatial resolution evaluated with high-resolution test gauge in a Catphan 600 with the following protocol: 220 mm FOV, 120 KVp, 250 mA (CTDIvol-32 cm 27.9 mGy), 1,024×1,024 matrix, 0.4×0.5 mm2 focal spot size, MBIR, and 0.8 mm reconstruction thickness. (A) Image with an acquisition slice thickness of 0.25 mm. (B) Image with an acquisition slice thickness of 0.25 mm. Note the increase in the number of identifiable line pairs with 0.25 mm slice thickness compared to 0.5 mm. CTDIvol, volumic computed tomography dose index; FOV, field-of-view, KVp, tube potential; mA, tube current; MBIR, model based iterative reconstruction.

Similar articles

Cited by

References

    1. Wildberger JE, Prokop M. Hounsfield’s Legacy. Invest Radiol 2020;55:556-8. 10.1097/RLI.0000000000000680 - DOI - PubMed
    1. Alkadhi H, Euler A.The Future of Computed Tomography: Personalized, Functional, and Precise. Invest Radiol 2020;55:545-55. 10.1097/RLI.0000000000000668 - DOI - PubMed
    1. Lell MM, Kachelrieß M. Recent and Upcoming Technological Developments in Computed Tomography: High Speed, Low Dose, Deep Learning, Multienergy. Invest Radiol 2020;55:8-19. 10.1097/RLI.0000000000000601 - DOI - PubMed
    1. Stok KS, Burghardt AJ, Boutroy S, Peters MPH, Manske SL, Stadelmann V, Vilayphiou N, Van den Bergh JP, Geusens P, Li X, Marotte H, Van Rietbergen B, Boyd S, Barnabe C, SPECTRA Collaboration. Consensus approach for 3D joint space width of metacarpophalangeal joints of rheumatoid arthritis patients using high-resolution peripheral quantitative computed tomography. Quant Imaging Med Surg 2020;10:314-25. 10.21037/qims.2019.12.11 - DOI - PMC - PubMed
    1. Zhu Y, Hou D, Lan M, Sun X, Ma X.A comparison of ultra-high-resolution CT target scan versus conventional CT target reconstruction in the evaluation of ground-glass-nodule-like lung adenocarcinoma. Quant Imaging Med Surg 2019;9:1087-94. 10.21037/qims.2019.06.09 - DOI - PMC - PubMed