

doi: 10.21037/qims-20-1218.
Optic nerve head injury and optical coherence tomography angiography
Affiliations
- PMID: 34604003
- PMCID: PMC8408792
- DOI: 10.21037/qims-20-1218
Item in Clipboard
Optic nerve head injury and optical coherence tomography angiography
Quant Imaging Med Surg.
2021 Oct.
No abstract available
Conflict of interest statement
Conflicts of Interest: Both authors have completed the ICMJE uniform disclosure form (available at http://dx.doi.org/10.21037/qims-20-1218). The authors have no conflicts of interest to declare.
Figures
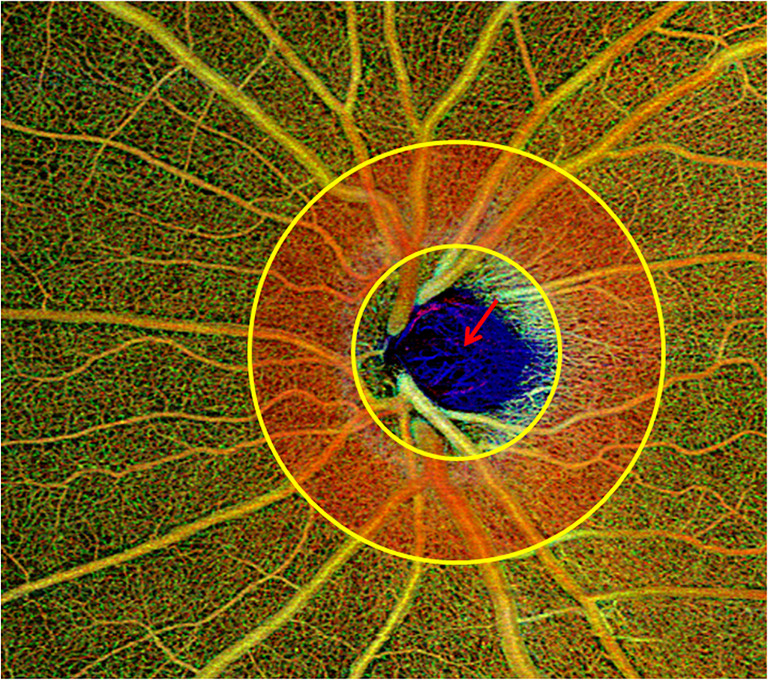
Swept-source OCTA (Zeiss elite 9000) images of the ONH include both the circumpapillary region (red area) and the anterior lamina cribrosa (red arrow). OCTA, optical coherence tomography angiography; ONH, optic nerve head.

OCTA images of the anterior lamina cribrosa. (A) Spectral-domain OCTA (Heidelberg-Engineering; Spectralis) showing the parapapillary microvascular system in the left eye. (B) Spectral-domain OCTA (Heidelberg-Engineering; Spectralis) revealing the microvasculature of the anterior lamina cribrosa in the left eye after changing the segmentation (the same patient as in A). (C,D) Swept-source OCTA (Zeiss elite 9000) showing the microvascular system in both the parapapillary region and the anterior lamina cribrosa (red dots rectangles) binocularly. OCTA, optical coherence tomography angiography.

Correlation between retinal structural abnormalities and the corresponding blood flow in a glaucoma case. Compared with the left eye (B), the parapapillary nerve fiber is atrophic in superior and nasal sections (A); correspondingly, the RNFL is thinning in the right eye (C, red dots rectangle), but the RNFL thickness is normal in the left eye (D); the three dimensional OCT (Heidelberg-Engineering; Spectralis) image of the ONH in the right eye visualized local depression (E, yellow arrow), which is in accordance with the flow void region (red arrow) in en face OCTA (G); in contrast, both ONH topography (F) and en face OCTA (H) are normal in the left eye. OCTA, optical coherence tomography angiography; ONH, optic nerve head; RNFL, retinal nerve fiber layer.

Sectional optic nerve atrophy of a bilateral NAION case in the late stage: OCT (Heidelberg-Engineering; Spectralis) shows sectional parapapillary nerve fiber atrophy bilaterally (yellow dots rectangles); Correspondingly, the cpRNFL reveals parapapillary nerve fiber thinning in tempo-superior and tempo-nasal sections in both eyes; PPAA demonstrates tempo-superior depression (yellow arrows), superior half atrophy of the GCC (red dots rectangles in macular regions), and tempo-superior absolute successive dark blankets in the posterior pole (red dots rectangles in the analytic maps). cpRNFL, circumpapillary retinal nerve fiber layer; GCC, ganglion cell complex; NAION, nonarteritic anterior ischemic optic neuropathy; OCT, optical coherence tomography; PPAA, posterior pole asymmetry analysis.

Multimodal imaging of an ODM in the left eye. (A) Multicolor imaging showing normal outlook of the optic disc and patched atrophy in the macula; (B) NIR-FAF showing typical focal hyper-fluorescence adjacent to the optic disc (red arrow). (C) Indocyanine green angiography absent in intratumoral vessels (yellow arrow). (D) Enhanced depth imaging OCT (Heidelberg-Engineering; Spectralis) visualizing a parapapillary hyper-reflective lesion (red dots rectangle), with nasal retinoschisis. (E) The segmentation of the intratumoral level not showing any blood flow signal. The green arrow indicates the orientation of OCT in illustration D. NIR-FAF, near infrared fundus autofluorescence; OCT, optical coherence tomography; ODM, optic disc melanocytoma.
Similar articles
-
Optical coherence tomography angiography of the macula and optic nerve head: microvascular density and test-retest repeatability in normal subjects.BMC Ophthalmol. 2018 Dec 10;18(1):315. doi: 10.1186/s12886-018-0976-y. BMC Ophthalmol. 2018. PMID: 30526537 Free PMC article.
-
SWEPT-SOURCE OPTICAL COHERENCE TOMOGRAPHY ANGIOGRAPHY OF THE OPTIC DISK IN OPTIC NEUROPATHY.Retina. 2016 Dec;36 Suppl 1:S168-S177. doi: 10.1097/IAE.0000000000001259. Retina. 2016. PMID: 28005675
-
Optical coherence tomography angiography in nonarteritic anterior ischemic optic neuropathy due to optic nerve head drusen.Neurol Sci. 2020 Nov;41(11):3349-3351. doi: 10.1007/s10072-020-04493-4. Epub 2020 Jun 1. Neurol Sci. 2020. PMID: 32483688
-
Optical Coherence Tomography Angiography of the Optic Disc; an Overview.J Ophthalmic Vis Res. 2017 Jan-Mar;12(1):98-105. doi: 10.4103/2008-322X.200162. J Ophthalmic Vis Res. 2017. PMID: 28299012 Free PMC article. Review.
-
Optical coherence tomography evaluation of the optic nerve head neuro-retinal rim in glaucoma.Clin Exp Optom. 2019 May;102(3):286-290. doi: 10.1111/cxo.12833. Epub 2018 Sep 7. Clin Exp Optom. 2019. PMID: 30192017 Review.
Cited by
-
Optical Coherence Tomography Angiography Assessment of the Optic Nerve Head in Patients Hospitalized Due to COVID-19 Bilateral Pneumonia.Medicina (Kaunas). 2024 Mar 19;60(3):502. doi: 10.3390/medicina60030502. Medicina (Kaunas). 2024. PMID: 38541228 Free PMC article.
References
-
- Manalastas PIC, Zangwill LM, Daga FB, Christopher MA, Saunders LJ, Shoji T, Akagi T, Penteado RC, Yarmohammadi A, Suh MH, Medeiros FA, Weinreb RN. The Association Between Macula and ONH Optical Coherence Tomography Angiography (OCT-A) Vessel Densities in Glaucoma, Glaucoma Suspect, and Healthy Eyes. J Glaucoma 2018;27:227-32. 10.1097/IJG.0000000000000862 - DOI - PMC - PubMed
-
- Yarmohammadi A, Zangwill LM, Diniz-Filho A, Suh MH, Manalastas PI, Fatehee N, Yousefi S, Belghith A, Saunders LJ, Medeiros FA, Huang D, Weinreb RN. Optical Coherence Tomography Angiography Vessel Density in Healthy, Glaucoma Suspect, and Glaucoma Eyes. Invest Ophthalmol Vis Sci 2016;57:OCT451-9. 10.1167/iovs.15-18944 - DOI - PMC - PubMed
LinkOut - more resources
Full Text Sources