Quantitative Multiparametric MRI as an Imaging Biomarker for the Prediction of Breast Cancer Receptor Status and Molecular Subtypes
- PMID: 34604024
- PMCID: PMC8481692
- DOI: 10.3389/fonc.2021.628824
Quantitative Multiparametric MRI as an Imaging Biomarker for the Prediction of Breast Cancer Receptor Status and Molecular Subtypes
Abstract
Objectives: To assess breast cancer receptor status and molecular subtypes by using the CAIPIRINHA-Dixon-TWIST-VIBE and readout-segmented echo-planar diffusion weighted imaging techniques.
Methods: A total of 165 breast cancer patients were retrospectively recruited. Patient age, estrogen receptor, progesterone receptor, human epidermal growth factorreceptor-2 (HER-2) status, and the Ki-67 proliferation index were collected for analysis. Quantitative parameters (Ktrans, Ve, Kep), semiquantitative parameters (W-in, W-out, TTP), and apparent diffusion coefficient (ADC) values were compared in relation to breast cancer receptor status and molecular subtypes. Statistical analysis were performed to compare the parameters in the receptor status and molecular subtype groups.Multivariate analysis was performed to explore confounder-adjusted associations, and receiver operating characteristic curve analysis was used to assess the classification performance and calculate thresholds.
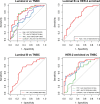
Results: Younger age (<49.5 years, odds ratio (OR) =0.95, P=0.004), lower Kep (<0.704,OR=0.14, P=0.044),and higher TTP (>0.629 min, OR=24.65, P=0.011) were independently associated with progesterone receptor positivity. A higher TTP (>0.585 min, OR=28.19, P=0.01) was independently associated with estrogen receptor positivity. Higher Kep (>0.892, OR=11.6, P=0.047), lower TTP (<0.582 min, OR<0.001, P=0.004), and lower ADC (<0.719 ×10⁻³ mm2/s, OR<0.001, P=0.048) had stronger independent associations with triple-negative breast cancer (TNBC) compared to luminal A, and those parameters could differentiate TNBC from luminal A with the highest AUC of 0.811.
Conclusions: Kep and TTP were independently associated with hormone receptor status. In addition, the Kep, TTP, and ADC values had stronger independent associations with TNBC than with luminal A and could be used as imaging biomarkers for differentiate TNBC from Luminal A.
Keywords: breast neoplasms; diffusion weighted imaging; dynamic contrast enhanced magnetic resonance imaging (DCE-MRI); magnetic resonance imaging; molecular subtypes; pharmacokinetics; receptor status.
Copyright © 2021 Yang, Chen, Zhang, Cheng, Liao, Chen, Dai and Fan.
Conflict of interest statement
YL is a consultant for GE Healthcare. The remaining authors declare that the research was conducted in the absence of any commercial or financial relationships that could be construed as a potential conflict of interest.
Figures


Similar articles
-
Early prediction of pathological complete response to neoadjuvant chemotherapy combining DCE-MRI and apparent diffusion coefficient values in breast Cancer.BMC Cancer. 2022 Dec 2;22(1):1250. doi: 10.1186/s12885-022-10315-x. BMC Cancer. 2022. PMID: 36460972 Free PMC article.
-
Diffusion-weighted imaging (DWI) with apparent diffusion coefficient (ADC) mapping as a quantitative imaging biomarker for prediction of immunohistochemical receptor status, proliferation rate, and molecular subtypes of breast cancer.J Magn Reson Imaging. 2019 Sep;50(3):836-846. doi: 10.1002/jmri.26697. Epub 2019 Feb 27. J Magn Reson Imaging. 2019. PMID: 30811717 Free PMC article.
-
Model-Free and Model-based Parameters Derived From CAIPIRINHA-Dixon-TWIST-VIBE DCE-MRI: Associations With Prognostic Factors and Molecular Subtypes of Invasive Ductal Breast Cancer.J Magn Reson Imaging. 2023 Jul;58(1):81-92. doi: 10.1002/jmri.28533. Epub 2022 Nov 26. J Magn Reson Imaging. 2023. PMID: 36433714
-
Comparison of diffusion kurtosis imaging and dynamic contrast enhanced MRI in prediction of prognostic factors and molecular subtypes in patients with breast cancer.Eur J Radiol. 2022 Sep;154:110392. doi: 10.1016/j.ejrad.2022.110392. Epub 2022 Jun 3. Eur J Radiol. 2022. PMID: 35679701
-
Breast Cancer Subtypes and Quantitative Magnetic Resonance Imaging: A Systemic Review.Life (Basel). 2022 Mar 28;12(4):490. doi: 10.3390/life12040490. Life (Basel). 2022. PMID: 35454981 Free PMC article. Review.
Cited by
-
Early prediction of pathological complete response to neoadjuvant chemotherapy combining DCE-MRI and apparent diffusion coefficient values in breast Cancer.BMC Cancer. 2022 Dec 2;22(1):1250. doi: 10.1186/s12885-022-10315-x. BMC Cancer. 2022. PMID: 36460972 Free PMC article.
-
Multimodality imaging in lobular breast cancer: Differences in mammography, ultrasound, and MRI in the assessment of local tumor extent and correlation with molecular characteristics.Front Oncol. 2022 Aug 22;12:855519. doi: 10.3389/fonc.2022.855519. eCollection 2022. Front Oncol. 2022. PMID: 36072800 Free PMC article.
-
Development and validation of a point-based scoring system for predicting axillary lymph node metastasis and disease outcome in breast cancer using clinicopathological and multiparametric MRI features.Cancer Imaging. 2023 Jun 1;23(1):54. doi: 10.1186/s40644-023-00564-9. Cancer Imaging. 2023. PMID: 37264446 Free PMC article.
-
Whole-Tumor ADC Texture Analysis Is Able to Predict Breast Cancer Receptor Status.Diagnostics (Basel). 2023 Apr 14;13(8):1414. doi: 10.3390/diagnostics13081414. Diagnostics (Basel). 2023. PMID: 37189515 Free PMC article.
-
Quantitative parameters of dynamic contrast-enhanced magnetic resonance imaging to predict lymphovascular invasion and survival outcome in breast cancer.Cancer Imaging. 2022 Oct 22;22(1):61. doi: 10.1186/s40644-022-00499-7. Cancer Imaging. 2022. PMID: 36273200 Free PMC article.
References
-
- Horvat JV, Bernard-Davila B, Helbich TH, Zhang M, Morris EA, Thakur SB, et al. . Diffusion-Weighted Imaging (DWI) With Apparent Diffusion Coefficient (ADC) Mapping as a Quantitative Imaging Biomarker for Prediction of Immunohistochemical Receptor Status, Proliferation Rate, and Molecular Subtypes of Breast Cancer. J Magn Reson Imaging JMRI (2019) 50(3):836–46. doi: 10.1002/jmri.26697 - DOI - PMC - PubMed
LinkOut - more resources
Full Text Sources
Research Materials
Miscellaneous

