. 2021 Sep 16:11:730413.
doi: 10.3389/fcimb.2021.730413. eCollection 2021.

Targeting Host Glycolysis as a Strategy for Antimalarial Development

Affiliations

Targeting Host Glycolysis as a Strategy for Antimalarial Development

Andrew J Jezewski et al. Front Cell Infect Microbiol. .

Abstract

Glycolysis controls cellular energy, redox balance, and biosynthesis. Antiglycolytic therapies are under investigation for treatment of obesity, cancer, aging, autoimmunity, and microbial diseases. Interrupting glycolysis is highly valued as a therapeutic strategy, because glycolytic disruption is generally tolerated in mammals. Unfortunately, anemia is a known dose-limiting side effect of these inhibitors and presents a major caveat to development of antiglycolytic therapies. We developed specific inhibitors of enolase - a critical enzyme in glycolysis - and validated their metabolic and cellular effects on human erythrocytes. Enolase inhibition increases erythrocyte susceptibility to oxidative damage and induces rapid and premature erythrocyte senescence, rather than direct hemolysis. We apply our model of red cell toxicity to address questions regarding erythrocyte glycolytic disruption in the context of Plasmodium falciparum malaria pathogenesis. Our study provides a framework for understanding red blood cell homeostasis under normal and disease states and clarifies the importance of erythrocyte reductive capacity in malaria parasite growth.

Keywords: Plasmodium; antimalarial; enolase; erythrocyte; glycolysis; malaria; oxidative stress; red blood cells.


Conflict of interest statement

The authors declare that the research was conducted in the absence of any commercial or financial relationships that could be construed as a potential conflict of interest.

Figures

Figure 1
Figure 1
Untargeted RBC metabolomics supports on-target inhibition of enolase and establishes a signature of enolase inhibition. Enolase inhibitor treated and untreated freshly harvested RBCs were collected for metabolite detection. (A) Metabolic changes proximal and distal to enolase indicate a characteristic pattern of inhibition. Key metabolites are plotted at 0.5, 1, and 6-hr. time points normalized to 0hr. controls, for untreated, POM-SF, and POM-HEX RBCs. Z-scores of key metabolites for each drug treatment were calculated from fold changes over control samples at t = †hr. FBP = fructose-1,6-bisphosphate, S7P = sedoheptulose-7-phosphate, G3P = glyceraldehyde-3-phosphate. Colors of bar graphs represent the average of z-scores for the two drug treatments. (B) Hierarchical clustering and time course for Z-scores of metabolites significantly different with respect to treatment and/or the interaction of time and treatment as calculated from the mean peak intensities from three biological replicates normalized to initial (t = 0 hr.) samples. PPi = inorganic pyrophosphate, cys-gly = L-cysteine-L-glycine. All samples were collected in experimental triplicate (n=3). *p < 0.05; **p < 0.05; ***P < 0.005.
Figure 2
Figure 2
Altered glutathione metabolism in erythrocytes following inhibition of glycolysis. (A) Metabolites significantly different with respect to treatment and/or the interaction of time and treatment show an enrichment in amino acid metabolism and glutathione metabolism as highlighted in red. Pathway impact is determined by the taking the total centrality score of significantly different metabolites compared to the total centrality score of all metabolites within the pathway as described in methods. A full list of metabolic pathways associated with significantly affected metabolites and the likelihood those metabolite changes impact their associated pathway is displayed in Supplemental Table 3. (B) Nodal analysis performed as described in methods of the same metabolites as in (A) depicts a high degree of interrelatedness through their predicted metabolite-protein interactions based on the KEGG database, and this interrelatedness is enriched for glutathione production. A full list of metabolite-protein interactions is displayed in Supplemental Table 3. (C) The depletion in total glutathione is driven via a depletion in reduced glutathione during enolase inhibitor treatment. (D) Model of glycolytic inhibition disrupting glutathione metabolism. (A–C) Statistics were performed such that metabolites found to be significant following two-way repeated measures ANOVA omnibus tests adjusted for multiple comparisons using a false discovery rate of 0.05 were followed up with post-hoc t-test analyses, treatment vs. control at each time point and adjusted for multiple comparisons, Dunnett method, *p ≤ 0.05, **p ≤ 0.01, ***p ≤ 0.001. All samples were collected in experimental triplicate (n=3). cys-gly, cysteine-glycine; GSH, reduced glutathione; GSSG, oxidized glutathione; Hb, hemoglobin; met-Hb, methemoglobin.
Figure 3
Figure 3
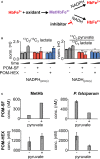
Loss in reductive capacity induces erythrotoxic oxidative damage and antiparasitic effects. (A) Schematic showing two predominate mechanisms of methemoglobin (MetHb) reduction with (B) glucose labeling revealing a collapse in cellular redox potential with pyruvate M+3/lactate M+3 as a proxy for the cellular NAD+/NADH ratio, coupled without an increase in flux through the pentose phosphate pathway as shown via lactate M+2/lactate M+3 (n=3). (C) On the left, half-maximal inhibitory concentrations (EC50) for MetHb formation in cultured human erythrocytes, with and without 1 mM supplemental pyruvate. On the right, EC50 of P. falciparum growth, with and without 1 mM supplemental pyruvate. Representative dose-response curves for can be found in Figure 4 and Supplemental Figure 2. All values are determined from three biological replicates, some error bars are below limit of visualization.
Figure 4
Figure 4
Oxidative damage and erythrocyte senescence upon glycolytic inhibition without hemolysis offers potent antimalarial effects in vitro. (A) Dose-dependent increase in the proportion of oxidized (ferric) heme compared to reduce (ferrous) heme following treatment with indicated enolase inhibitors. Half-maximal effective concentrations are as indicated in Supplemental Table 4 (n=3). (B) Dose-dependent increase in a marker of erythrocyte senescence (exposed phosphatidylserine), characterized via annexin V staining. Concentrations tested are in relation to the EC50 of MetHb formation for each compound respectively (n=3). (C) Hemoglobin absorption (normalized to 100% detergent-mediated lysis) in freshly cultured human erythrocytes for indicated inhibitors (>100µM for 3 days) (n=3). (D) EC50s were performed against P. falciparum strain 3D7. Displayed are representative curves for a subset of the most potent prodrugs and their respective parent compounds. EC50s against parasite growth for all tested compounds are displayed in Supplemental Table 4. (E, F) A high correlation between parasite killing and host toxicity indicates shared mechanism. A linear regression was performed on all compounds for which an EC50 for (E) MetHb or (F) in vivo mouse hematocrit loss and parasite growth inhibition could be determined (GraphPad Prism). (A, D) The respective EC50s are calculated using non-linear regression from each of the independent biological replicates (GraphPad Prism). Hb, hemoglobin; met-Hb, methemoglobin. *p < 0.05; ***p < 0.005.
Figure 5
Figure 5
Positive clinical impacts on murine severe malaria following glycolytic inhibition despite high parasitemias. 2-deoxyglucose (2DG) has pleiotropic effects beyond glycolytic inhibition and effects all cell types, while POM-HEX and HEX are specific to ENO2 isozyme expressing cell types like erythrocytes. (A–C) Swiss Webster mice (n=5) were infected with P. berghei ANKA strain parasites expressing a luciferase reporter and treated daily from day 2 onwards with either vehicle, 2DG (200 mg/kg), or enolase inhibitors POM-HEX (30 mg/kg), or HEX (100 mg/kg). (A) Mice were monitored for parasitemia via blood smear Giemsa staining on indicated days, * = p ≤ 0.05, ** = p ≤ 0.01. (B) Mice were also assessed for clinical signs of cerebral malaria as determined by signs of neurological symptoms such as paralysis, deviation of the head, ataxia, convulsions, and coma on indicated days, * = p ≤ 0.05. (C) Survival was determined over 15 days, two mice remained alive in the Hex treated group on day 15 but were sacrificed due to high parasitemia concomitant with elevated clinical score as depicted by Kaplan-Meier survival curve, ** = p ≤ 0.01.
Figure 6
Figure 6
High plasma exposures of HEX are tolerated in Non-human Primates. (A) HEX concentrations in plasma were measured by 31P-1H HSQC (NS = 128) with a detection limit of ~1 µM. A 400 mg/kg dose SC in mice yielded ~170 µM HEX 1hr after injection, becoming undetectable at the 2 hr time point. In contrast, a dose of just 100 mpk (the blue tracer, replotted from Lin et al., 2020) yielded plasma concentrations of >500 µM in cynomolgus monkeys at 1hr, which remained significant for several hours thereafter. Approximate IC50 concentrations for RBC infected with Plasmodium shown as a grey trace, indicating that in mice, sufficient drug concentrations are for killing Plasmodium infected RBC are only maintained shortly after injection. The half-lives for HEX in monkey is around 1 hr, whilst in mice it is ~†minutes, well in line with values obtained for fosmidomycin. Purple trace, predicted PK of HEX in human at a 100 mpk S.C. dose, based on monkey/human fosmidomycin comparison. The red trace, 400 mpk HEX administrated by oral gavage in monkey, indicates HEX is orally bioavailable. (B), NMR 31P-1H HSQC 1D read outs at different time points post S.C. HEX (1†ppm chemical shift) and endogenous phosphate esters (PE), indicated.
Figure 7
Figure 7
Mechanistic model of anti-parasitic selectivity of a host target. (A, B) Darker red indicates increased metHB formation, infected red cells are indicated by purple ring-stage parasites, erythrocyte membrane channels are plasmodium derived low selectivity permeability pathways, prodrug processing is indicated by cytosolic esterases (black) (A) The enolase inhibitor HEX exhibits low potency but is selectively targeted to host infected red blood cells to generate a therapeutic index. (B) The prodrug cognate POM-HEX increases potency but eliminates any therapeutic window.

Similar articles

Cited by

References

    1. Andree H. A., Reutelingsperger C. P., Hauptmann R., Hemker H. C., Hermens W. T., Willems G. M. (1990). Binding of Vascular Anticoagulant Alpha (VAC Alpha) to Planar Phospholipid Bilayers. J. Biol. Chem. 265 (9), 4923–4928. doi: 10.1016/S0021-9258(19)34062-1 - DOI - PubMed
    1. Arora G., Hart G. T., Manzella-Lapeira J., Doritchamou J. Y., Narum D. L., Thomas L. M., et al. . (2018). NK Cells Inhibit Plasmodium Falciparum Growth in Red Blood Cells via Antibody-Dependent Cellular Cytotoxicity. Elife 7, e36806. doi: 10.7554/eLife.36806 - DOI - PMC - PubMed
    1. Bahar F. G., Ohura K., Ogihara T., Imai T. (2012). Species Difference of Esterase Expression and Hydrolase Activity in Plasma. J. Pharm. Sci. 101 (10), 3979–3988. doi: 10.1002/jps.23258 - DOI - PubMed
    1. Bakker B. M., Michels P. A. M., Opperdoes F. R., Westerhoff H. V. (1999). What Controls Glycolysis in Bloodstream Form Trypanosoma Brucei? J. Biol. Chem. 274 (21), 14551–14559. doi: 10.1074/jbc.274.21.14551 - DOI - PubMed
    1. Baratin M., Roetynck S., Lépolard C., Falk C., Sawadogo S., Uematsu S., et al. . (2005). Natural Killer Cell and Macrophage Cooperation in MyD88-Dependent Innate Responses to Plasmodium Falciparum. Proc. Natl. Acad. Sci. 102 (41), 14747–14752. doi: 10.1073/pnas.0507355102 - DOI - PMC - PubMed

Publication types

LinkOut - more resources