Review
. 2021 Sep 16:9:718522.
doi: 10.3389/fcell.2021.718522. eCollection 2021.

Reproductive Aging in Caenorhabditis elegans: From Molecules to Ecology

Affiliations
Review

Reproductive Aging in Caenorhabditis elegans: From Molecules to Ecology

Andrea Scharf et al. Front Cell Dev Biol. .

Abstract

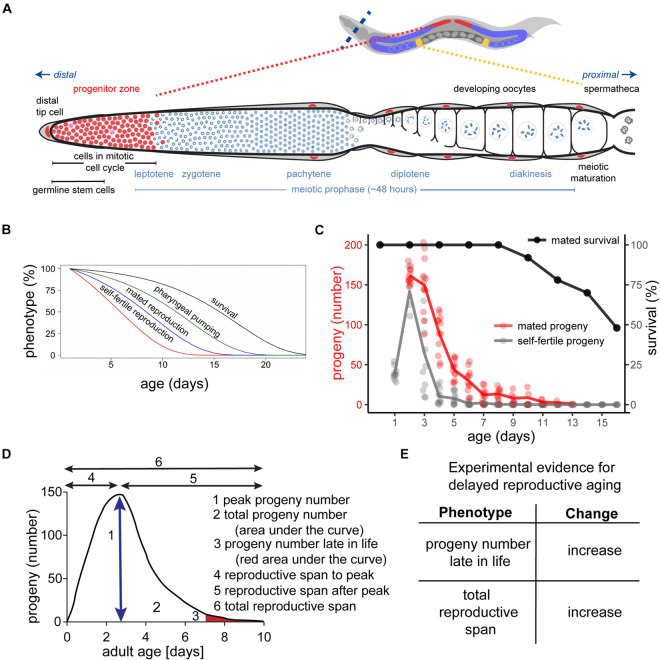
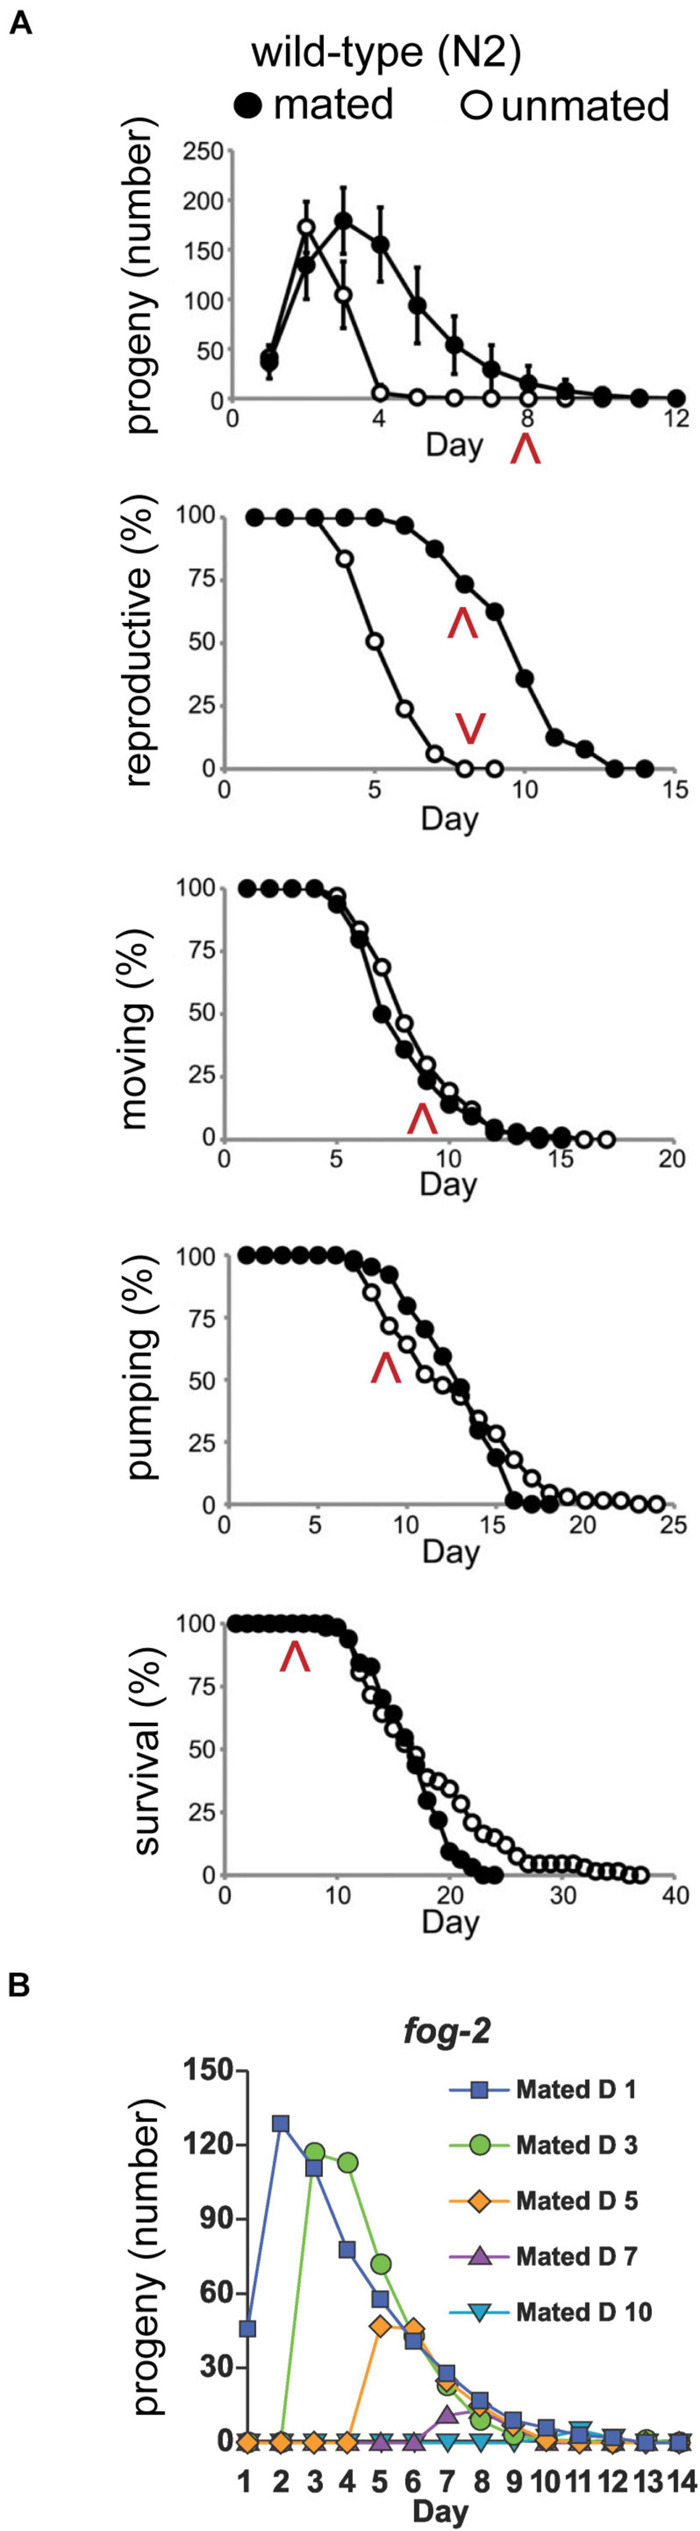
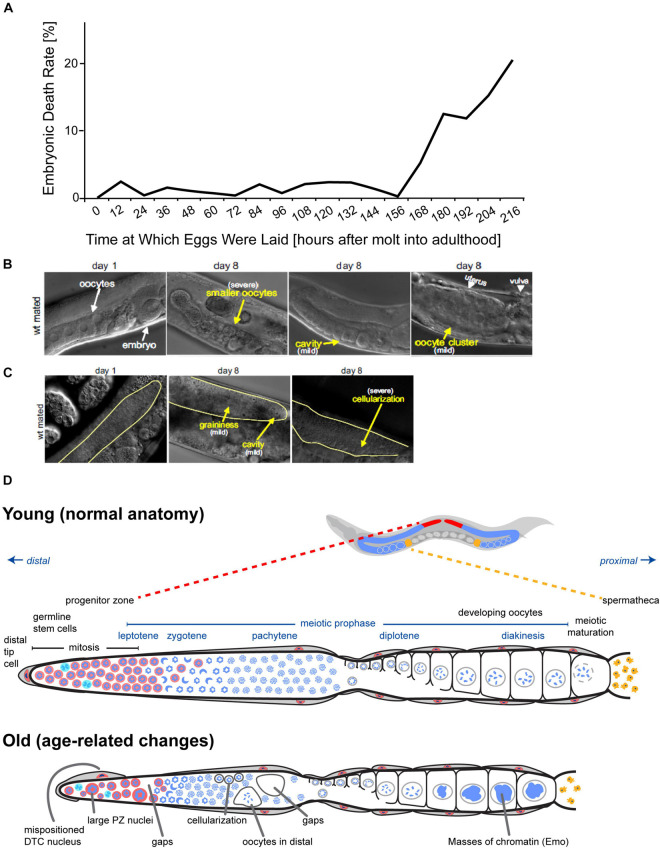
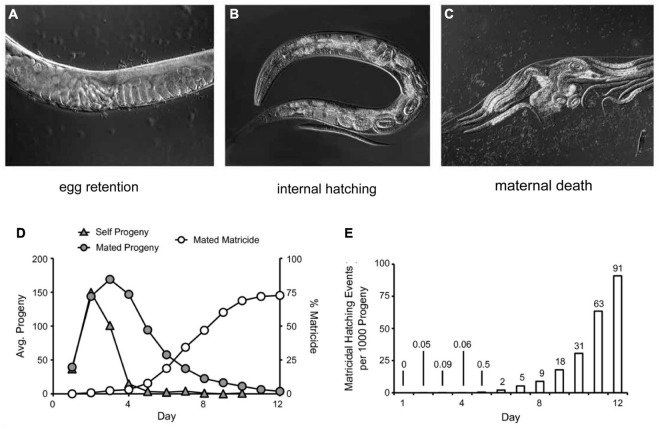
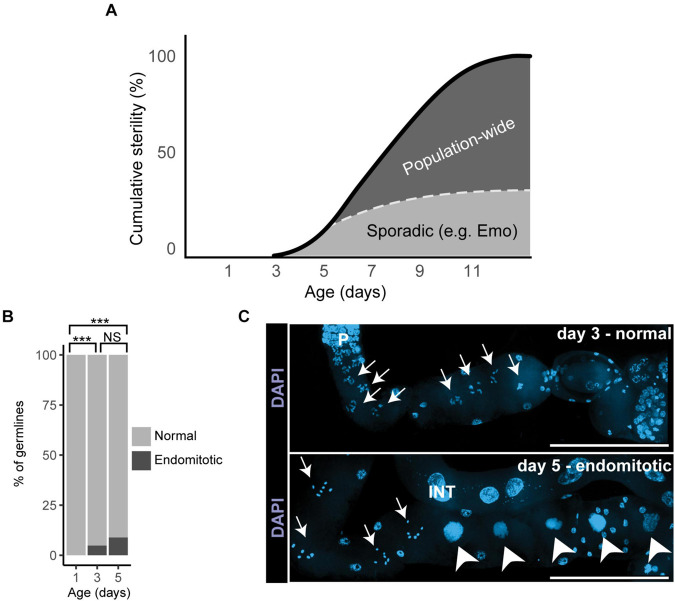
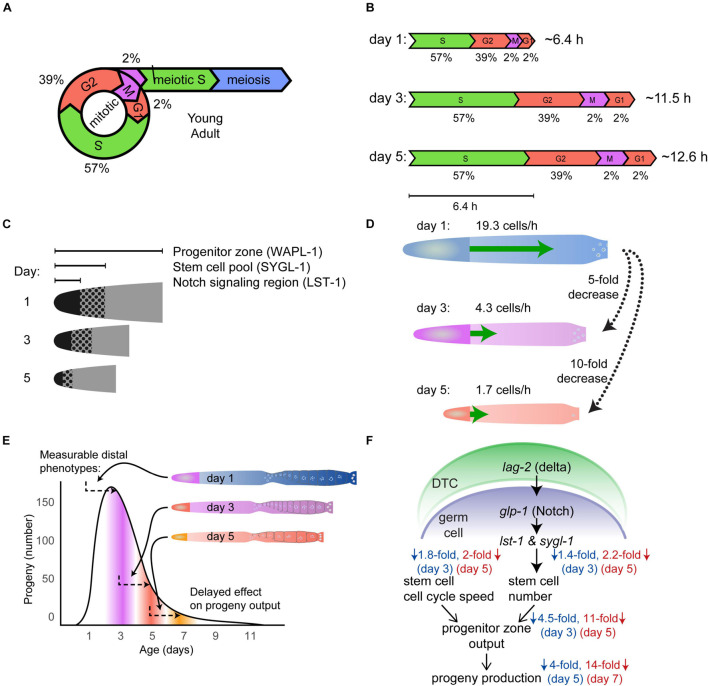
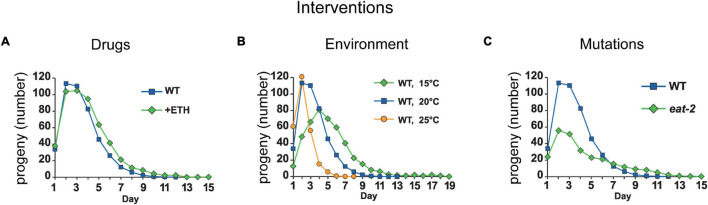
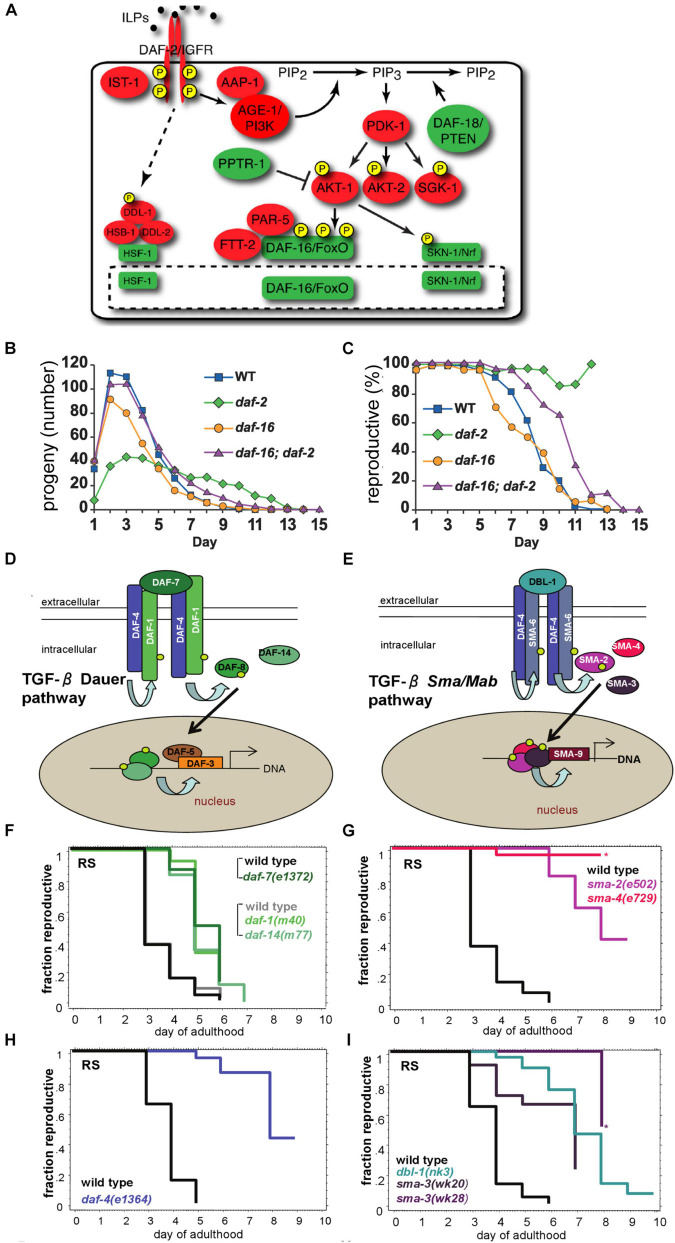
Aging animals display a broad range of progressive degenerative changes, and one of the most fascinating is the decline of female reproductive function. In the model organism Caenorhabditis elegans, hermaphrodites reach a peak of progeny production on day 2 of adulthood and then display a rapid decline; progeny production typically ends by day 8 of adulthood. Since animals typically survive until day 15 of adulthood, there is a substantial post reproductive lifespan. Here we review the molecular and cellular changes that occur during reproductive aging, including reductions in stem cell number and activity, slowing meiotic progression, diminished Notch signaling, and deterioration of germ line and oocyte morphology. Several interventions have been identified that delay reproductive aging, including mutations, drugs and environmental factors such as temperature. The detailed description of reproductive aging coupled with interventions that delay this process have made C. elegans a leading model system to understand the mechanisms that drive reproductive aging. While reproductive aging has dramatic consequences for individual fertility, it also has consequences for the ecology of the population. Population dynamics are driven by birth and death, and reproductive aging is one important factor that influences birth rate. A variety of theories have been advanced to explain why reproductive aging occurs and how it has been sculpted during evolution. Here we summarize these theories and discuss the utility of C. elegans for testing mechanistic and evolutionary models of reproductive aging.

Keywords: aging; egg-laying; evolution; germ line; matricidal hatching; menopause; oocyte quality; reproduction.


Conflict of interest statement

The authors declare that the research was conducted in the absence of any commercial or financial relationships that could be construed as a potential conflict of interest.

Figures

FIGURE 1
FIGURE 1
Somatic and reproductive aging in Caenorhabditis elegans. (A) Architecture of one of the two gonad arms of a young adult hermaphrodite. At the distal end of the gonad, the somatic distal tip cell (red) is embedded in other somatic gonad cells (gray) and maintains the germline stem cell fate via GLP-1/Notch signaling. The germline stem cells (SYGL-1 positive cells) progress from the distal end of the gonad to the proximal end. During this journey, they undergo mitosis in the progenitor zone (red), progress through the meiotic prophase and meiotic maturation. Finally, they are ready to be fertilized by sperm in the spermathecal (yellow). In adults, the progenitor zone and the early prophase of meiosis I overlap. Adapted from Kocsisova et al. (2019). (B) C. elegans exhibits age-related degenerative changes of the soma and the germ line. Self-fertile reproduction (red) and mated reproduction (blue) decreases before somatic functions such as pharyngeal pumping (green), and survival (black). Adapted from Kumar et al. (2014). (C) Progeny production curves of unmated/self-fertile (gray) versus mated (red) hermaphrodites. Mated hermaphrodites survive beyond their reproductive span (black). Note that hermaphrodites that died by matricidal hatching were censored. Adapted from Kocsisova et al. (2019). (D) Summary statistics for analysis of the progeny production curve: peak egg number (arrow under the curve); total egg number (area under total curve), egg number late in life (red area under tail of curve), reproductive span to the peak, reproductive span after the peak, and total reproductive span (black arrows). (E) Experimental evidence for delayed reproductive aging in mated hermaphrodites – an increase in the total reproductive span and/or an increase in the number of eggs laid late in life.
FIGURE 2
FIGURE 2
Somatic and reproductive aging are independent of progeny production. (A) Progeny production, reproductive span, body movement span, pharyngeal pumping span, and lifespan of mated and unmated wild-type hermaphrodites. The increase in amount and duration of progeny production caused by male mating does not accelerate somatic aging. Red arrowheads highlight day 8 in each span. Adapted from Pickett et al. (2013). (B) Feminized fog-2(q71) mutants were mated to wild-type males for 24–48 h at different ages. Progeny curves show that late progeny production and reproductive span after peak were independent of early progeny production. Adapted from Hughes et al. (2007).
FIGURE 3
FIGURE 3
Age-related declines of oocyte and germline quality. (A) fog-2(q71) mutant animals that do not produce self-sperm were mated to males (start: 0 h), and the percentage of unhatched embryos was determined every 12 h. The embryonic death rate displays an age-related increase to ∼20% by day 9. Adapted from Andux and Ellis (2008). (B) Oocytes of adult day 8 mated wild-type hermaphrodites display morphological defects visible using differential interference contrast microscopy (DIC). Compared to adult day 1 mated wild-type hermaphrodites, oocytes in adult day 8 hermaphrodites can be smaller, clustered, or contain cavities (yellow arrows). Reprinted from Luo et al. (2010) with permission from Elsevier. (C) The distal germ line of adult day 8 mated wild-type hermaphrodites displays morphological defects visible using DIC microscopy. Compared to adult day 1 mated wild-type hermaphrodites, the distal germ line loses its smoothness in adult day 8 hermaphrodites and can appear grainy with cavities or exhibit severe cellularization (yellow arrows). The morphological defects are defined according Garigan et al. (2002). Reprinted from Luo et al. (2010) with permission from Elsevier. (D) Anatomy of C. elegans germ line in young versus old hermaphrodites. Top: C. elegans hermaphrodites have two U-shaped germ lines (red and blue). The spermatheca is shown in yellow, and the uterus with developing embryos is shown in dark gray. Middle: Diagram of one unfolded young C. elegans hermaphrodite germ line. Nuclear morphology can be visualized by staining DNA with DAPI (blue). The distal progenitor zone (red) contains mitotically cycling stem and progenitor cells. The distal tip cell (DTC) provides the GLP-1/Notch ligand to maintain the stem cell fate of these cells. As cells migrate away from the DTC, they exit the progenitor zone and enter meiotic prophase. Bottom: Diagram of one unfolded old C. elegans hermaphrodite germ line. Numerous age-related changes in the germ line have been reported. Several are illustrated here. Adapted from Kocsisova et al. (2019).
FIGURE 4
FIGURE 4
Matricidal hatching. Wild strain JU751 hermaphrodites exhibit nearly constitutive matricidal hatching. DIC microscopic micrographs depict the progression: (A) Eggs are retained in the uterus, showing a “stacking of embryos” phenotype. (B) Retained embryos will continue to develop and hatch inside the uterus. (C) Hatched larvae grow inside the hermaphrodite and feed on the maternal tissue. Finally, the hermaphrodite bursts and releases the progeny in dauer stage. (A–C) Adapted from Vigne et al. (2021). (D) The cumulative percentage of matricidal hatching in mated wild-type hermaphrodite in comparison to progeny production curves of unmated/self-fertile and mated wild-type hermaphrodites. Adapted from Pickett and Kornfeld (2013). (E) Incidence number of matricidal hatchings per 1,000 progeny laid by mated wild-type hermaphrodites. Until day 6, progeny production carries a small risk of matricidal hatching, but after day 6 the risk increases exponentially. Adapted from Pickett and Kornfeld (2013).
FIGURE 5
FIGURE 5
Sporadic degenerative changes in the aging germ line. (A) The graph illustrates how sporadic and population-wide changes contribute to cumulative age-related sterility in mated wild-type hermaphrodites. Endomitotic oocytes or shifted distal tip cells are sporadic degenerative changes and account for less than half of age-related sterility (the dotted line indicates a model of the relative contribution of sporadic defects). Declines in stem cell number and activity, PZ and germ line shrinking, as well as slower cell cycles are population-wide changes that appear to be the main drivers of reproductive aging. Adapted from Kocsisova et al. (2019). (B) Analysis of sporadic changes in day 1, 3, and 5 mated wild-type hermaphrodites: Percentage of dissected germ lines with (black) or without (gray) endomitotic oocytes (black). Adapted from Kocsisova et al. (2019). (C) Representative fluorescence micrographs of wild-type mated hermaphrodites stained with the DNA-dye DAPI. Oocytes of a day 3 adult show normal chromosomes in diakinesis (arrows in top panel) in contrast to endomitotic oocytes (arrowheads in lower panel) of a day 5 adult. P, pachytene; INT, intestine. Scale bars: 100 μm. Adapted from Kocsisova et al. (2019).
FIGURE 6
FIGURE 6
Population-wide, age-related degenerative changes in the germ line. (A) Schematic of the mitotic cell cycle and meiotic entry of young adult wild-type germ cells, including duration of time in each phase expressed as a percent (Fox et al., 2011). Adapted from Kocsisova et al. (2019). (B) The duration of the cell cycle increases with age in mated wild-type hermaphrodites. The scale diagram summarizes the duration of different phases of the cell cycle in day 3 and 5 animals compared to day 1 animals. The values below indicate the percentage of time in each phase, whereas the values on the right indicate the total cell cycle duration time. Adapted from Kocsisova et al. (2019). (C) The schematic shows that the size of the Notch signaling region, stem cell pool, and the progenitor zone (PZ) shrinks with age. Notch signaling was visualized by LST-1 labeling, the stem cell pool was visualized by SYGL-1 labeling, and the progenitor zone was labeled with WAPL-1 antibodies in day 1, 3, and 5 germ lines. Adapted from Kocsisova et al. (2019). (D) The schematic displays the age-related decrease in the rate of meiotic entry (green arrow) in the germ line of mated wild-type hermaphrodites. Day 5 and 3 germ lines show a 10-fold and 5-fold decrease, respectively, compared to day 1 germ lines. Adapted from Kocsisova et al. (2019). (E) The schematic shows that changes in the distal germ line correlate with changes in the progeny production curve about 2 days later (arrows). The size of the germ line and the progenitor zone (PZ) decreases before the progeny production declines. The PZ cells need two or more days to become oocytes and be laid as eggs. Therefore, age-related changes such as the shrinking of the germ line and PZ affect progeny production with a delay. Adapted from Kocsisova et al. (2019). (F) Summary and model of reproductive aging in C. elegans. Adapted from Kocsisova et al. (2019).
FIGURE 7
FIGURE 7
Environmental, genetic, and pharmacological factors can delay reproductive aging. Representative interventions that prolong the reproductive span and increase late progeny production in short (24 h) mated C. elegans hermaphrodites. (A) Ethosuximide-treatment increases mid-life and late progeny production and prolongs the reproductive span in mated wild-type C. elegans. Adapted from Hughes et al. (2007). (B) Increasing the culture temperature from 20°C (blue curve) to 25°C (yellow curve) decreases late progeny production and reduces the reproductive span after peak in mated wild-type C. elegans. By contrast, reducing the culture temperature to 15°C (green curve) decreases early progeny production, increases late progeny production, increases reproductive span to peak, and extends the reproductive span after peak in mated wild-type C. elegans. Adapted from Hughes et al. (2007). (C) Mated C. elegans hermaphrodites with a mutation in eat-2 (green) display decreased early progeny production, decreased peak progeny number, increased late progeny production, and an extended total reproductive span compared to wild type. Adapted from Hughes et al. (2007).
FIGURE 8
FIGURE 8
Mutations in the TGF-β and the Insulin/IGF-1 signaling pathways increase reproductive capacity. (A) The schematic depicts the Insulin/IGF-1 signaling pathway. Adapted from Murphy and Hu (2013). (B) Mated hermaphrodites with a mutation in the daf-2 gene (green) display reduced peak progeny number, increased late progeny production, and an extended total reproductive span. By contrast, mated daf-16 mutant hermaphrodites display a reduced peak progeny number, a reduced total progeny number, and a reduced total reproductive span. Adapted from Hughes et al. (2007). (C) Mated daf-2 mutants show a higher percentage of live hermaphrodites producing progeny late in life compared to mated daf-2;daf-16 double mutants, mated daf-16 mutants or mated wild-type animals. Adapted from Hughes et al. (2007). (D,E) The schematics depict the TGF-β Dauer pathway and the TGF-β Sma/Mab pathway. Adapted from Luo et al. (2009). (F–I) C. elegans hermaphrodites with mutations in the TGF-β Dauer pathway (F,H) or TGF-β Sma/Mab (G,I) display an extended reproductive span compared to wild type. Adapted from Luo et al. (2009).
FIGURE 9
FIGURE 9
Optimal progeny number theory. The schematic of hypothetical progeny production curves display how progeny number can be controlled: (1) timing of onset of reproduction, (2) quantity of progeny, and (3) timing of cessation of reproduction or reproductive aging. Thus, reproductive aging is one of the critical inputs that controls progeny number. According to the theory, there is an optimal progeny number that stabilizes population dynamics and support long-term survival of populations. Therefore, reproductive aging can be an advantageous trait that might be sculpted by evolution. Adapted from Hughes et al. (2007).

Similar articles

Cited by

References

    1. Achache H., Falk R., Lerner N., Beatus T., Tzur Y. B. (2021). Oocyte aging is controlled by mitogen-activated protein kinase signaling. Aging Cell 20:e13386. 10.1111/acel.13386 - DOI - PMC - PubMed
    1. Adam Bohnert K., Kenyon C. (2017). A lysosomal switch triggers proteostasis renewal in the immortal C. elegans germ lineage. Nature 551 629–633. 10.1038/nature24620 - DOI - PMC - PubMed
    1. Admasu T. D., Chaithanya Batchu K., Barardo D., Ng L. F., Lam V. Y. M., Xiao L., et al. (2018). Drug synergy slows aging and improves healthspan through igf and srebp lipid signaling. Dev. Cell 47 67–79.e5. 10.1016/j.devcel.2018.09.001 - DOI - PubMed
    1. Akinwumi B. C. (2018). Biological activities of stilbenoids. Int. J. Mol. Sci. 19:792. 10.3390/ijms19030792 - DOI - PMC - PubMed
    1. Andux S., Ellis R. E. (2008). Apoptosis maintains oocyte quality in aging Caenorhabditis elegans females. PLoS Genet. 4:e1000295. 10.1371/journal.pgen.1000295 - DOI - PMC - PubMed

LinkOut - more resources