. 2021 Sep 16:8:587659.
doi: 10.3389/fvets.2021.587659. eCollection 2021.

Next-Generation Intestinal Toxicity Model of Human Embryonic Stem Cell-Derived Enterocyte-Like Cells

Affiliations

Next-Generation Intestinal Toxicity Model of Human Embryonic Stem Cell-Derived Enterocyte-Like Cells

Bokyeong Ryu et al. Front Vet Sci. .

Abstract

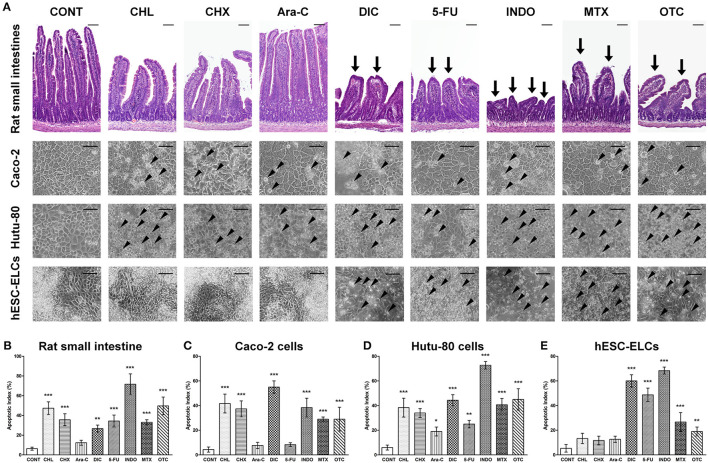
The gastrointestinal tract is the most common exposure route of xenobiotics, and intestinal toxicity can result in systemic toxicity in most cases. It is important to develop intestinal toxicity assays mimicking the human system; thus, stem cells are rapidly being developed as new paradigms of toxicity assessment. In this study, we established human embryonic stem cell (hESC)-derived enterocyte-like cells (ELCs) and compared them to existing in vivo and in vitro models. We found that hESC-ELCs and the in vivo model showed transcriptomically similar expression patterns of a total of 10,020 genes than the commercialized cell lines. Besides, we treated the hESC-ELCs, in vivo rats, Caco-2 cells, and Hutu-80 cells with quarter log units of lethal dose 50 or lethal concentration 50 of eight drugs-chloramphenicol, cycloheximide, cytarabine, diclofenac, fluorouracil, indomethacin, methotrexate, and oxytetracycline-and then subsequently analyzed the biomolecular markers and morphological changes. While the four models showed similar tendencies in general toxicological reaction, hESC-ELCs showed a stronger correlation with the in vivo model than the immortalized cell lines. These results indicate that hESC-ELCs can serve as a next-generation intestinal toxicity model.

Keywords: alternative testing method; embryonic stem cell; enterotoxicity; intestinal toxicity; toxicology.


Conflict of interest statement

The authors declare that the research was conducted in the absence of any commercial or financial relationships that could be construed as a potential conflict of interest.

Figures

Figure 1
Figure 1
Differentiation of human embryonic stem cells into human enterocytes. (A) Scheme of the differentiation protocol of human embryonic stem cell-derived enterocyte-like cells (hESC-ELCs) from hESCs. (B) Representative morphological changes during differentiation from hESCs to definitive endoderm (DE), hindgut (HG), and hESC-ELCs. Scale bars, 100 μm. (C) Expression levels of the intestine-specific marker (CDX2), enterocyte markers (VIL1 and SI), and the tight junction markers (ZO-1, OCLN, CLDN1, CLDN3, and CLDN5) in hESCs and hESC-ELCs assessed by qPCR analysis. Data are presented as the mean ± SEM. *p < 0.05; **p < 0.01. (D) Immunofluorescent staining of hESCs and hESC-ELCs with the intestine-specific marker (CDX2) and enterocyte marker (VIL1). Scale bars, 20 μm. (E) Gene Ontology (GO) network and Enrichment Pathway analysis for the hESC-ELCs assessed by ClueGO. Upregulated differentially expressed genes (DEGs; fold change > 128) in hESC-ELCs compared to H9 hESCs were analyzed. (F) The GOs of DEGs in (E) were presented with their p values.
Figure 2
Figure 2
Transcriptomic assessment of human embryonic stem cell-derived enterocyte-like cells (hESC-ELCs) and other small intestine models. hESC-ELCs, rat small intestine, Caco-2 cells, Hutu-80 cells, and human adult and fetal small intestines without any treatment were used for RNA sequencing (RNA-seq). (A) Heatmap of a total number of 10,020 genes used to cluster the models hierarchically. The heatmap represents six models (columns) and their genes (rows). The color scale at the top represents the expression level, where red, blue, and white indicate upregulation, downregulation, and an unaltered expression, respectively. (B) Relative distances of the seven models visualized using principal component analysis (PCA). Dots with colors represent each model, and the red arrows are for each gene in the transcriptomic analysis. Clustered samples share the colors and lines. hEscElc, hESC-ELCs; rSI, rat small intestine; Caco2, Caco-2 cells; Hutu80, Hutu-80 cells; hFetalSI, human fetal small intestine; hAdultSI, human adult small intestine. (C) Venn diagram visualizing the intersection between hESC-ELCs and the in vivo models. The intersection of the human and rat adult small intestines has 214 genes in common. (D) The enriched biological pathways were assessed by ClueGO. The intersection of the human adult and fetal small 698 intestines has 145 genes in common. (E) The enriched pathways were also assessed. The intersection of hESC-ELCs and the human adult small intestines has 46 genes in common. (F) The enriched top 28 pathways were assessed by DAVID. (G) Comparison of the hESC-ELCs and human adult small intestines in intestine-related biological pathways.
Figure 3
Figure 3
Relative mRNA expression levels in rat small intestines, Caco-2 cells, Hutu-80 cells, and human embryonic stem cell-derived enterocyte-like cells (hESC-ELCs). Rat small intestines, Caco-2 cells, Hutu-80 cells, and hESC-ELCs were treated with chloramphenicol (CHL), cycloheximide (CHX), cytarabine (Ara-C), diclofenac (DIC), fluorouracil (5-FU), indomethacin (INDO), methotrexate (MTX), oxytetracycline (OTC), or vehicle and assessed by quantitative PCR (qPCR). (A) The relative expressions of hCYP2C9/rCyp2c11, hCYP2C19/rCyp2c6v1, hCYP2D6/yCyp2d3, hCYP2E1/rCyp2e1, hCYP3A4/rCyp3a2, MAOA, NAT2, HO1, IL1RN, TNF, and hCYP24A1/rCyp24a1 were monitored. Also, the ratio of Bax/Bcl-2 was calculated. Data shown are the mean ± SEM. *p < 0.05; **p < 0.01; ***p < 0.001. (B) Heatmap of the entire set of genes represented by four models (columns) and their genes treated with each drug (rows). The color scale at the top represents the expression level, where red, blue, and white indicate upregulation, downregulation, and an unaltered expression, respectively. (C) Relative distances of the four models visualized using principal component analysis (PCA). Black dots represent each model, and the red arrows are for each gene in the qPCR analysis. hEscElc, hESC-ELCs; rSI, rat small intestine; Caco2, Caco-2 cells; Hutu80, Hutu-80 cells. (D–F) Correlations with the in vivo model under treatment of intestinal toxicants of hESC-ELCs (D), Caco-2 cells (E), and Hutu-80 cells (F) (for all panels, the x-axis shows the rat in vivo gene expression and the y-axis shows the cell gene expression). The strength of the correlations between the in vitro models and the in vivo model is shown as Pearson's correlation coefficient (r) with associated p-values.
Figure 4
Figure 4
Representative morphological changes in human embryonic stem cell-derived enterocyte-like cells (hESC-ELCs) and in the other models under treatment of intestinal toxicants. Rat small intestines, Caco-2 cells, Hutu-80 cells, and hESC-ELCs were treated with chloramphenicol (CHL), cycloheximide (CHX), cytarabine (Ara-C), diclofenac (DIC), fluorouracil (5-FU), indomethacin (INDO), methotrexate (MTX), oxytetracycline (OTC), or vehicle and the morphological changes were analyzed. (A) The rat tissues were stained with hematoxylin and eosin (HandE), and the rat tissues and cells were assessed. Arrows indicate the damaged intestinal architectures in the rat intestines, and arrowheads indicate the characteristics of apoptotic cell death in Caco-2 cells, Hutu-80 cells, and hESC-ELCs. All scale bars, 100 μm. (B–E) Apoptotic indices were also calculated in rat small intestines (B), Caco-2 cells (C), Hutu-80 cells (D), and hESC-ELCs (E). Data shown are the mean ± SD. *p < 0.05; **p < 0.01; ***p < 0.001.

Similar articles

Cited by

References

    1. Sastry SV, Nyshadham JR, Fix JA. Recent technological advances in oral drug delivery - a review. Pharm Sci Technolo Today. (2000) 3:138–45. 10.1016/S1461-5347(00)00247-9 - DOI - PubMed
    1. Pereira De Sousa I, Bernkop-Schnurch A. Pre-systemic metabolism of orally administered drugs and strategies to overcome it. J Control Release. (2014) 192:301–9. 10.1016/j.jconrel.2014.08.004 - DOI - PubMed
    1. Roberts MS, Magnusson BM, Burczynski FJ, Weiss M. Enterohepatic circulation: physiological, pharmacokinetic and clinical implications. Clin Pharmacokinet. (2002) 41:751–90. 10.2165/00003088-200241100-00005 - DOI - PubMed
    1. Price AB. Pathology of drug-associated gastrointestinal disease. Br J Clin Pharmacol. (2003) 56:477–82. 10.1046/j.1365-2125.2003.01980.x - DOI - PMC - PubMed
    1. Marietta EV, Cartee A, Rishi A, Murray JA. Drug-induced enteropathy. Dig Dis. (2015) 33:215–20. 10.1159/000370205 - DOI - PubMed

LinkOut - more resources