

Concurrent Imputation and Prediction on EHR data using Bi-Directional GANs: Bi-GANs for EHR imputation and prediction
- PMID: 34604866
- PMCID: PMC8482531
- DOI: 10.1145/3459930.3469512
Concurrent Imputation and Prediction on EHR data using Bi-Directional GANs: Bi-GANs for EHR imputation and prediction
Abstract
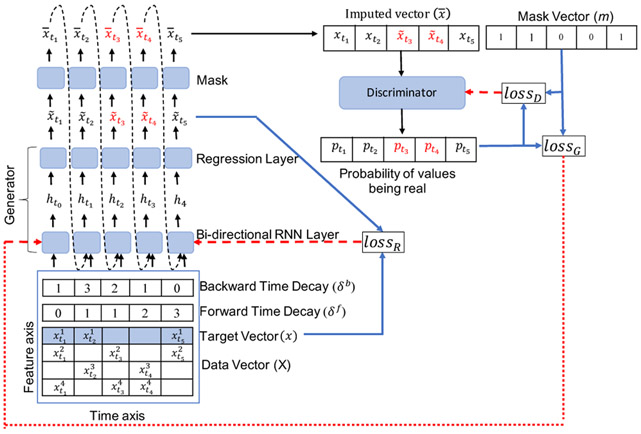
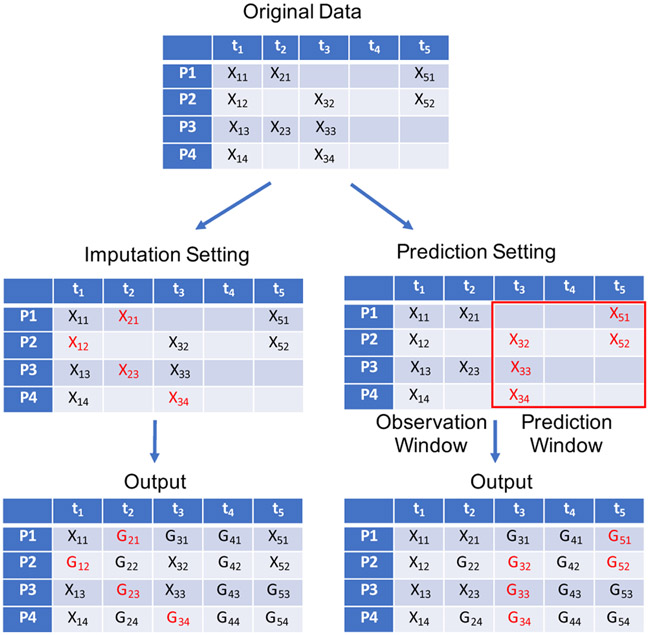
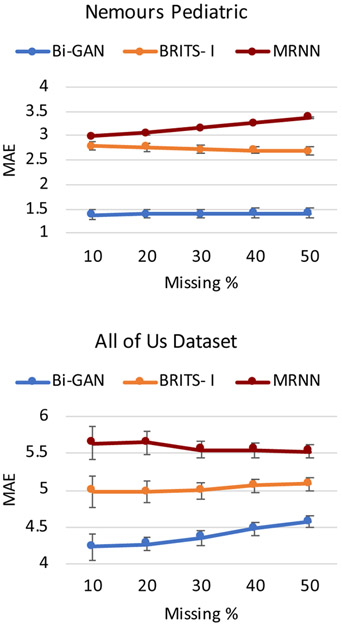
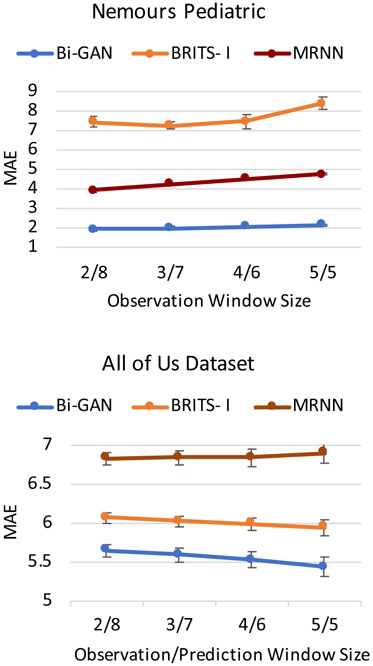
Working with electronic health records (EHRs) is known to be challenging due to several reasons. These reasons include not having: 1) similar lengths (per visit), 2) the same number of observations (per patient), and 3) complete entries in the available records. These issues hinder the performance of the predictive models created using EHRs. In this paper, we approach these issues by presenting a model for the combined task of imputing and predicting values for the irregularly observed and varying length EHR data with missing entries. Our proposed model (dubbed as Bi-GAN) uses a bidirectional recurrent network in a generative adversarial setting. In this architecture, the generator is a bidirectional recurrent network that receives the EHR data and imputes the existing missing values. The discriminator attempts to discriminate between the actual and the imputed values generated by the generator. Using the input data in its entirety, Bi-GAN learns how to impute missing elements in-between (imputation) or outside of the input time steps (prediction). Our method has three advantages to the state-of-the-art methods in the field: (a) one single model performs both the imputation and prediction tasks; (b) the model can perform predictions using time-series of varying length with missing data; (c) it does not require to know the observation and prediction time window during training and can be used for the predictions with different observation and prediction window lengths, for short- and long-term predictions. We evaluate our model on two large EHR datasets to impute and predict body mass index (BMI) values and show its superior performance in both settings.
Keywords: Adversarial Training; Electronic Health Record; Recurrent Neural Network.
Figures
References
-
- Adab Peymane, Pallan Miranda, and Whincup Peter H. 2018. Is BMI the best measure of obesity? - PubMed
-
- Batista Gustavo E. A. P. A. and Monard Maria Carolina. 2003. An analysis of four missing data treatment methods for supervised learning. Applied Artificial Intelligence 17, 5-6 (2003), 519–533. 10.1080/713827181 arXiv: 10.1080/713827181 - DOI
-
- Bray George A. 2004. Medical consequences of obesity. The Journal of Clinical Endocrinology & Metabolism 89, 6 (2004), 2583–2589. - PubMed
Grants and funding
LinkOut - more resources
Full Text Sources