. 2022 May;227(4):1195-1225.
doi: 10.1007/s00429-021-02392-8. Epub 2021 Oct 3.

The primary visual cortex of Cetartiodactyls: organization, cytoarchitectonics and comparison with perissodactyls and primates

Affiliations

The primary visual cortex of Cetartiodactyls: organization, cytoarchitectonics and comparison with perissodactyls and primates

Jean-Marie Graïc et al. Brain Struct Funct. 2022 May.

Abstract

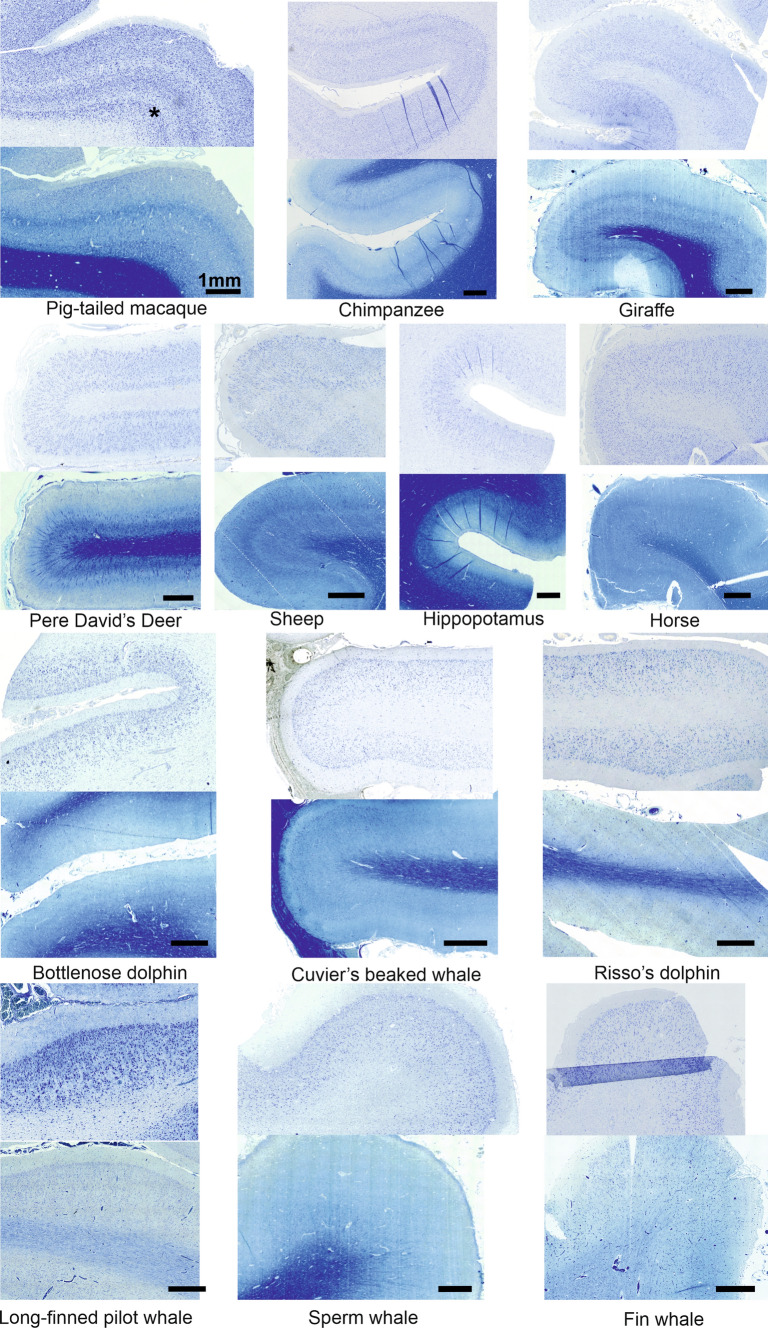
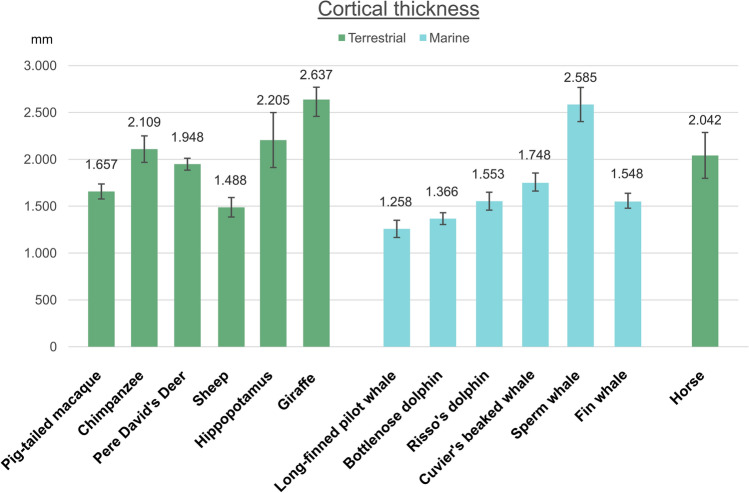
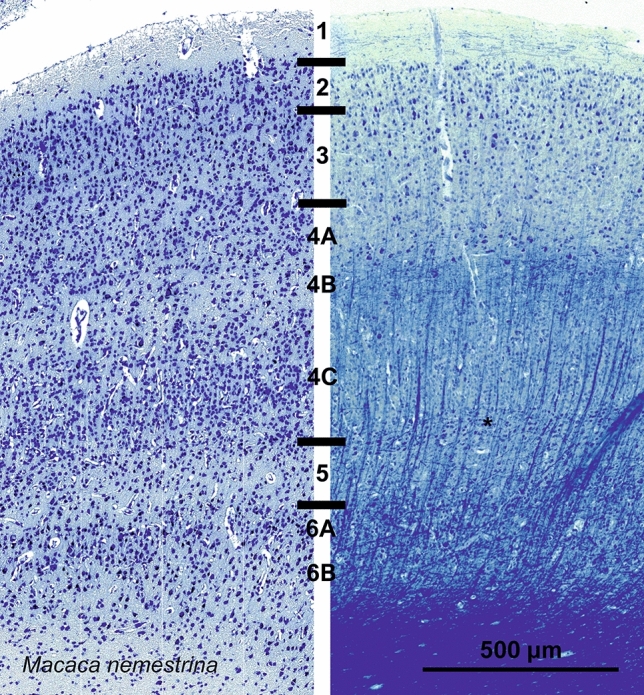
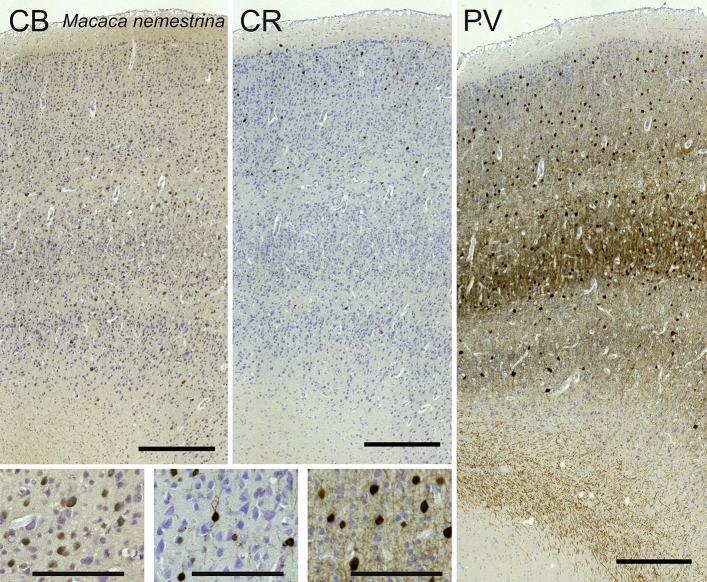
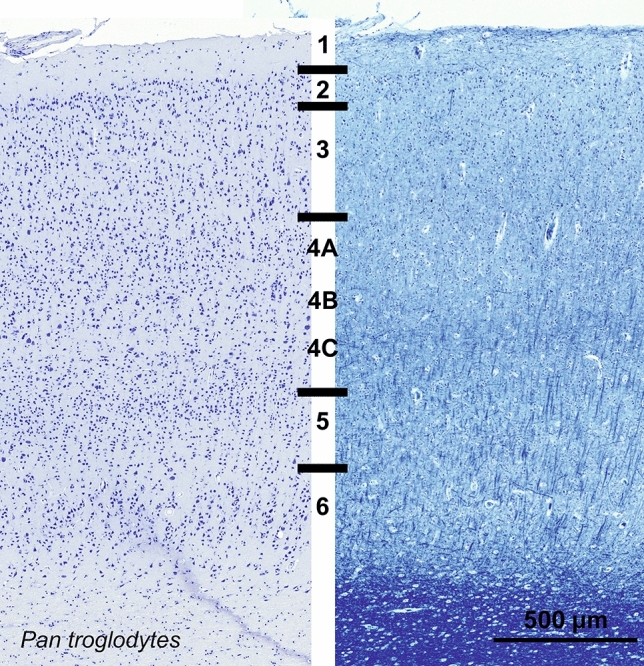
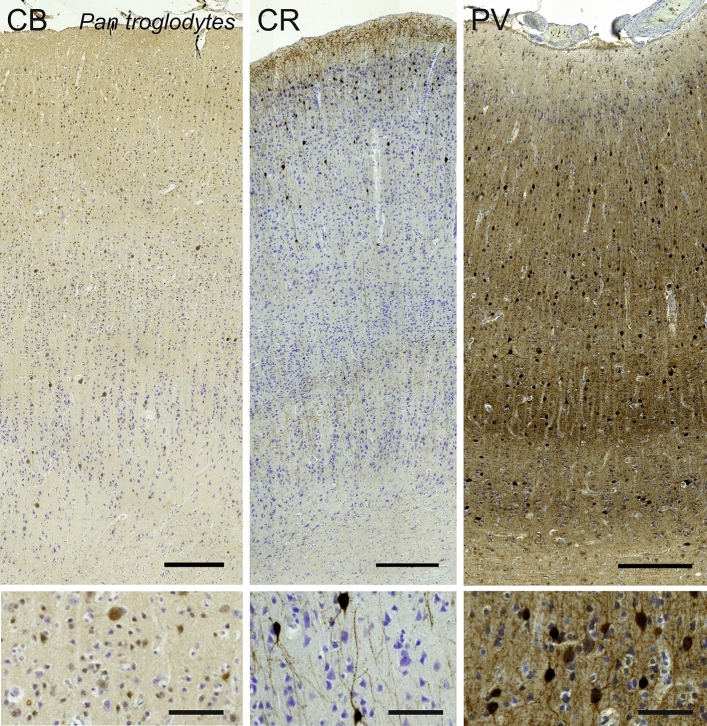
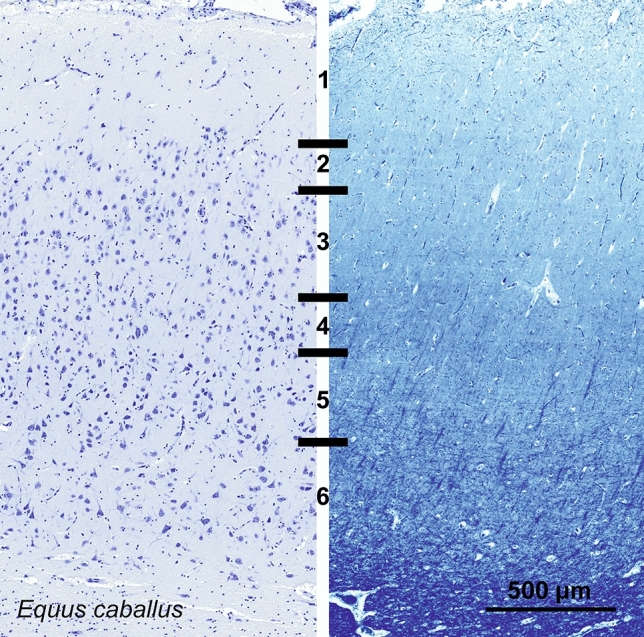
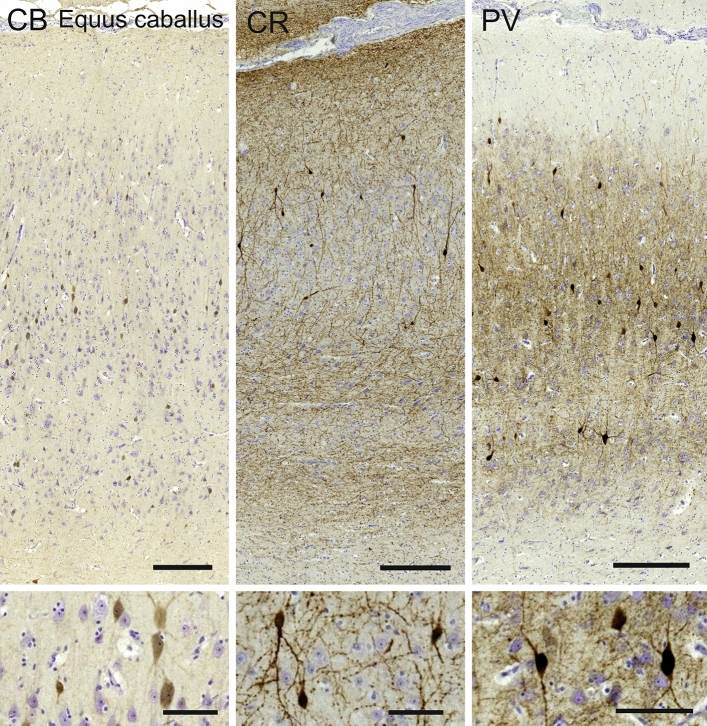
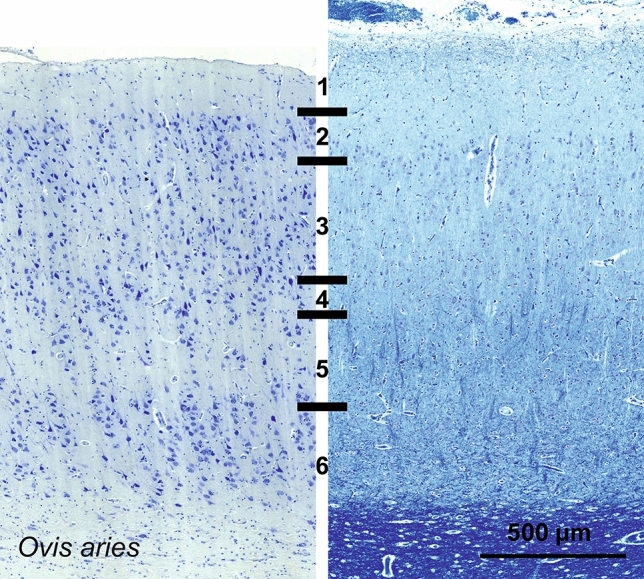
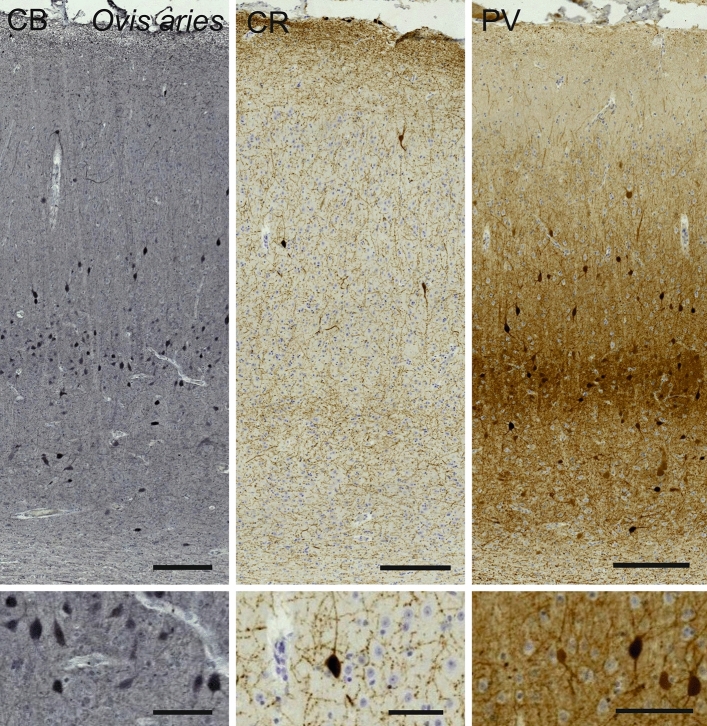
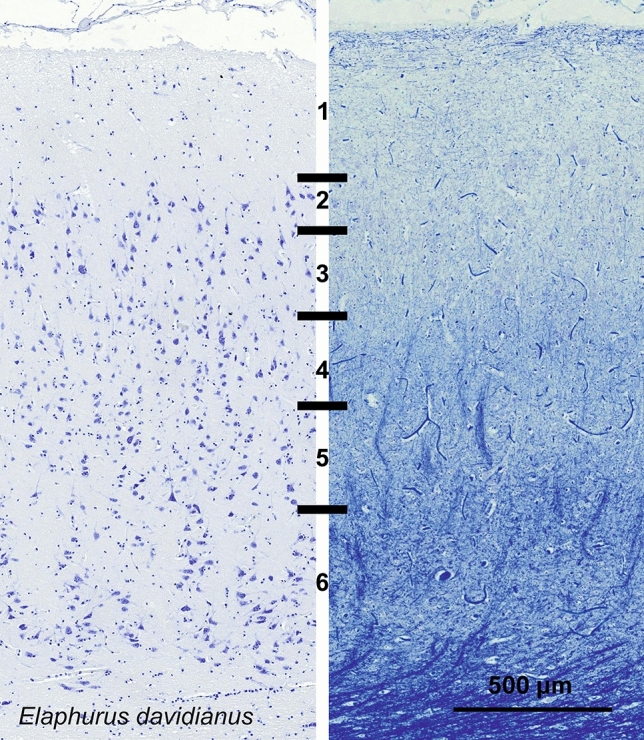
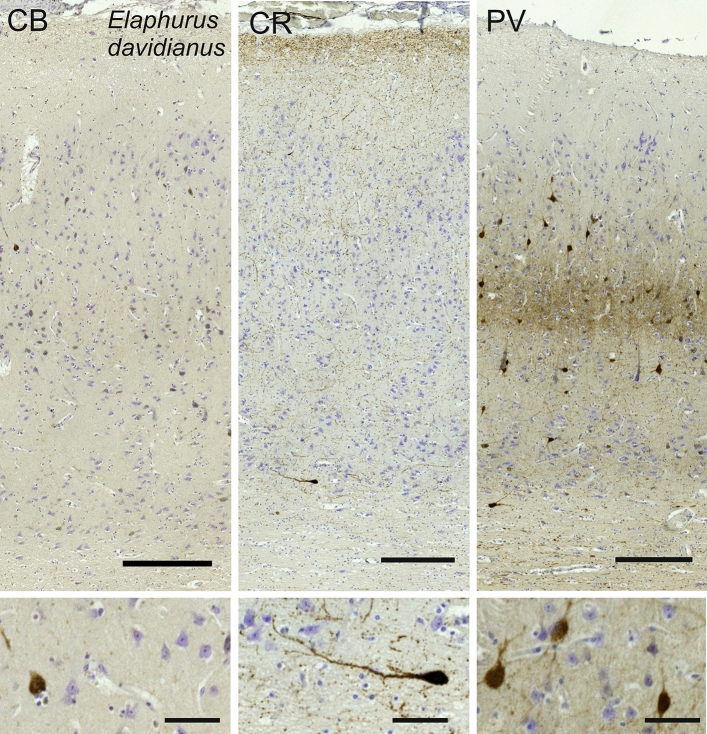
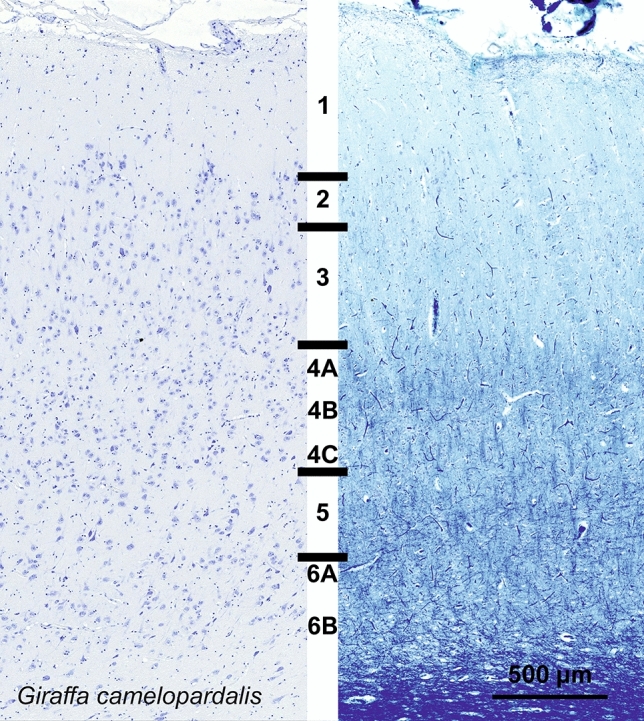
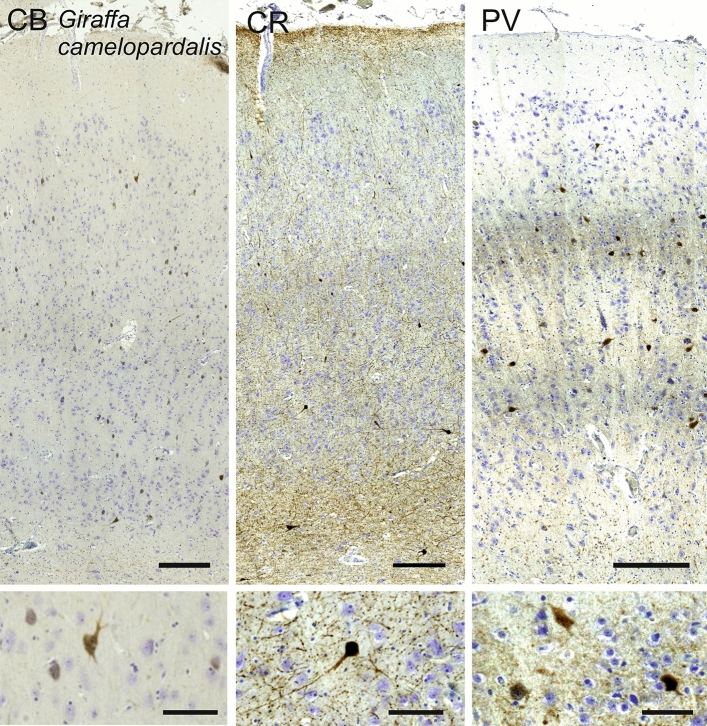
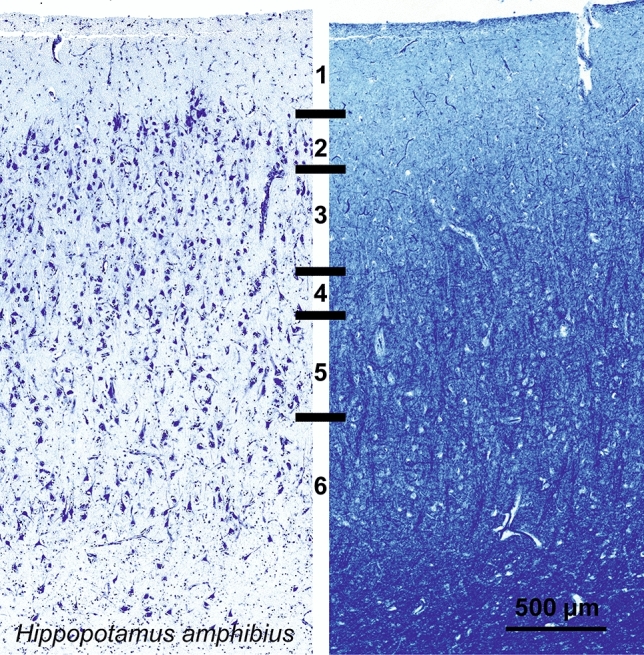
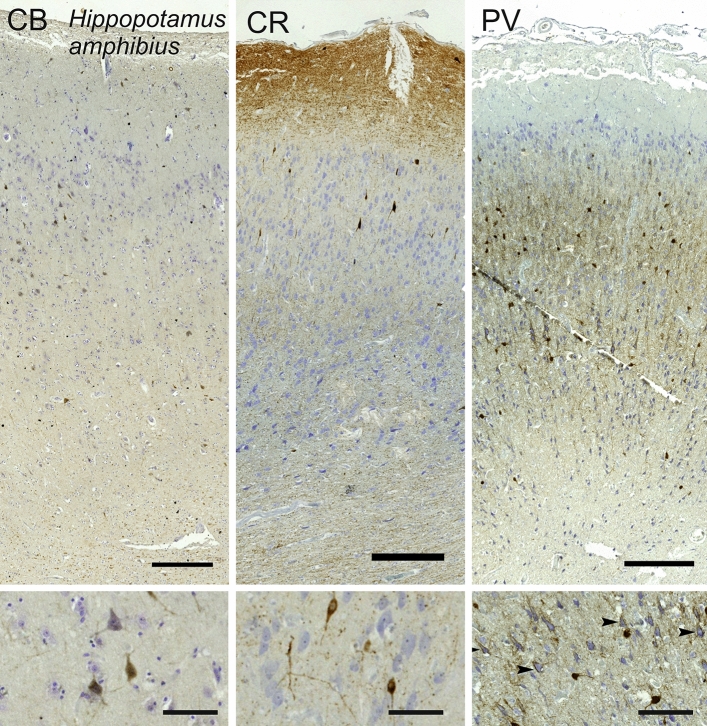
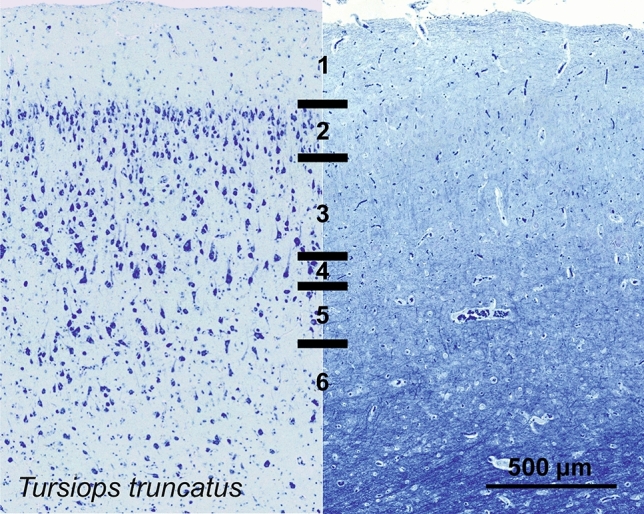
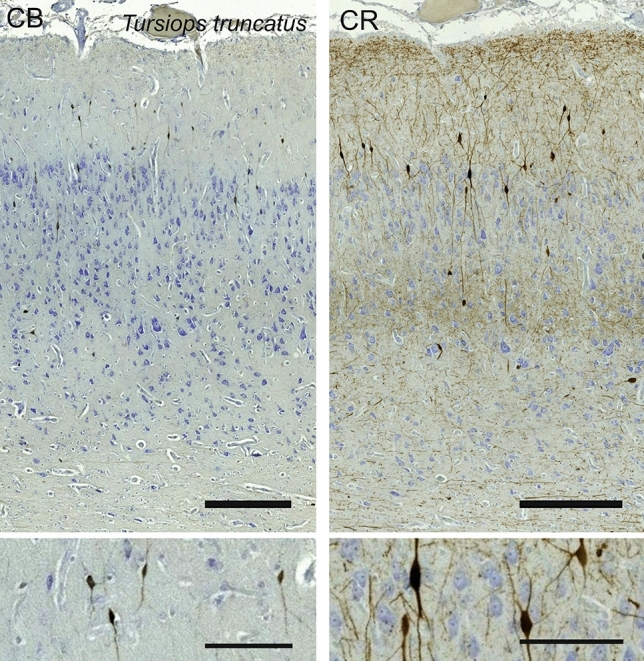
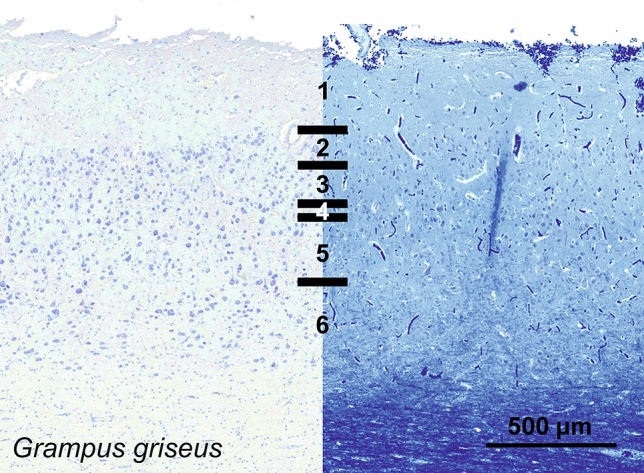
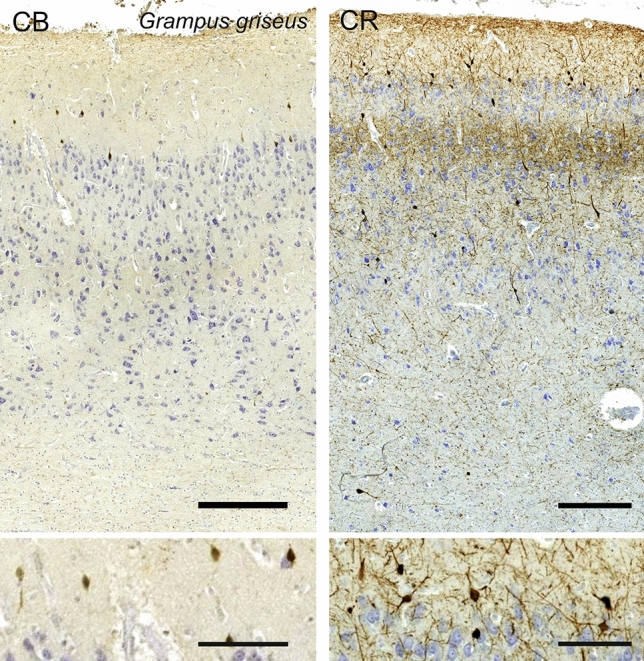
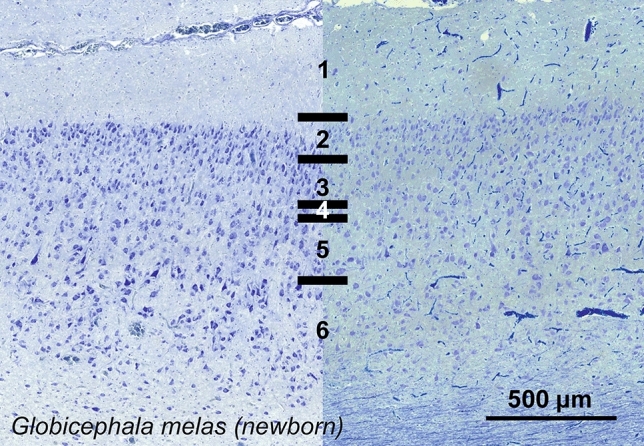
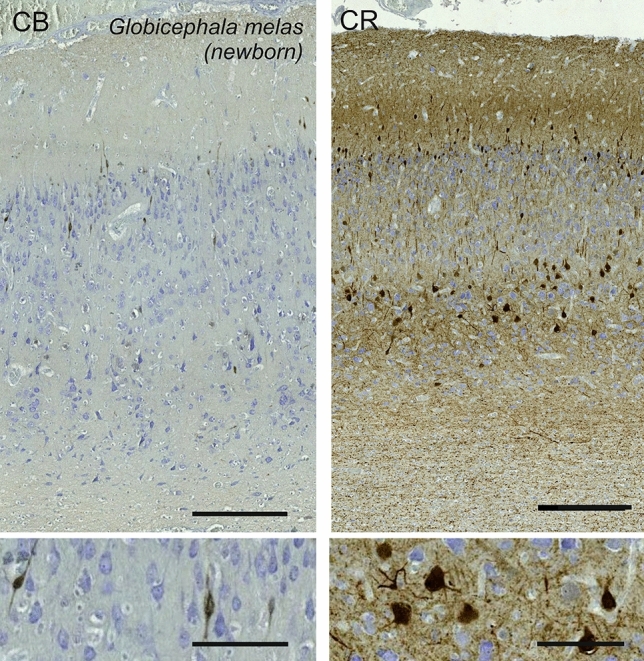
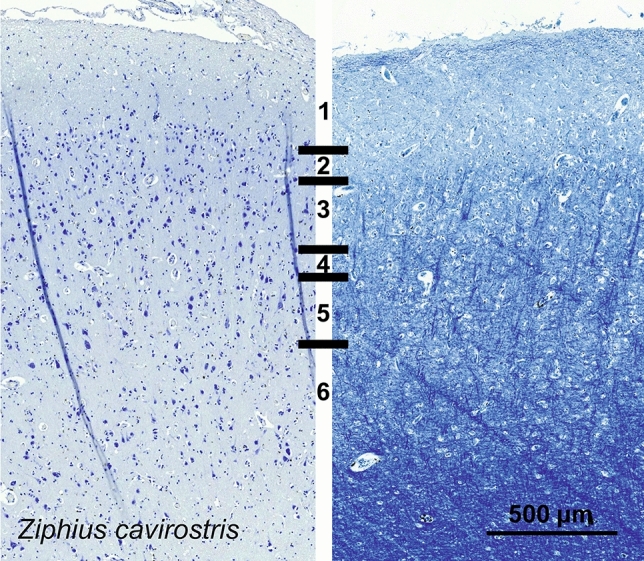
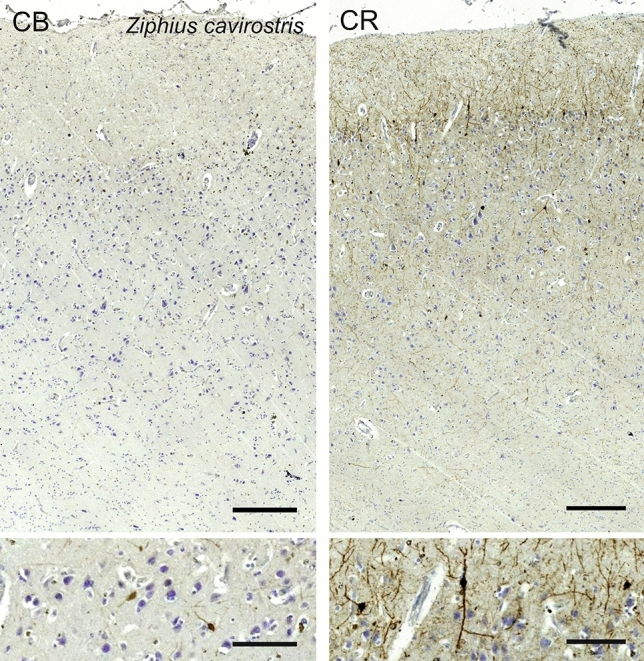
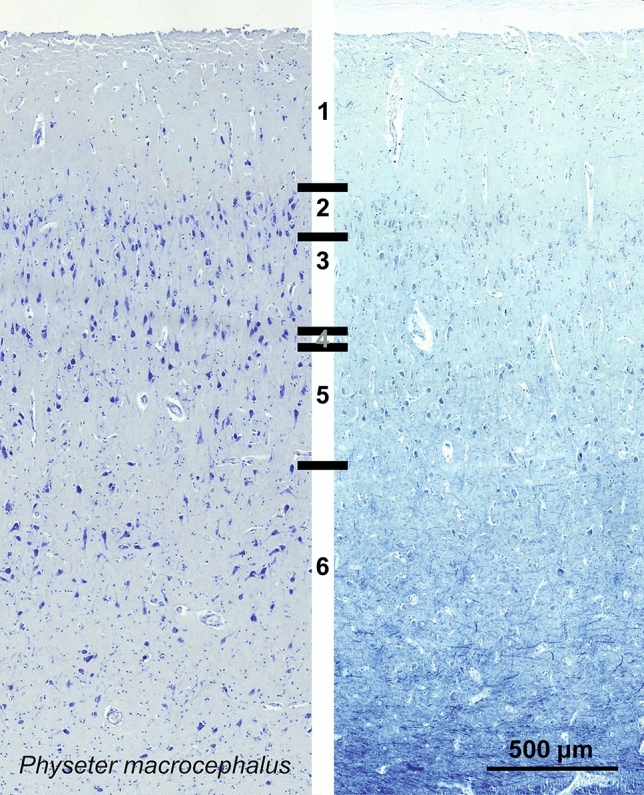
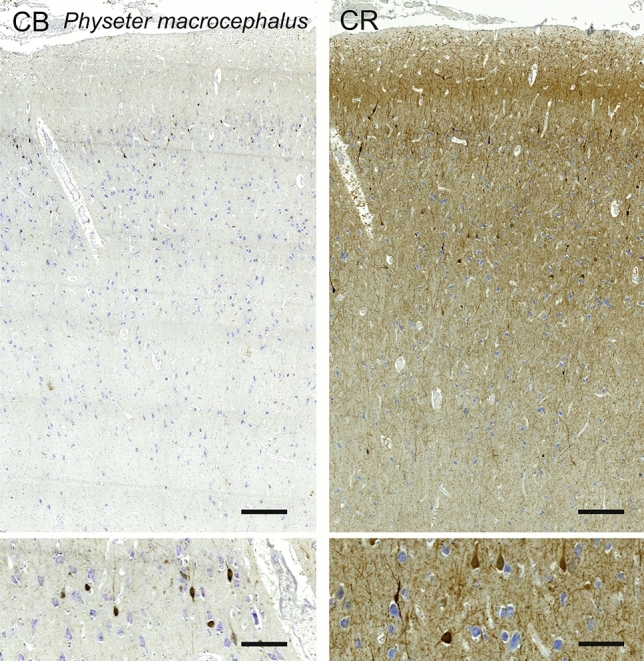
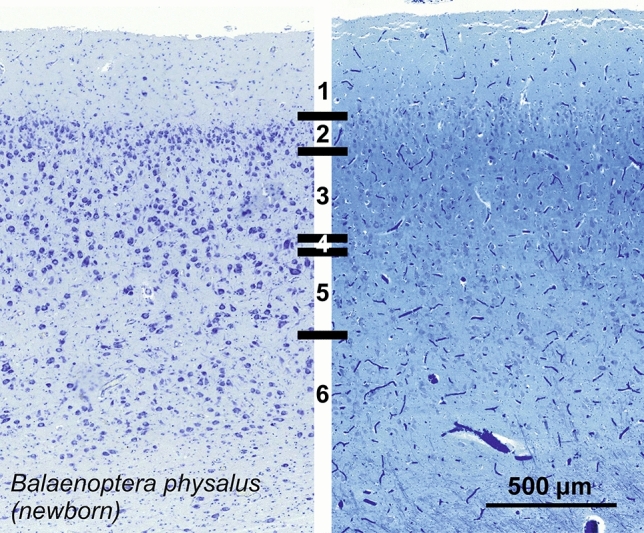
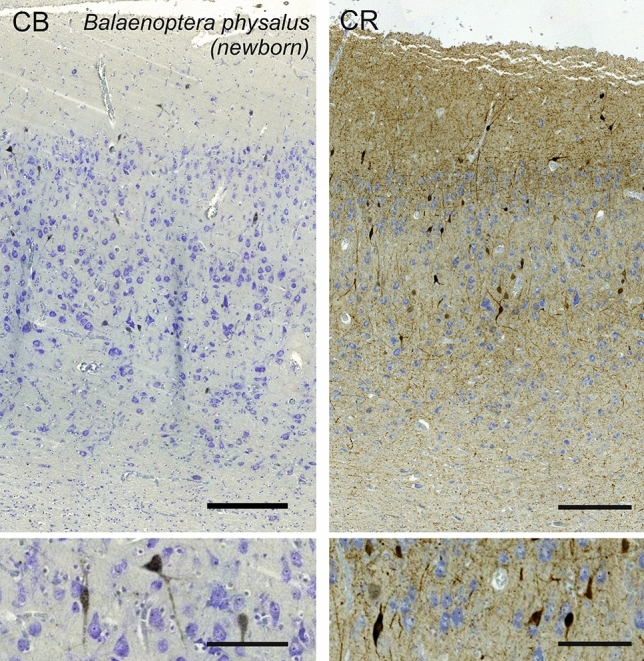
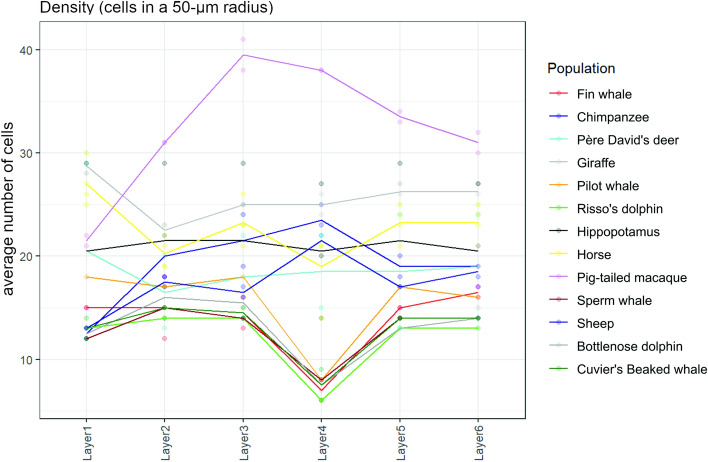
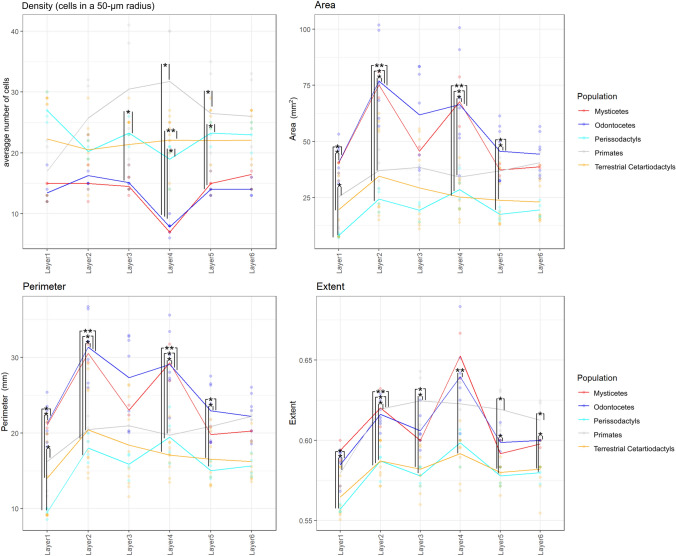
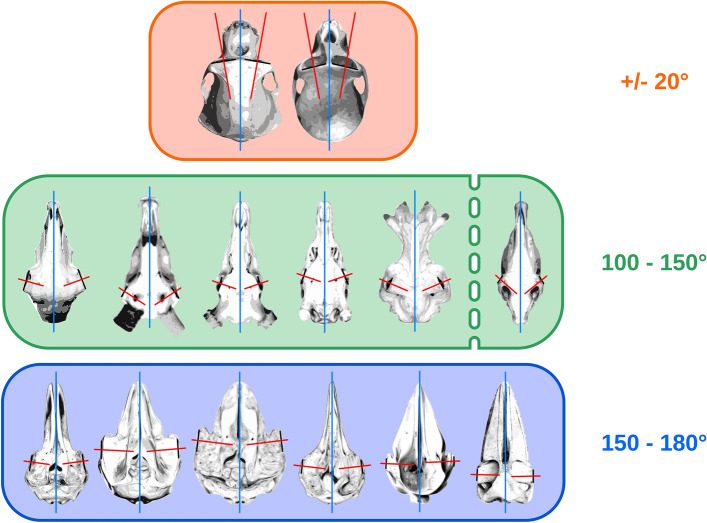
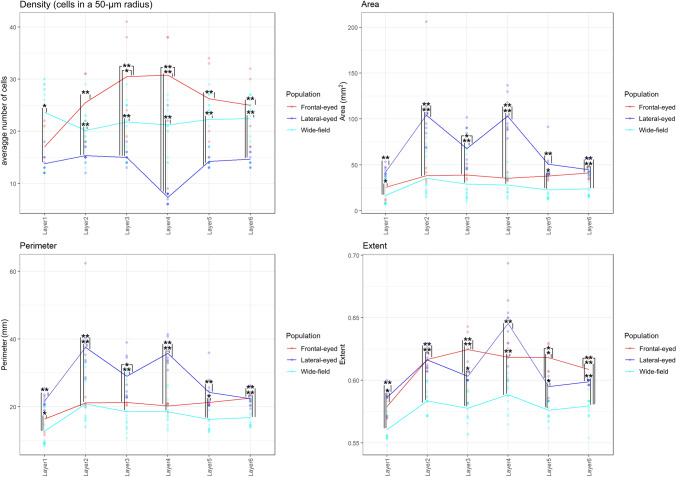
Cetartiodactyls include terrestrial and marine species, all generally endowed with a comparatively lateral position of their eyes and a relatively limited binocular field of vision. To this day, our understanding of the visual system in mammals beyond the few studied animal models remains limited. In the present study, we examined the primary visual cortex of Cetartiodactyls that live on land (sheep, Père David deer, giraffe); in the sea (bottlenose dolphin, Risso's dolphin, long-finned pilot whale, Cuvier's beaked whale, sperm whale and fin whale); or in an amphibious environment (hippopotamus). We also sampled and studied the visual cortex of the horse (a closely related perissodactyl) and two primates (chimpanzee and pig-tailed macaque) for comparison. Our histochemical and immunohistochemical results indicate that the visual cortex of Cetartiodactyls is characterized by a peculiar organization, structure, and complexity of the cortical column. We noted a general lesser lamination compared to simians, with diminished density, and an apparent simplification of the intra- and extra-columnar connections. The presence and distribution of calcium-binding proteins indicated a notable absence of parvalbumin in water species and a strong reduction of layer 4, usually enlarged in the striated cortex, seemingly replaced by a more diffuse distribution in neighboring layers. Consequently, thalamo-cortical inputs are apparently directed to the higher layers of the column. Computer analyses and statistical evaluation of the data confirmed the results and indicated a substantial correlation between eye placement and cortical structure, with a markedly segregated pattern in cetaceans compared to other mammals. Furthermore, cetacean species showed several types of cortical lamination which may reflect differences in function, possibly related to depth of foraging and consequent progressive disappearance of light, and increased importance of echolocation.

Keywords: Cetartiodactyls; Comparative neuroanatomy; Cytoarchitecture; Lamination; Lateralization; Visual cortex.


Conflict of interest statement

The authors declare no conflict of interest.

Figures

Fig. 1
Fig. 1
Microphotographs of Nissl and Klüver–Barrera tissue staining of primary visual cortices of selected species. The clear pattern of the Gennari line seen in the macaque is also very clear in the giraffe, which heavily relies on vision. It is also noticeable in the deer and sheep, but is not equally present in aquatic mammals. In the bottlenose dolphin, a hint of myelin double band is visible. This is less true in Cuvier’s beaked whale, and unnoticeable in the fin whale. The quality of the tissue might negatively influence myelin staining of the Klüver–Barrera in some cetacean species. All bars are 1 mm
Fig. 2
Fig. 2
Graphical representation of the cortical thickness measurement means. The values are in mm, the error bars represent the standard deviation
Fig. 3
Fig. 3
Photomicrograph of Nissl (left) and Kluver–Barrera (right) stain of the primary visual cortex of the pig-tailed macaque (Macaca nemestrina). The images have been voluntarily slightly overexposed to enhance the structure visualization
Fig. 4
Fig. 4
Microphotographs of CB-ir (left), CR-ir (middle) and PV-ir (right) neurons in the primary visual cortex of the pig-tailed macaque (Macaca nemestrina), with magnified inserts below. Bars are 300 μm, 100 μm in inserts
Fig. 5
Fig. 5
Photomicrograph of Nissl (left) and Kluver–Barrera (right) stain of the primary visual cortex of the chimpanzee (Pan troglodytes). The images have been voluntarily slightly overexposed to enhance the structure visualization
Fig. 6
Fig. 6
Microphotographs of CB-ir (left), CR-ir (middle) and PV-ir (right) neurons in the primary visual cortex of the chimpanzee (Pan troglodytes), with magnified inserts below. Bars are 300 μm, 100 μm in inserts
Fig. 7
Fig. 7
Photomicrograph of Nissl (left) and Kluver–Barrera (right) stain of the primary visual cortex of the horse (Equus caballus). The images have been voluntarily slightly overexposed to enhance the structure visualization
Fig. 8
Fig. 8
Microphotographs of CB-ir (left), CR-ir (middle) and PV-ir (right) neurons in the primary visual cortex of the horse (Equus caballus), with magnified inserts below. Bars are 300 μm, 100 μm in inserts
Fig. 9
Fig. 9
Photomicrograph of Nissl (left) and Kluver–Barrera (right) stain of the primary visual cortex of the sheep (Ovis aries). The images have been voluntarily slightly overexposed to enhance the structure visualization
Fig. 10
Fig. 10
Microphotographs of CB-ir (left), CR-ir (middle) and PV-ir (right) neurons in the primary visual cortex of the sheep (Ovis aries), with magnified inserts below. Bars are 300 μm, 100 μm in inserts
Fig. 11
Fig. 11
Photomicrograph of Nissl (left) and Kluver–Barrera (right) stain of the primary visual cortex of the Père David’s deer (Elaphurus davidianus). The images have been voluntarily slightly overexposed to enhance the structure visualization
Fig. 12
Fig. 12
Microphotographs of CB-ir (left), CR-ir (middle) and PV-ir (right) neurons in the primary visual cortex of the Père David’s deer (Elaphurus davidianus), with magnified inserts below. Bars are 300 μm, 100 μm in inserts
Fig. 13
Fig. 13
Photomicrograph of Nissl (left) and Kluver–Barrera (right) stain of the primary visual cortex of the giraffe (Giraffa camelopardalis). The images have been voluntarily slightly overexposed to enhance the structure visualization
Fig. 14
Fig. 14
Microphotographs of CB-ir (left), CR-ir (middle) and PV-ir (right) neurons in the primary visual cortex of the giraffe (Giraffa camelopardalis), with magnified inserts below. Bars are 300 μm, 100 μm in inserts
Fig. 15
Fig. 15
Photomicrograph of Nissl (left) and Kluver-Barrera (right) stain of the primary visual cortex of the hippopotamus (Hippopotamus amphibius). The images have been voluntarily slightly overexposed to enhance the structure visualization
Fig. 16
Fig. 16
Microphotographs of CB-ir (left), CR-ir (middle) and PV-ir (right) neurons in the primary visual cortex of the hippopotamus (Hippopotamus amphibius), with magnified inserts below. Bars are 300 μm, 100 μm in inserts
Fig. 17
Fig. 17
Photomicrograph of Nissl (left) and Kluver-Barrera (right) stain of the primary visual cortex of the bottlenose dolphin (Tursiops truncatus). The images have been voluntarily slightly overexposed to enhance the structure visualization
Fig. 18
Fig. 18
Microphotographs of CB-ir (left) and CR-ir (right) neurons in the primary visual cortex of the bottlenose dolphin (Tursiops truncatus), with magnified inserts below. Bars are 300 μm, 100 μm in inserts
Fig. 19
Fig. 19
Photomicrograph of Nissl (left) and Kluver–Barrera (right) stain of the primary visual cortex of Risso’s dolphin (Grampus griseus). The images have been voluntarily slightly overexposed to enhance the structure visualization
Fig. 20
Fig. 20
Microphotographs of CB-ir (left) and CR-ir (right) neurons in the primary visual cortex of Risso’s dolphin (Grampus griseus), with magnified inserts below. Bars are 300 μm, 100 μm in inserts
Fig. 21
Fig. 21
Photomicrograph of Nissl (left) and Kluver–Barrera (right) stain of the primary visual cortex of the long-finned pilot whale (Globicephala melas). The images have been voluntarily slightly overexposed to enhance the structure visualization
Fig. 22
Fig. 22
Microphotographs of CB-ir (left) and CR-ir (right) neurons in the primary visual cortex of the long-finned pilot whale (Globicephala melas), with magnified inserts below. Bars are 300 μm, 100 μm in inserts
Fig. 23
Fig. 23
Photomicrograph of Nissl (left) and Kluver–Barrera (right) stain of the primary visual cortex of Cuvier’s beaked whale (Ziphius cavirostris). The images have been voluntarily slightly overexposed to enhance the structure visualization
Fig. 24
Fig. 24
Microphotographs of CB-ir (left) and CR-ir (right) neurons in the primary visual cortex of Cuvier’s beaked whale (Ziphius cavirostris), with magnified inserts below. Bars are 300 μm, 100 μm in inserts
Fig. 25
Fig. 25
Photomicrograph of Nissl (left) and Kluver–Barrera (right) stain of the primary visual cortex of the sperm whale (Physeter macrocephalus). The images have been voluntarily slightly overexposed to enhance the structure visualization
Fig. 26
Fig. 26
Microphotographs of CB-ir (left) and CR-ir (right) neurons in the primary visual cortex of the sperm whale (Physeter macrocephalus), with magnified inserts below. Bars are 300 μm, 100 μm in inserts
Fig. 27
Fig. 27
Photomicrograph of Nissl (left) and Kluver–Barrera (right) stain of the primary visual cortex of the fin whale (Balaenoptera physalus). The images have been voluntarily slightly overexposed to enhance the structure visualization
Fig. 28
Fig. 28
Microphotographs of CB-ir (left) and CR-ir (right) neurons in the primary visual cortex of the fin whale (Balaenoptera physalus), with magnified inserts below. Bars are 300 μm, 100 μm in inserts
Fig. 29
Fig. 29
Graphical representation of the surface density measurements made by layer for each species in our sample. The unit of density is the median number of cells found in a 50-micron radius around a given cell. The dots above and below each line represent the variability (scatter) for each layer
Fig. 30
Fig. 30
Graphical linear distribution of selected parameters of the density (median number of cells found in a 50-micron radius around a given cell, top left panel), size (area and perimeter in microns, top right and bottom left panels) and shape (extent = ratio of pixels in the region to pixels in the total bounding box, returned as a scalar. Computed as the Area divided by the area of the bounding box) (bottom right panel) domains by layer for our samples regrouped by taxonomy. Significant differences are marked by asterisks (*for p ≤ 0.05; **for p ≤ 0.01)
Fig. 31
Fig. 31
Illustration of the eye position and orientation based off the orbital plane of the skulls from animals in the present work. This extrapolation is not accurate enough to predict correctly eye field of vision (Duke Elder, 1961); however, it remains helpful to visualize gross differences in the position resulting in the grouping in three categories that we named frontal-eyed (represented by primates), wide field (terrestrial Cetartiodactyls) and lateral-eyed (cetaceans)
Fig. 32
Fig. 32
Graphical linear distribution of selected parameters of the density (median number of cells found in a 50-micron radius around a given cell, top left panel), size (area and perimeter in microns, top right and bottom left panels) and shape (extent = ratio of pixels in the region to pixels in the total bounding box, returned as a scalar. Computed as the Area divided by the area of the bounding box) (bottom right panel) domains by layer for our samples regrouped by eye position. Significant differences are marked by asterisks (*for p ≤ 0.05; **for p ≤ 0.01)

Similar articles

Cited by

References

    1. Allman J, McGuinness E. Visual cortex in primates. Comp Primate Biol. 1988;4:279–326.
    1. Amunts K, Malikovic A, Mohlberg H, et al. Brodmann’s areas 17 and 18 brought into stereotaxic space—Where and how variable? Neuroimage. 2000;11:66–84. doi: 10.1006/nimg.1999.0516. - DOI - PubMed
    1. Andressen C, Blümcke I, Celio MR. Calcium-binding proteins: selective markers of nerve cells. Cell Tissue Res. 1993;271:181–208. doi: 10.1007/BF00318606. - DOI - PubMed
    1. Arboretti R, Bonnini S, Corain L, Salmaso L. A permutation approach for ranking of multivariate populations. J Multivar Anal. 2014;132:39–57. doi: 10.1016/j.jmva.2014.07.009. - DOI
    1. Bailey P, von Bonin G, McCulloch WS. The isocortex of the chimpanzee. University of Illinois Press; 1950.

LinkOut - more resources