

Influenza and RSV incidence during COVID-19 pandemic-an observational study from in-hospital point-of-care testing
- PMID: 34604931
- PMCID: PMC8487758
- DOI: 10.1007/s00430-021-00720-7
Influenza and RSV incidence during COVID-19 pandemic-an observational study from in-hospital point-of-care testing
Abstract
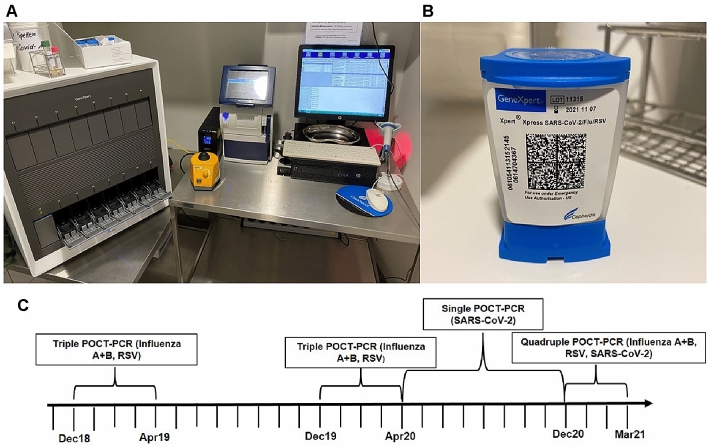
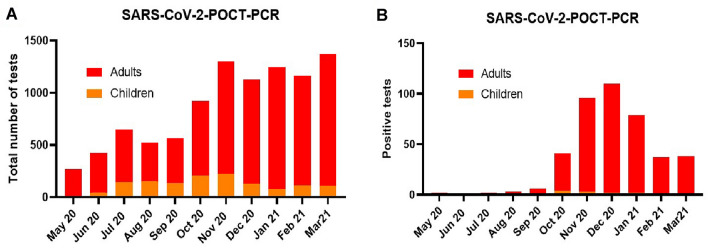
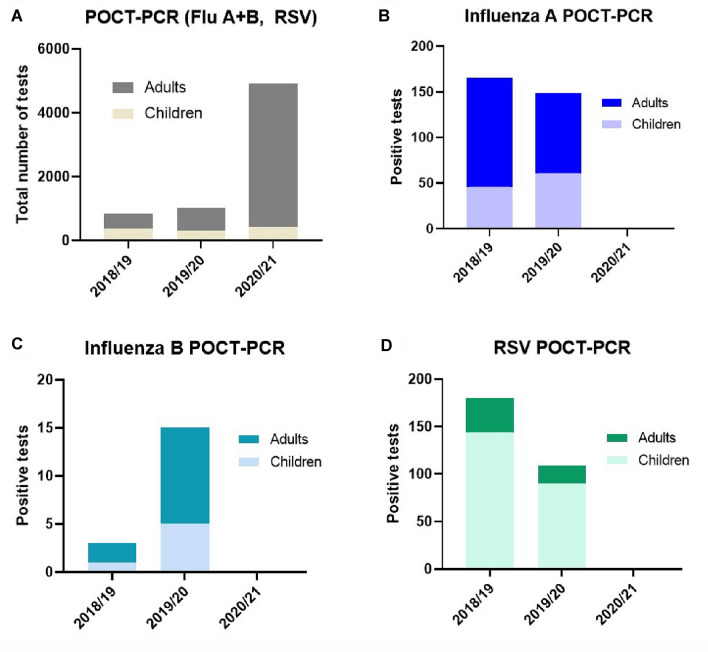
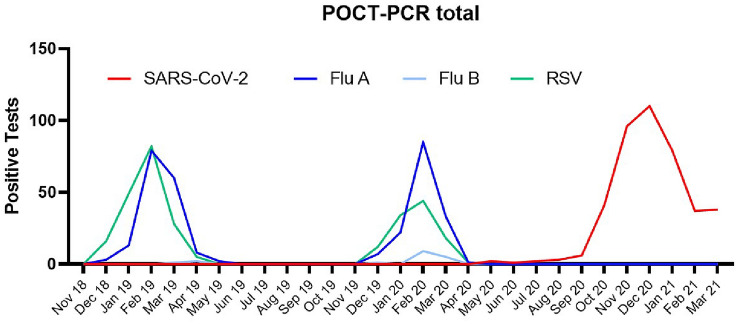
The severe acute respiratory syndrome coronavirus 2 (SARS-CoV-2) pandemic has forced the implementation of unprecedented public health measures strategies which might also have a significant impact on the spreading of other viral pathogens such as influenza and Respiratory Syncytial Virus (RSV) . The present study compares the incidences of the most relevant respiratory viruses before and during the SARS-CoV-2 pandemic in emergency room patients. We analyzed the results of in total 14,946 polymerase chain reaction point-of-care tests (POCT-PCR) for Influenza A, Influenza B, RSV and SARS-CoV-2 in an adult and a pediatric emergency room between December 1, 2018 and March 31, 2021. Despite a fivefold increase in the number of tests performed, the positivity rate for Influenza A dropped from 19.32% (165 positives of 854 tests in 2018/19), 14.57% (149 positives of 1023 in 2019-20) to 0% (0 positives of 4915 tests) in 2020/21. In analogy, the positivity rate for Influenza B and RSV dropped from 0.35 to 1.47%, respectively, 10.65-21.08% to 0% for both in 2020/21. The positivity rate for SARS-CoV2 reached 9.74% (110 of 1129 tests performed) during the so-called second wave in December 2020. Compared to the two previous years, seasonal influenza and RSV incidence was eliminated during the COVID-19 pandemic. Corona-related measures and human behavior patterns could lead to a significant decline or even complete suppression of other respiratory viruses such as influenza and RSV.
Keywords: COVID-19 influenza; In-hospital; Point-of-care testing; Polymerase chain reaction; Prevalence; RSV; SARS-CoV-2.
© 2021. The Author(s).
Conflict of interest statement
T.M. and T.G. are PI of the DZHK (German Center for Cardiovascular Research), Partner Site Rhine‐Main (Mainz), Germany. The authors declare that they have no conflicts of interest with the contents and no competing interests in connection with this manuscript.
Figures
Similar articles
-
Evaluation of Three Multiplex Real-time Reverse Transcription PCR Assays for Simultaneous Detection of SARS-CoV-2, Influenza A/B, and Respiratory Syncytial Virus in Nasopharyngeal Swabs.J Korean Med Sci. 2021 Dec 13;36(48):e328. doi: 10.3346/jkms.2021.36.e328. J Korean Med Sci. 2021. PMID: 34904407 Free PMC article.
-
Single-Center Experience in Detecting Influenza Virus, RSV and SARS-CoV-2 at the Emergency Department.Viruses. 2023 Feb 8;15(2):470. doi: 10.3390/v15020470. Viruses. 2023. PMID: 36851685 Free PMC article.
-
Diagnostic accuracy of Savanna RVP4 (QuidelOrtho) for the detection of Influenza A virus, RSV, and SARS-CoV-2.Microbiol Spectr. 2024 Aug 6;12(8):e0115324. doi: 10.1128/spectrum.01153-24. Epub 2024 Jul 11. Microbiol Spectr. 2024. PMID: 38990032 Free PMC article.
-
Multiplex molecular assays for the laboratory-based and point-of-care diagnosis of infections caused by seasonal influenza, COVID-19, and RSV.Expert Rev Mol Diagn. 2024 Nov;24(11):997-1008. doi: 10.1080/14737159.2024.2408745. Epub 2024 Oct 4. Expert Rev Mol Diagn. 2024. PMID: 39364620 Review.
-
The impact of the 2009 influenza pandemic on the seasonality of human respiratory syncytial virus: A systematic analysis.Influenza Other Respir Viruses. 2021 Nov;15(6):804-812. doi: 10.1111/irv.12884. Epub 2021 Jul 4. Influenza Other Respir Viruses. 2021. PMID: 34219389 Free PMC article.
Cited by
-
Educational inequalities in self-rated health and emotional exhaustion among workers during the COVID-19 pandemic: a longitudinal study.Int Arch Occup Environ Health. 2023 Apr;96(3):401-410. doi: 10.1007/s00420-022-01931-y. Epub 2022 Nov 2. Int Arch Occup Environ Health. 2023. PMID: 36322181 Free PMC article.
-
Impact of Nirsevimab Immunization on Pediatric Hospitalization Rates: A Systematic Review and Meta-Analysis (2024).Vaccines (Basel). 2024 Jun 8;12(6):640. doi: 10.3390/vaccines12060640. Vaccines (Basel). 2024. PMID: 38932369 Free PMC article. Review.
-
The implication of infection with respiratory syncytial virus in pediatric recurrent wheezing and asthma: knowledge expanded post-COVID-19 era.Eur J Clin Microbiol Infect Dis. 2024 Mar;43(3):403-416. doi: 10.1007/s10096-023-04744-0. Epub 2023 Dec 28. Eur J Clin Microbiol Infect Dis. 2024. PMID: 38153660 Review.
-
Age-sex differences in the global burden of lower respiratory infections and risk factors, 1990-2019: results from the Global Burden of Disease Study 2019.Lancet Infect Dis. 2022 Nov;22(11):1626-1647. doi: 10.1016/S1473-3099(22)00510-2. Epub 2022 Aug 11. Lancet Infect Dis. 2022. PMID: 35964613 Free PMC article.
-
Trends of respiratory viruses and factors associated with severe acute respiratory infection in patients presenting at a university hospital: a 6-year retrospective study across the COVID-19 pandemic.Front Public Health. 2025 Mar 28;13:1494463. doi: 10.3389/fpubh.2025.1494463. eCollection 2025. Front Public Health. 2025. PMID: 40226317 Free PMC article.
References
-
- World Health Organization (WHO) Coronavirus disease (COVID-19) dashboard. https://covid19.who.int/. Accessed Sept 2021
-
- COVID-19 dashboard by the Center for Systems Science and Engineering (CSSE) at Johns Hopkins University. https://coronavirus.jhu.edu/map.html. Accessed Sept 2021
Publication types
MeSH terms
LinkOut - more resources
Full Text Sources
Medical
Miscellaneous
