

PLK1-dependent phosphorylation restrains EBNA2 activity and lymphomagenesis in EBV-infected mice
- PMID: 34605140
- PMCID: PMC8647151
- DOI: 10.15252/embr.202153007
PLK1-dependent phosphorylation restrains EBNA2 activity and lymphomagenesis in EBV-infected mice
Abstract
While Epstein-Barr virus (EBV) establishes a life-long latent infection in apparently healthy human immunocompetent hosts, immunodeficient individuals are at particular risk to develop lymphoproliferative B-cell malignancies caused by EBV. A key EBV protein is the transcription factor EBV nuclear antigen 2 (EBNA2), which initiates B-cell proliferation. Here, we combine biochemical, cellular, and in vivo experiments demonstrating that the mitotic polo-like kinase 1 (PLK1) binds to EBNA2, phosphorylates its transactivation domain, and thereby inhibits its biological activity. EBNA2 mutants that impair PLK1 binding or prevent EBNA2 phosphorylation are gain-of-function mutants. They exhibit enhanced transactivation capacities, accelerate the proliferation of infected B cells, and promote the development of monoclonal B-cell lymphomas in infected mice. Thus, PLK1 coordinates the activity of EBNA2 to attenuate the risk of tumor incidences in favor of the establishment of latency in the infected but healthy host.
Keywords: B-lymphomagenesis; EBNA2; EBV; PLK1; humanized mice.
© 2021 The Authors. Published under the terms of the CC BY 4.0 license.
Conflict of interest statement
The authors declare that they have no conflict of interest.
Figures

- A, B
Co‐immunoprecipitation (IP) of EBNA2 (A) and PLK1 (B) using EBNA2‐, PLK1‐specific antibodies, or isotype‐matched control antibodies performed on total cell lysates (L) of lymphoblastoid long‐term B‐cell cultures (LCLs) infected with recombinant EBV strain 2089, which is based on EBV strain B95‐8 (Delecluse et al, 1998).
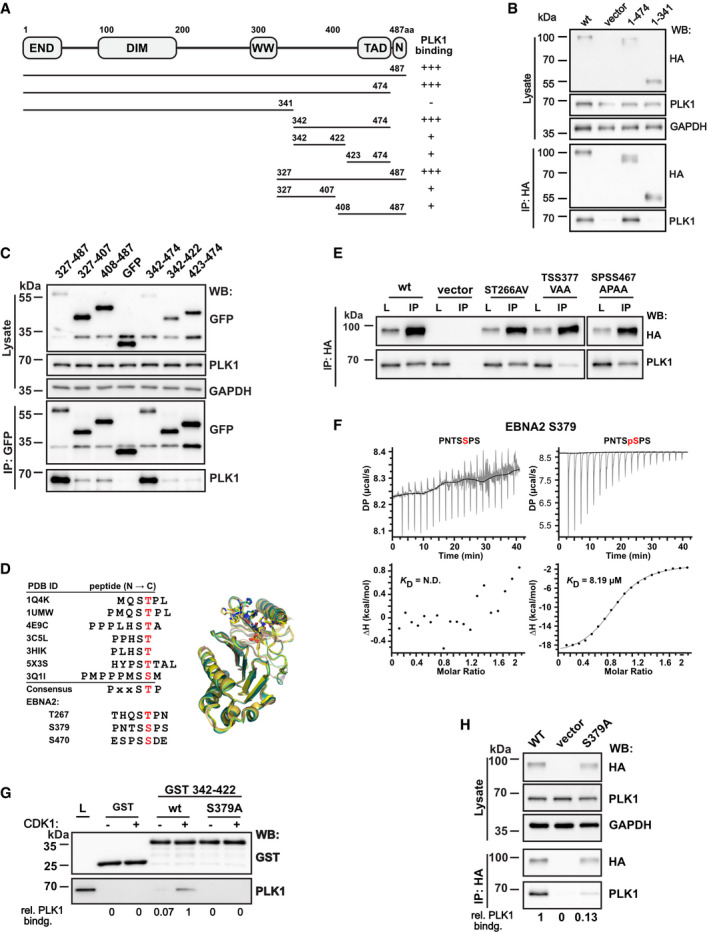
- A–C
(A) Schematic outline of EBNA2, its dimerization domains (END, DIM), the region used by CBF1 to recruit EBNA2 to DNA (WW), the C‐terminal transactivation domain (TAD), the nuclear localization signal (N), and the EBNA2 fragments used to map the PLK1 docking site (UniProt ID: P12978.1). The panel on the right summarizes the results of the co‐immunoprecipitations in (B) and (C). Transfection of DG75 B cells and immunoprecipitation of (B) HA‐tagged or for smaller fragments (C) GFP‐tagged EBNA2 fragments to co‐precipitate endogenous PLK1. Total protein lysates and immunoprecipitates (IP) were analyzed by Western blotting (WB).
- D
Multiple sequence alignment (left) and superposition (right) of several phosphopeptides present in published crystal structures of PLK1 PBD (phosphorylated residues stained red). Crystal structures of the PBD in complex with peptides show that the positively charged groove of PBD docks in a similar mode to the negatively charged phosphopeptides. References for PDB ID: 1Q4K (Cheng et al, 2003), 1UMW (Elia et al, 2003a), 4E9C (Śledź et al, 2012), 3C5L (Yun et al, 2009), 3HIK (Yun et al, 2009), 5X3S (Lee et al, 2018), and 3Q1I (Pavlovsky et al, 2012). Potential residues of EBNA2, which might be a PBD docking site, are listed below.
- E
Immunoprecipitation of HA‐tagged EBNA2 mutant ST266AV, TSS377VAA, and SPSS467APAA using HA‐specific antibodies.
- F
ITC thermogram of PLK1 PBD titrated with the peptide PNTSSPS or the phosphopeptide PNTSpSPS of EBNA2.
- G
GST‐pulldown of PLK1 from total cellular extracts using Cyclin B/CDK1 phosphorylated GST‐EBNA2 region 342–422.
- H
Co‐immunoprecipitation of transfected EBNA2 wt or S379A and endogenous PLK1.

- A
Doxycycline (Dox) induction of EBNA2 in DG75Dox HA‐EBNA2 cells treated for 24 h. Co‐immunoprecipitates of HA‐EBNA2 and endogenous PLK1 are visualized by Western blotting.
- B
EBNA2/PLK1 co‐precipitates were submitted to kinase reactions using [γ‐32P] ATP in the absence (control) or presence of 50 ng recombinant active PLK1.
- C
EBNA2 co‐precipitates were submitted to kinase reactions in the absence (control) or the presence of the PLK1 inhibitor Volasertib (40 nM).
- D
EBNA2 candidate phosphorylation mutants were expressed in DG75 B cells and tested for PLK1 binding by co‐immunoprecipitations followed by Western blotting.
- E
Immunoprecipitates were submitted to kinase reactions as in B, but samples were treated with Volasertib (40 nM) (+) or treated with solvent only (−).
- F
GST‐EBNA2 fragment 246–487 wt and mutant S457A/T465V were treated with recombinant active PLK1 (+) in the presence of [γ‐32P] ATP in vitro or left untreated (−). CRS, an artificial PLK1 test substrate (Yuan et al, 2002), was used as a positive control.
- G
Schematic presentation of EBNA2 phosphorylation sites by CDK1 and PLK1.
- H
HA‐tagged EBNA2 candidate phosphorylation mutants were expressed in DG75 B cells and tested for activation of an EBNA2/CBF1 responsive promoter reporter luciferase plasmid. Activation of the reporter gene is shown as relative response ratio normalized to Renilla luciferase activity and shown relative to wt activity. Data were presented as the mean ± SEM of n = 3 biological replicates. Statistical significance was tested by one‐way ANOVA followed by Tukey’s multiple comparison test (ns: not significant, ***P < 0.001, ****P < 0.0001, vs WT).
- I
GST‐pulldown assay using GST‐EBNA2 446‐474 as a bait to purify cellular proteins from DG75 cells followed by Western blotting and quantification of signals obtained by GST‐ and p300‐specific antibodies. Relative binding affinities (rel. p300 bindg.) are normalized to the wt signal. Since 3 lanes of the original blot were excised a broken line marks the borders between two parts in the figure.

- A–E
(A) LVQPHVPPLRPTAPTILSPLSQPR, (B) MHLPVLHVPDQSMHPLTHQSTPNDPDSPEPR, (C) DLDESWDYIFETTESPSSDER, (D) TTESPSSDEDYVEGPSKRPRPSIQ, and (E) DYVEGPSKRPRPSIQ, bearing 5 confidentially localized phosphorylation sites, S184, 258, 457, T465, and S479, respectively. The “ph” denotes phosphosites localized. The a‐, b‐, and y‐ions are in pale blue, dark blue, and red, respectively. Ions with neutral losses are in orange, internal fragment ions in purple, ammonium ion in green, and side‐chain loss in turquoise. The asterisk (*) denotes loss of H3O4P with a delta mass of 97.9768 from the phosphorylated fragment ion.
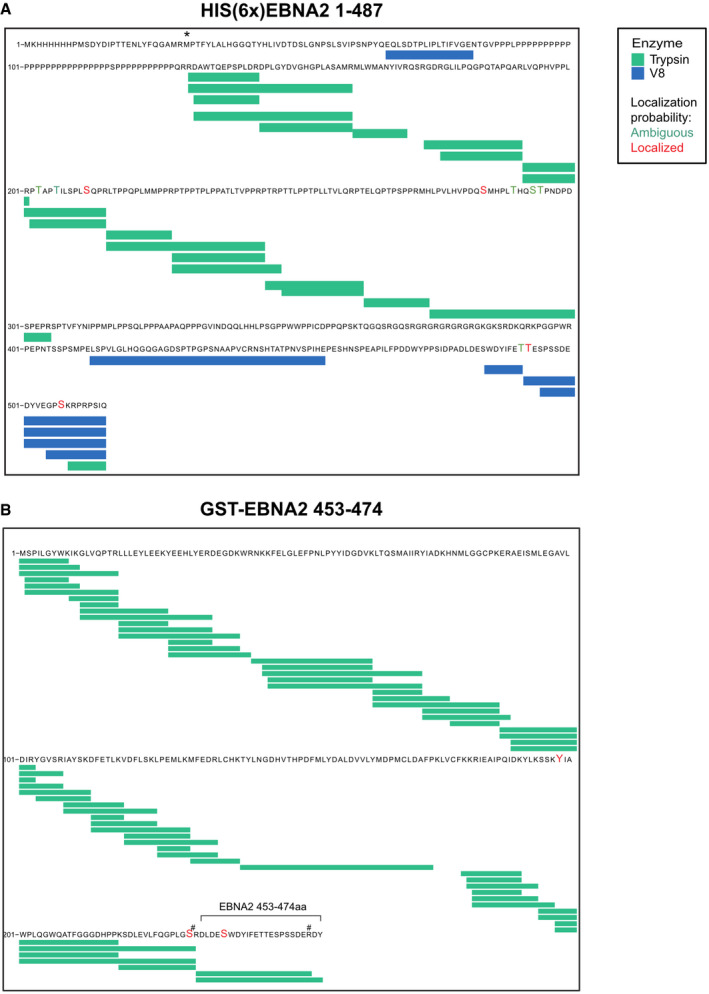
- A, B
(A) 6x His‐tagged EBNA2 and (B) GST‐EBNA2 453–474 phosphorylated by PLK1. Proteins were expressed in E. coli and extracted after SDS–PAGE separation, digested by trypsin (green bars) and V8 (blue bars) in parallel and submitted to LC‐MS/MS (enlarged letters in red or green). The sign # denotes Arg (R) inserted to facilitate fragmentation. The asterisk (*) denotes the initial Met (M) of EBNA2. Proteins before phosphorylation by PLK1 were studied in parallel but no phosphorylation sites were identified. The sequence corresponds to UniProt ID: P12978.1.


- A
Flag‐tagged active (PLK1) and kinase inactive PLK1 (K82 M) were co‐expressed with HA‐EBNA2 wt, docking site mutant (S379A) and phosphorylation mutant (S457A/T465V) and tested for activation of an EBNA2/CBF1 responsive promoter reporter in DG75 cells. Activation of the reporter firefly luciferase gene is shown as relative response ratio normalized to Renilla luciferase activity and shown relative to EBNA2 wt activity. Data were presented as the mean ± SEM of n = 3 biological replicates. Statistical significance was tested by two‐way ANOVA followed by Tukey’s multiple comparison test (ns: not significant, *P < 0.05, **P < 0.01).
- B
30 µg of cellular extracts that were produced for luciferase assays were tested for protein expression using Flag‐, HA‐ and GAPDH‐specific antibodies.

- A
Electrophoretic separation of the restriction digest of EBV Bac DNA: p6008 (precursor), pXZ135 (insertion of Kan/rpsL as a precursor for EBV HA‐EBNA2), and pXZ143 (EBV HA‐EBNA2=EBV wt). The arrows highlight distinct fragments that characterize the individual BACs in size upon Kan/rpsL insertion and deletion (6,005 bp → 7,353 bp → 6,035 bp). Molecular markers: λ DNA‐Hind III digest (nonitalics) and λ DNA‐BstE II digest (italics). (#) denotes the fragment derived from fragments denoted by asterisks (*).
- B
Sanger sequencing of pXZ143 to confirm the insertion of the HA‐tag into EBNA2 in the backbone of p6008.
- C, D
Sanger sequencing of pXZ203 (C) and pXZ146 (D) to confirm the substitution of S379A and S457A/T465V, respectively.
- E
Gating strategy of cell trace violet‐stained active B cells after EBV infection.
- F
Adenoid B cells were stained with cell trace violet before they were infected with EBV mutants as indicated and analyzed by flow cytometry.

- A–D
Flow‐cytometric analyses of (A) CD8+ or (B) CD4+ T‐cell percentages and (C) CD8+ and (D) CD4+ T‐cell activation in the blood of mice infected with wt or mutant EBV over a period of 5 weeks. Error bars indicate mean ± SD. Number of biological replicates per group: EBNA2 WT EBV weeks 0, 2, 4, and 5: n = 10, week 3: n = 5; EBNA2 S379A weeks 0, 2, 4, and 5: n = 8, week 3: n = 4; EBNA2 S457A T465V weeks 0 and 2: n = 8, week 3: n = 3, week 4: n = 6, week 5: n = 3.
- E–I
(E) Analyses of CD4+ and CD8+ T‐cell subpopulations and activation of (F) CD4+ and (G) CD8+ subpopulations in the spleen. Frequencies of (H) CD8+ and (I) CD4+ naïve, terminally differentiated (Temra), central memory (TCM), and effector memory (Tem) T‐cell subpopulations. Error bars indicate mean ± SD. Number of biological replicates per group: EBNA2 WT: n = 13; EBNA2 S379A: n = 11; EBNA2 S457A T465V: n = 9.

- A
Primary B cells were stained with cell trace violet before they were infected, and cell cultures were started. Loss of the fluorescent cell tracking dye was recorded by flow cytometry to monitor proliferation on days 0, 4 and 6 post‐infection. Mean values for three biological replicates, standard deviation, and significance of changes in signal loss of mutants compared with wild‐type controls Data were presented as the mean ± SEM of n = 3 biological replicates. Statistical significance was tested by two‐way ANOVA followed by Tukey’s multiple comparison test (*P < 0.05, ***P < 0.001, ****P < 0.0001, vs WT).
- B
Long‐term growth‐transformed B‐cell cultures infected with recombinant EBV mutants were seeded at a starting concentration of 2 × 10⁵ cells per ml. Data were presented as the mean ± SEM of n = 4 biological replicates. Statistical significance was tested by two‐way ANOVA followed by Tukey’s multiple comparison test (*P < 0.05, **P < 0.01, ****P < 0.0001, vs WT).
- C
Expression of EBNA2, LMP1, PLK1, MYC, and GAPDH was analyzed by Western blotting and immunostaining of whole cell extracts of cell lines established from 3 individual donors.

- A
Experimental setup (Images of animals, syringes, and blood collection tubes are derived from Servier Medical Art.).
- B
Survival curve of humanized mice infected with 105 GRU EBV wt (n = 13), EBV S379A (n = 11), or EBV S457A/T465V EBV (n = 9). Log‐rank test.
- C
Percentage of mice having macroscopically visible tumors at the day of sacrifice. Numbers within bars indicate the total number of mice with or without tumors in the respective groups. Fisher's exact test.
- D
Viral loads in spleen of infected humanized mice at the day of sacrifice. Error bars indicate mean ± SEM. Number of biological replicates per group: EBNA2 WT EBV: n = 13; EBNA2 S379A EBV: n = 11; EBNA2 S457A T465V EBV: n = 9.
- E
Development of viral loads in blood of infected mice over a period of 5 weeks. Error bars indicate mean ± SEM. Number of biological replicates per group: EBNA2 WT EBV weeks 2–5: n = 8; EBNA2 S379A EBV weeks 2–5: n = 7; EBNA2 S457A T465V EBV week 2: n = 9, week 3: n = 8, week 4 and week 5: n = 7.
- F
Flow‐cytometric analyses of CD8+/CD4+ T‐cell ratios in the blood of infected mice over a period of 5 weeks. Error bars indicate mean ± SD. Number of biological replicates per group: EBNA2 WT EBV weeks 0, 2, 4, and 5: n = 13, week 3: n = 8; EBNA2 S379A weeks 0, 2, 4, and 5: n = 11, week 3: n = 7; EBNA2 S457A T465V weeks 0 and 2: n = 12, week 3: n = 7, week 4: n = 10, week 5: n = 9.
References
-
- Ando K, Ozaki T, Yamamoto H, Furuya K, Hosoda M, Hayashi S, Fukuzawa M, Nakagawara A (2004) Polo‐like kinase 1 (Plk1) inhibits p53 function by physical interaction and phosphorylation. J Biol Chem 279: 25549–25561 - PubMed
-
- Barr FA, Silljé HHW, Nigg EA (2004) Polo‐like kinases and the orchestration of cell division. Nat Rev Mol Cell Biol 5: 429–440 - PubMed
-
- Ben‐Bassat H, Goldblum N, Mitrani S, Goldblum T, Yoffey JM, Cohen MM, Bentwich Z, Ramot B, Klein E, Klein G (1977) Establishment in continuous culture of a new type of lymphocyte from a "Burkitt like" malignant lymphoma (line D.G.‐75). Int J Cancer 19: 27–33 - PubMed
-
- Berger C, Day P, Meier G, Zingg W, Bossart W, Nadal D (2001) Dynamics of Epstein‐Barr virus DNA levels in serum during EBV‐associated disease. J Med Virol 64: 505–512 - PubMed
Publication types
MeSH terms
Substances
LinkOut - more resources
Full Text Sources
Molecular Biology Databases
Miscellaneous
