

Metabolomic Detection Between Pancreatic Cancer and Liver Metastasis Nude Mouse Models Constructed by Using the PANC1-KAI1/CD82 Cell Line
- PMID: 34605330
- PMCID: PMC8493323
- DOI: 10.1177/15330338211045204
Metabolomic Detection Between Pancreatic Cancer and Liver Metastasis Nude Mouse Models Constructed by Using the PANC1-KAI1/CD82 Cell Line
Abstract
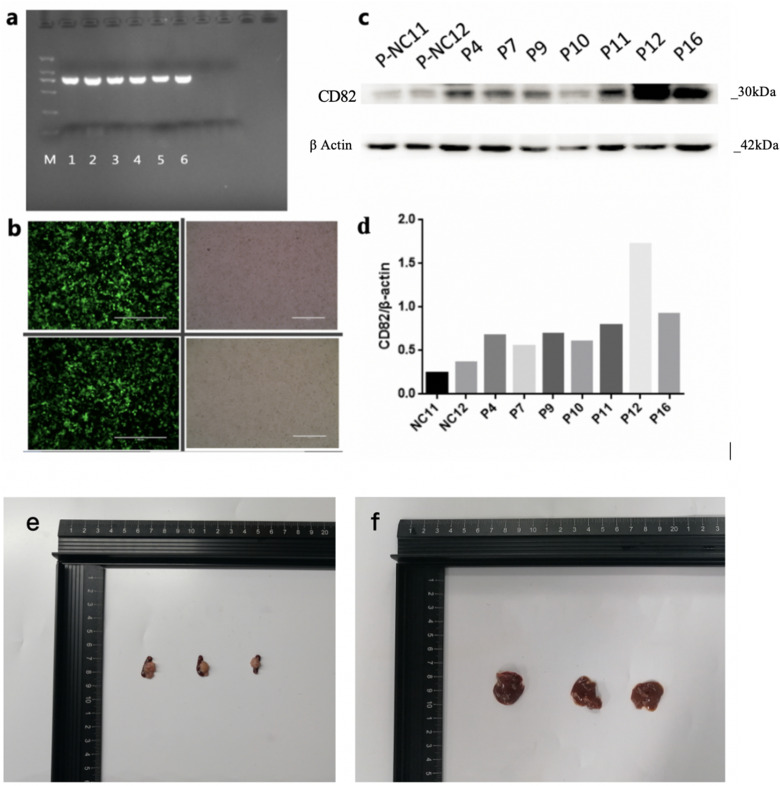
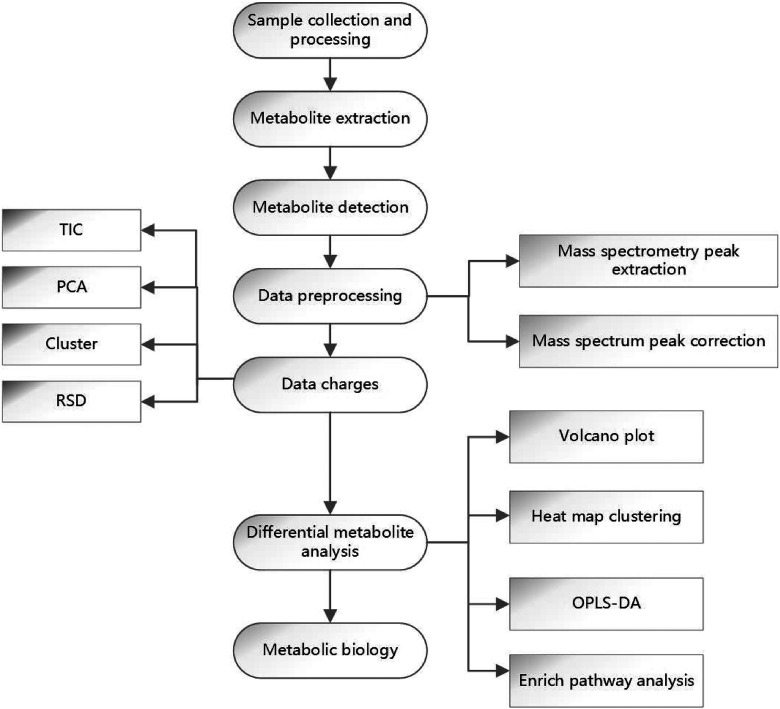
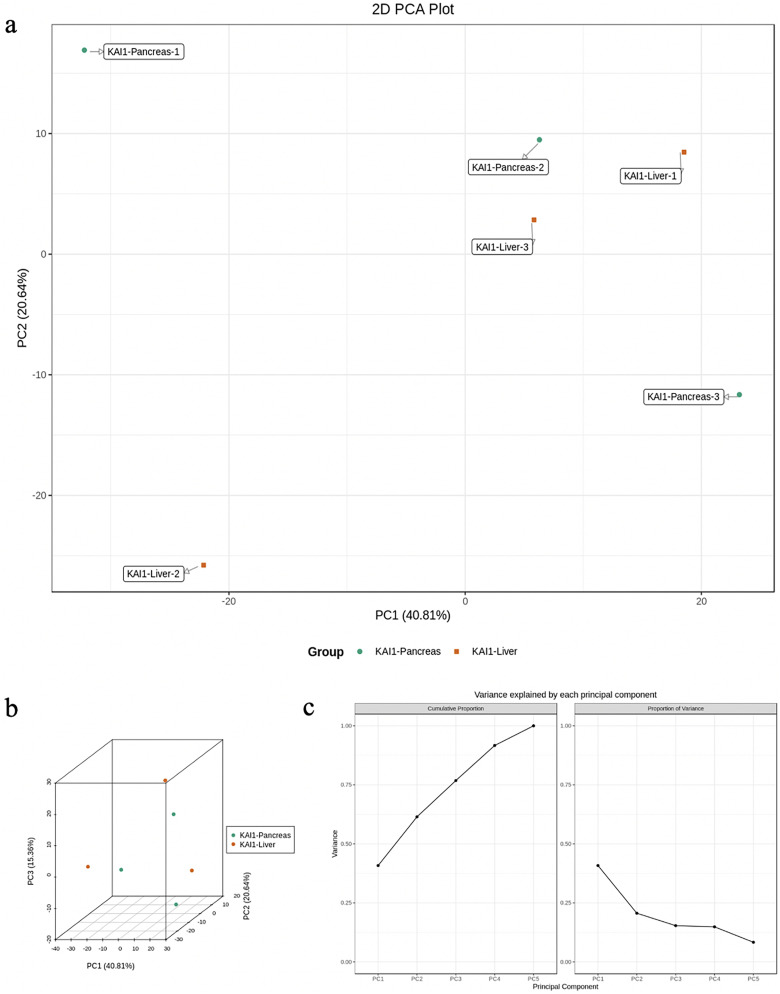
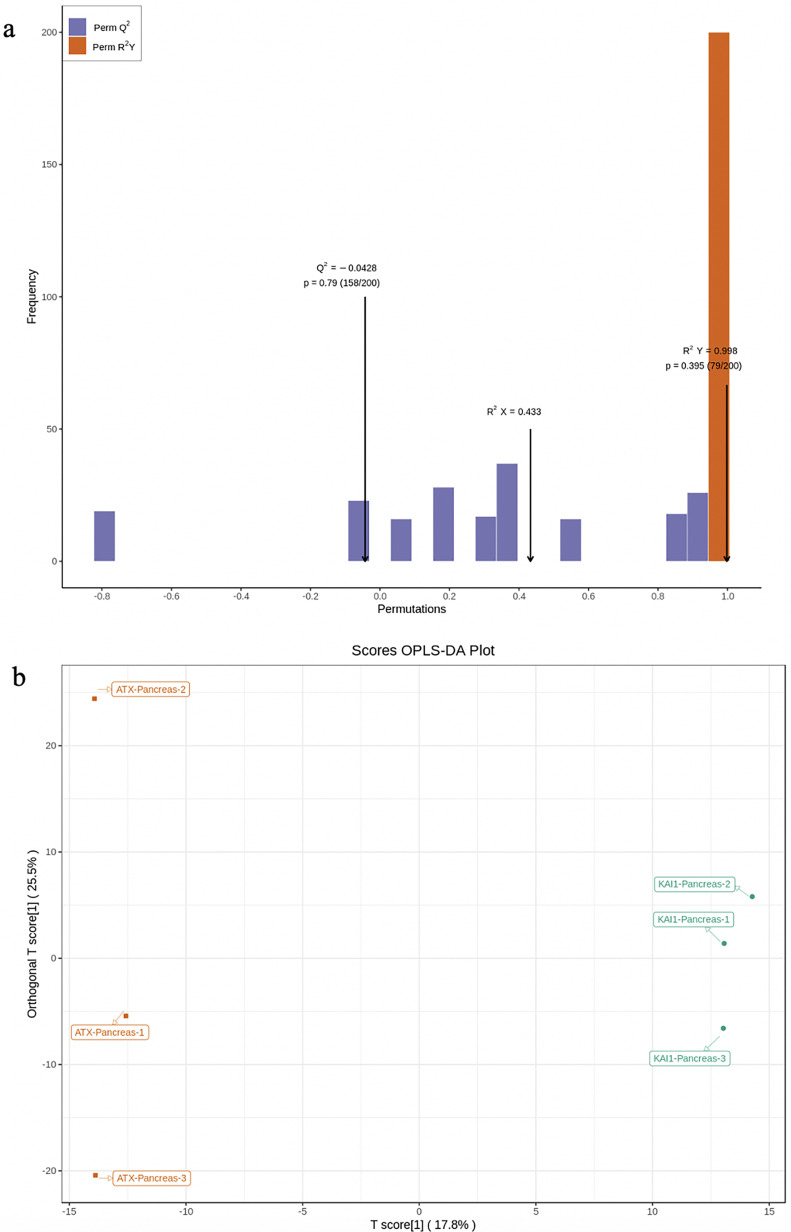
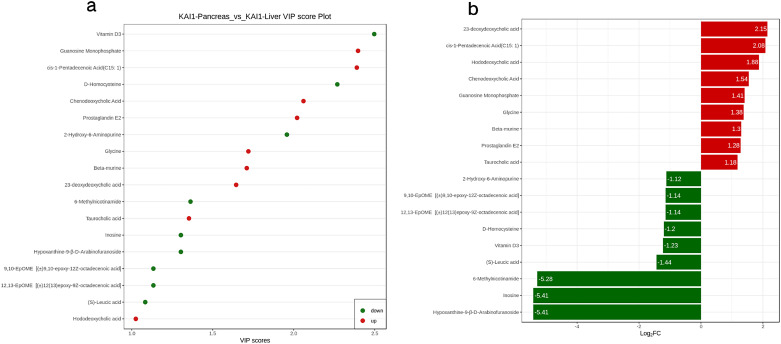
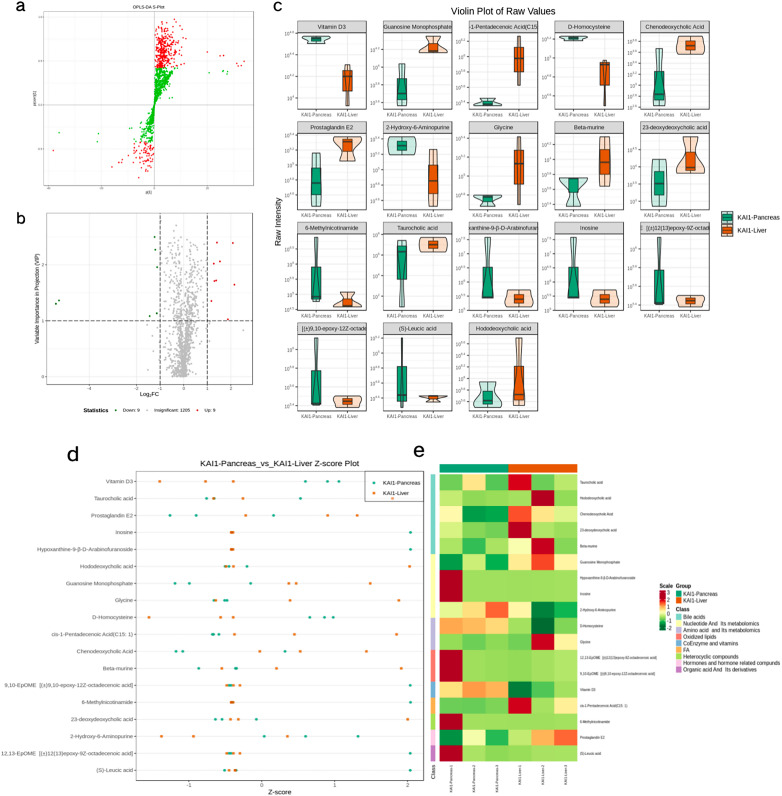
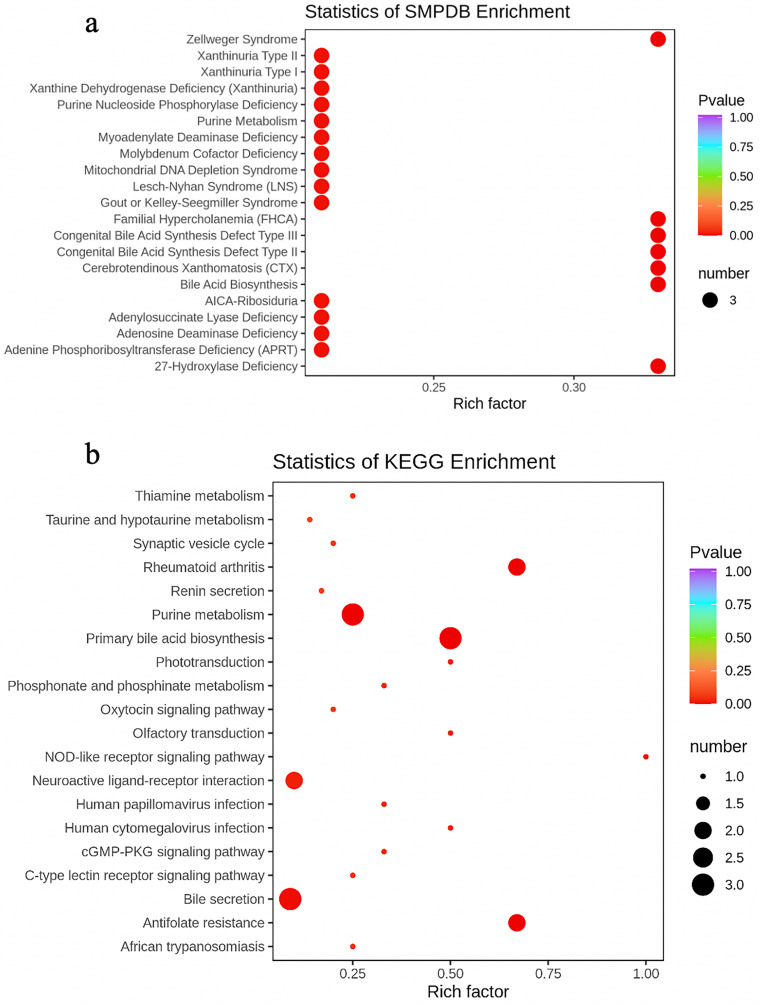
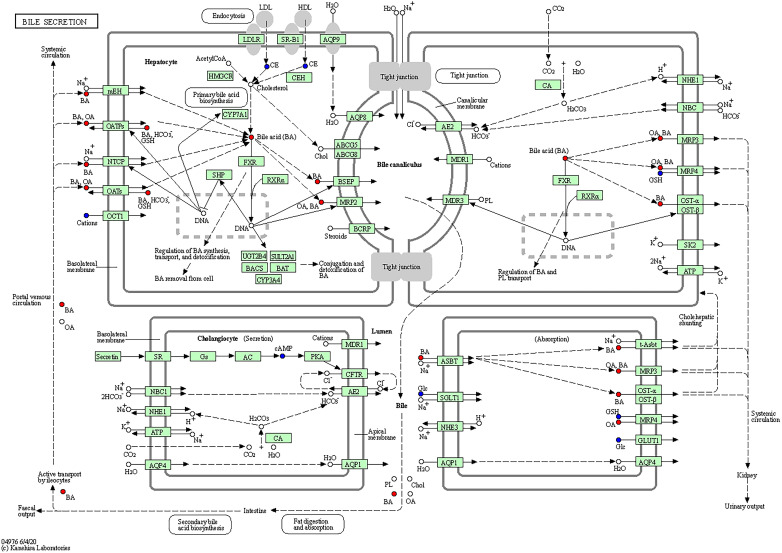
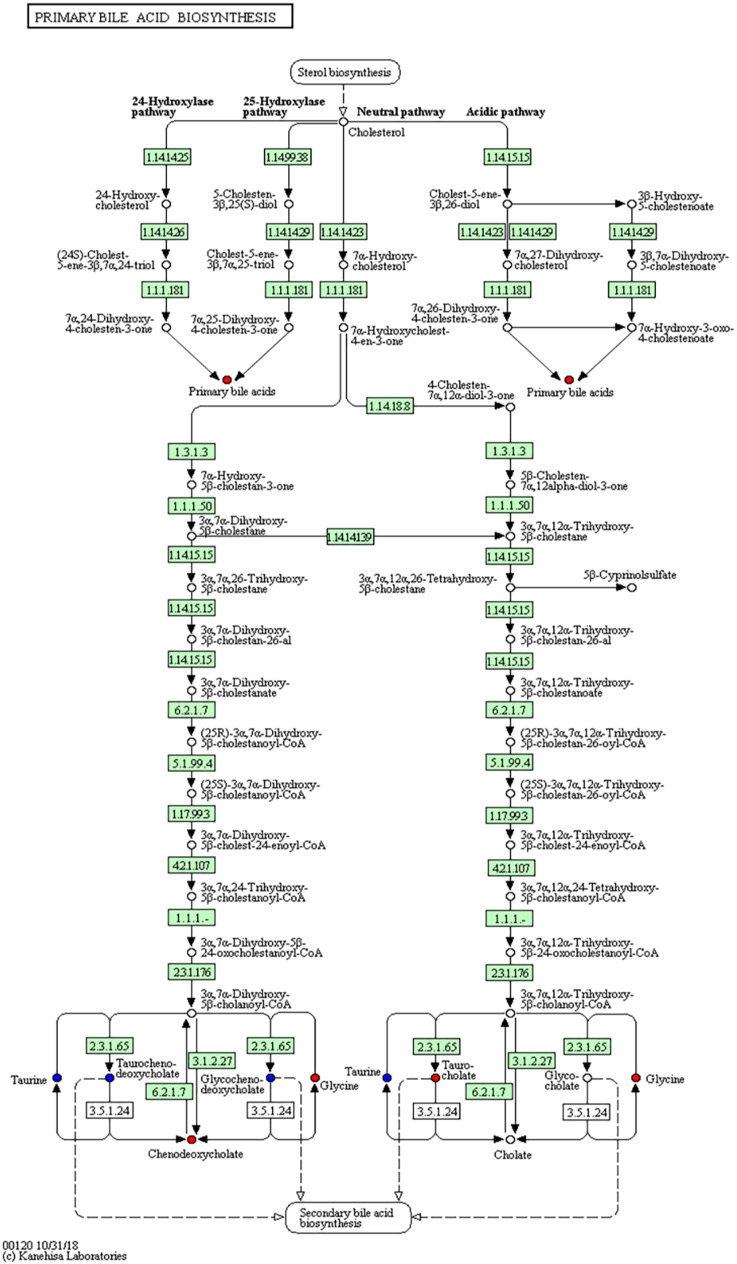
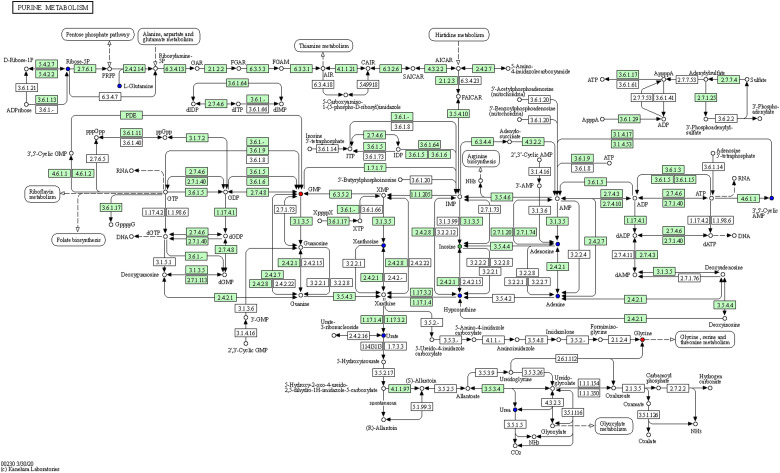
Background: Pancreatic cancer (PC) has a poor prognosis and is prone to liver metastasis. The KAI1/CD82 gene inhibits PC metastasis. This study aimed to explore differential metabolites and enrich the pathways in serum samples between PC and liver metastasis nude mouse models stably expressing KAI1/CD82. Methods: KAI1/CD82-PLV-EF1α-MCS-IRES-Puro vector and PANC1 cell line stably expressing KAI1/CD82 were constructed for the first time. This cell line was used to construct 3 PC nude mouse models and 3 liver metastasis nude mouse models. The different metabolites and Kyoto encyclopedia of genes and genomes (KEGG) and human metabolome database (HMDB) enrichment pathways were analyzed using the serum samples of the 2 groups of nude mouse models on the basis of untargeted ultra-performance liquid chromatography-tandem mass spectrometry platform. Results: KAI1/CD82-PLV-EF1α-MCS-IRES-Puro vector and PANC1 cell line stably expressing KAI1/CD82 were constructed successfully, and all nude mouse models survived and developed cancers. Among the 1233 metabolites detected, 18 metabolites (9 upregulated and 9 downregulated) showed differences. In agreement with the literature data, the most significant differences between both groups were found in the levels of bile acids (taurocholic acid, chenodeoxycholic acid), glycine, prostaglandin E2, vitamin D, guanosine monophosphate, and inosine. Bile recreation, primary bile acid biosynthesis, and purine metabolism KEGG pathways and a series of HMDB pathways (P < .05) contained differential metabolites that may be associated with liver metastasis from PC. However, the importance of these metabolites on PC liver metastases remains to be elucidated. Conclusions: Our findings suggested that the metabolomic approach may be a useful method to detect potential biomarkers in PC.
Keywords: KAI1/CD82; biomarker; metabolomics; nude mouse models; pancreatic cancer.
Conflict of interest statement
Figures
Similar articles
-
KAI1/CD82 Genetically Engineered Endothelial Progenitor Cells Inhibit Metastasis of Human Nasopharyngeal Carcinoma in a Mouse Model.Med Sci Monit. 2018 May 14;24:3146-3152. doi: 10.12659/MSM.907219. Med Sci Monit. 2018. PMID: 29755107 Free PMC article.
-
Down-regulation of the metastasis suppressor protein KAI1/CD82 correlates with occurrence of metastasis, prognosis and presence of HPV DNA in human penile squamous cell carcinoma.Virchows Arch. 2008 Apr;452(4):369-75. doi: 10.1007/s00428-008-0590-0. Epub 2008 Feb 28. Virchows Arch. 2008. PMID: 18305955
-
KAI1 is a potential target for anti-metastasis in pancreatic cancer cells.World J Gastroenterol. 2008 Feb 21;14(7):1126-32. doi: 10.3748/wjg.14.1126. World J Gastroenterol. 2008. PMID: 18286698 Free PMC article.
-
KAI1/CD82, a tumor metastasis suppressor.Cancer Lett. 2006 Aug 28;240(2):183-94. doi: 10.1016/j.canlet.2005.08.018. Epub 2005 Nov 2. Cancer Lett. 2006. PMID: 16260083 Review.
-
KAI1/CD82, Metastasis Suppressor Gene as a Therapeutic Target for Non-Small-Cell Lung Carcinoma.J Environ Pathol Toxicol Oncol. 2017;36(3):269-275. doi: 10.1615/JEnvironPatholToxicolOncol.2017024619. J Environ Pathol Toxicol Oncol. 2017. PMID: 29283339 Review.
Cited by
-
Bile Acids and Microbiota Interplay in Pancreatic Cancer.Cancers (Basel). 2023 Jul 11;15(14):3573. doi: 10.3390/cancers15143573. Cancers (Basel). 2023. PMID: 37509236 Free PMC article. Review.
-
Widely Targeted Lipidomics and Microbiomics Perspectives Reveal the Mechanism of Auricularia auricula Polysaccharide's Effect of Regulating Glucolipid Metabolism in High-Fat-Diet Mice.Foods. 2024 Aug 29;13(17):2743. doi: 10.3390/foods13172743. Foods. 2024. PMID: 39272508 Free PMC article.
References
-
- Smith RA, Andrews KS, Brooks D, et al.Cancer screening in the United States, 2017: a review of current American cancer society guidelines and current issues in cancer screening. CA Cancer J Clin. 2017;67(2):100-121. - PubMed
-
- Lee MX, Saif MW. Screening for early pancreatic ductal adenocarcinoma: an urgent call! Jop. 2009;10(2):104-108. - PubMed
-
- Dong JT, Lamb PW, Rinker-Schaeffer CW, et al.KAI1, a metastasis suppressor gene for prostate cancer on human chromosome 11p11.2. Science. 1995;268(5212):884-886. - PubMed
Publication types
MeSH terms
Substances
LinkOut - more resources
Full Text Sources
Medical
