. 2022 Jun;35(3):352-362.
doi: 10.1177/19714009211047455. Epub 2021 Oct 3.

Correlation of dual energy computed tomography electron density measurements with cerebral glioma grade

Affiliations

Correlation of dual energy computed tomography electron density measurements with cerebral glioma grade

Ritwik Chakrabarti et al. Neuroradiol J. 2022 Jun.

Abstract

Objective: To correlate dual energy computed tomography electron density measurements with histopathological cerebral glioma grading to determine whether it can be used as a non-invasive predictor of cerebral glioma grade.

Materials and methods: Fifty patients with suspected cerebral gliomas on imaging scheduled to undergo resection were included. We tested our hypothesis that with increasing glioma grade, increased tumor cellularity should translate into increased electron density and if a statistically significant difference between electron density of low-grade gliomas and high-grade gliomas is seen, we may have a clinical use of dual energy computed tomography as a non-invasive tool to predict cerebral glioma grade.A pre-operative dual energy computed tomography scan of the brain was performed, and electron density measurements calculated from the solid part of the tumor. Obtaining a ratio with electron density of contralateral normal brain parenchyma normalized these values. The minimum, maximum and mean electron density and their normalized values recorded between high-grade gliomas and low-grade gliomas were compared for presence of statistical significance.

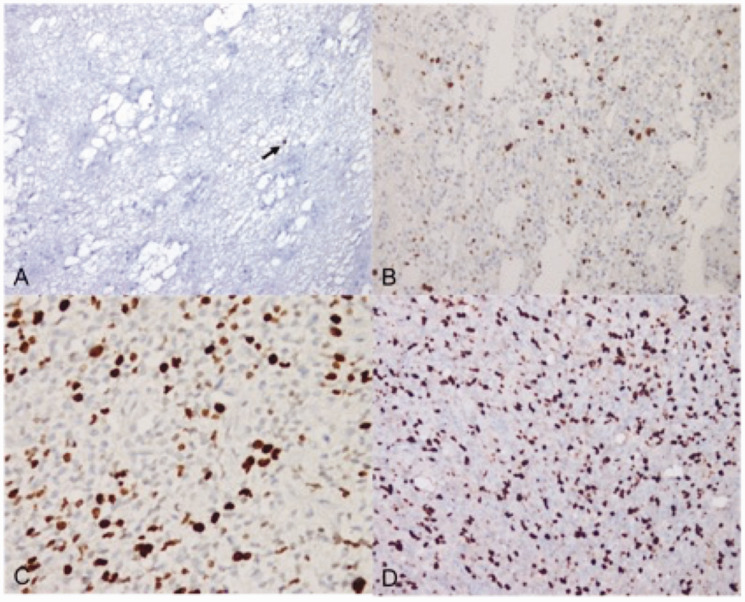
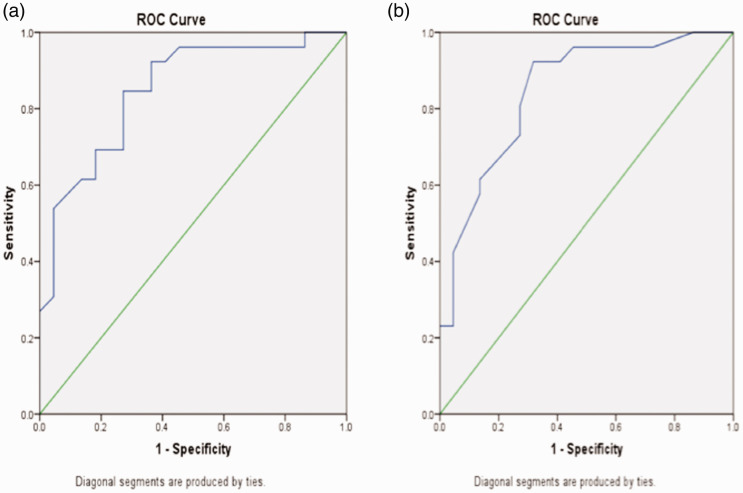
Results: A statistically significant difference was found between all six parameters recorded (minimum electron density and normalized values, mean electron density and normalized values, maximum electron density and normalized values) between low-grade gliomas and high-grade gliomas. The predictivity ranged from 75% (for minimum electron density and maximum normalized values) to 81.25% (for mean normalized values). All six parameters were found to have statistically significant positive correlation with Ki-67 index.

Conclusion: Dual energy computed tomography electron density measurements in cerebral gliomas are predictive of pre-operative differentiation of low-grade gliomas from high-grade gliomas and show a linear, statistically significant positive correlation with Ki-67 index.

Keywords: Dual energy computed tomography; cerebral glioma; electron density.


Conflict of interest statement

Conflict of interest: The author(s) declared no potential conflicts of interest with respect to the research, authorship, and/or publication of this article.

Figures

Figure 1.
Figure 1.
A case of left temporal lobe gliosarcoma (WHO grade 4). (a) Representative DECT image with ROIs drawn for illustration. Left ROI on solid component of lesion: HUL (CT number with low kV ie.80 kV): 42.4, HUH (CT number with high kV i.e. Sn140): 34.5, ΔHU (energy subtracted CT number): 29.5. Right ROI: example of a contralateral normal brain ROI of same area (1.4 cm2) with ΔHU 27.8. (b) Also mentioned are the minimum and maximum pixel values. Corresponding post-contrast T1WI axial image reveals a heterogeneously enhancing left temporal lobe lesion, which was referenced in placing the ROI.
Figure 2.
Figure 2.
Ki-67 immunostain (immunoperoxidase, x200:A,B,D. x400:C). (a) Subependymoma (WHO grade 1) with occasional positive cells highlighted (arrow); labeling index estimated as 1% (b) Diffuse astrocytoma (WHO grade 2) with positive cells highlighted, labeling index estimated as 4% (c) Anaplastic oligodendroglioma (WHO grade 3); labeling index estimated as 20% (d) Glioblastoma (WHO grade 4); labeling index estimated as 40%.
Figure 3.
Figure 3.
35-year-old male with right frontal diffuse astrocytoma (WHO Grade 2). (a) T2WI axial (b) FLAIR axial (c) T1WI axial (d) Post-contrast T1WI axial images reveal a large non-enhancing lesion with mass effect in right frontal deep white matter (e) DECT image reveals ROI placed within the lesion and contralateral normal white matter (f) Histopathology (H&E stain × 100) low magnification demonstrates a moderately cellular glial tumor in a fibrillary background.
Figure 4.
Figure 4.
56-year-old male with right frontal glioblastoma, IDH wild type (WHO grade 4) (a) T2WI axial (b) FLAIR axial (c) T1WI axial (d) Post-contrast T1WI axial images reveal a heterogeneously enhancing infiltrative lesion with mass effect in right frontal lobe (e) DECT image shows ROI placed within enhancing solid component of the lesion and in contralateral normal white matter (f) Histopathology (H&E stain, x100) low magnification demonstrates a highly cellular tumor present in sheets in a fibrillary background. Many bizarre cells and atypical cells are also seen.
Figure 5.
Figure 5.
(a) Minimum ED (b) Minimum rED ROC curves with area under curves (AUC for minimum ED = 0.82, for minimum rED = 0.83).
Figure 6.
Figure 6.
(a) Mean ED (b) Mean rED ROC curves with area under curves (AUC for mean ED = 0.84, for mean rED = 0.84).
Figure 7.
Figure 7.
(a) Maximum ED (b) Maximum rED ROC curves with area under curves (AUC for maximum ED = 0.85, for maximum rED = 0.80).

References

    1. Osborn AG. Osborn’s Brain: Imaging, pathology and anatomy. Salt Lake City: Amirsys Inc; 2013. p.445.
    1. Law M, Cha S, Knopp EA, et al. High-grade gliomas and solitary metastases: Differentiation by using perfusion and proton spectroscopic MR imaging. Radiology 2002; 222: 715–21. - PubMed
    1. Law M, Yang S, Wang H, et al. Glioma grading: Specificity and predictive values of perfusion MR imaging and proton MR spectroscopic imaging compared with conventional MR imaging. Am J Neuroradiol 2003; 24: 1989–98. - PMC - PubMed
    1. Ellika SK, Jain R, Patel SC, et al. Role of perfusion CT in glioma grading and comparison with conventional MR imaging features. Am J Neuroradiol 2007; 28: 1981–87. - PMC - PubMed
    1. Teng K, Zhang ZH, Jiang LL. The application of apparent diffusion coefficient in preoperative grading of gliomas. J Med Imaging 2007; 17: 1250–51.