Assessment of Detailed Photoreceptor Structure and Retinal Sensitivity in Diabetic Macular Ischemia Using Adaptive Optics-OCT and Microperimetry
- PMID: 34605880
- PMCID: PMC8496411
- DOI: 10.1167/iovs.62.13.1
Assessment of Detailed Photoreceptor Structure and Retinal Sensitivity in Diabetic Macular Ischemia Using Adaptive Optics-OCT and Microperimetry
Abstract
Purpose: The purpose of this study was to assess density and morphology of cone photoreceptors (PRs) and corresponding retinal sensitivity in ischemic compared to nonischemic retinal capillary areas of diabetic eyes using adaptive optics optical coherence tomography (AO-OCT) and microperimetry (MP).
Methods: In this cross-sectional, observational study five eyes of four patients (2 eyes with proliferative diabetic retinopathy (DR) and 3 eyes moderate nonproliferative DR) were included. PR morphology and density was manually assessed in AO-OCT en face images both at the axial position of the inner-segment outer segment (IS/OS) and cone outer segment tips (COSTs). Retinal sensitivity was determined by fundus-controlled microperimetry in corresponding areas (MP-3, Nidek).
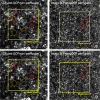
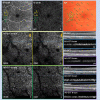
Results: In AO-OCT, areas affected by capillary nonperfusion showed severe alterations of cone PR morphology at IS/OS and COST compared to areas with intact capillary perfusion (84% and 87% vs. 9% and 8% of area affected for IS/OS and COST, respectively). Mean reduction of PR signal density in affected areas compared to those with intact superficial capillary plexus (SCP) and deep capillary plexus (DCP) perfusion of similar eccentricity was -38% at the level of IS/OS (P = 0.01) and -39% at the level of COST (P = 0.01). Mean retinal sensitivity was 10.8 ± 5.4 in areas affected by DCP nonperfusion and 28.2 ± 1.5 outside these areas (P < 0.001).
Conclusions: Cone PR morphology and signal density are severely altered in areas of capillary nonperfusion. These structural changes are accompanied by a severe reduction of retinal sensitivity, indicating the importance of preventing impaired capillary circulation in patients with DR.
Conflict of interest statement
Disclosure:
Figures


Similar articles
-
Morphologic and Functional Assessment of Photoreceptors After Macula-Off Retinal Detachment With Adaptive-Optics OCT and Microperimetry.Am J Ophthalmol. 2020 Jun;214:72-85. doi: 10.1016/j.ajo.2019.12.015. Epub 2019 Dec 25. Am J Ophthalmol. 2020. PMID: 31883465
-
Deep Retinal Capillary Nonperfusion Is Associated With Photoreceptor Disruption in Diabetic Macular Ischemia.Am J Ophthalmol. 2016 Aug;168:129-138. doi: 10.1016/j.ajo.2016.05.002. Epub 2016 May 10. Am J Ophthalmol. 2016. PMID: 27173374 Free PMC article.
-
Association of Diabetic Macular Nonperfusion With Outer Retinal Disruption on Optical Coherence Tomography.JAMA Ophthalmol. 2015 Sep;133(9):1036-44. doi: 10.1001/jamaophthalmol.2015.2183. JAMA Ophthalmol. 2015. PMID: 26158562 Free PMC article.
-
Colocalization of Ellipsoid Zone Disruption With Capillary Nonperfusion in Different Retinal Vascular Layers and Choriocapillaris on En Face OCT of Diabetic Patients.Microcirculation. 2025 Jan;32(1):e70000. doi: 10.1111/micc.70000. Microcirculation. 2025. PMID: 39730150
-
Photoreceptor Characteristics in Diabetic Retinopathy vs Controls Using Adaptive Optics Imaging: Systematic Review.J Vitreoretin Dis. 2024 Sep 30:24741264241286682. doi: 10.1177/24741264241286682. Online ahead of print. J Vitreoretin Dis. 2024. PMID: 39539836 Free PMC article. Review.
Cited by
-
Optimization of an Ischemic Retinopathy Mouse Model and the Consequences of Hypoxia in a Time-Dependent Manner.Int J Mol Sci. 2024 Jul 23;25(15):8008. doi: 10.3390/ijms25158008. Int J Mol Sci. 2024. PMID: 39125579 Free PMC article.
-
Pearls and Pitfalls of Adaptive Optics Ophthalmoscopy in Inherited Retinal Diseases.Diagnostics (Basel). 2023 Jul 19;13(14):2413. doi: 10.3390/diagnostics13142413. Diagnostics (Basel). 2023. PMID: 37510157 Free PMC article. Review.
-
Peripheral and central capillary non-perfusion in diabetic retinopathy: An updated overview.Front Med (Lausanne). 2023 Mar 23;10:1125062. doi: 10.3389/fmed.2023.1125062. eCollection 2023. Front Med (Lausanne). 2023. PMID: 37035306 Free PMC article. Review.
-
How early can we detect diabetic retinopathy? A narrative review of imaging tools for structural assessment of the retina.Graefes Arch Clin Exp Ophthalmol. 2025 May 16. doi: 10.1007/s00417-025-06828-3. Online ahead of print. Graefes Arch Clin Exp Ophthalmol. 2025. PMID: 40379804 Review.
-
Characterizing the Preferred Retinal Locus and Fixation Stability in Diabetic Macular Ischemia: A One-Year Study.Vision (Basel). 2025 Mar 5;9(1):20. doi: 10.3390/vision9010020. Vision (Basel). 2025. PMID: 40137932 Free PMC article.
References
-
- Garner A. Histopathology of diabetic retinopathy in man. Eye. 1993; 7(2): 250–253. - PubMed
-
- Engerman RL. Perspectives in diabetes pathogenesis of diabetic retinopathy, https://diabetes.diabetesjournals.org/content/diabetes/38/10/1203.full.pdf. - PubMed
-
- Early Treatment Diabetic Retinopathy Study Research Group. Classification of diabetic retinopathy from fluorescein angiograms: ETDRS report number 11. Ophthalmology. 1991; 98(5): 807–822. - PubMed
-
- Sim DA, Keane PA, Zarranz-Ventura J, et al. .. The effects of macular ischemia on visual acuity in diabetic retinopathy. Invest Ophthalmol Vis Sci. 2013; 54(3): 2353–2360. - PubMed
-
- Ticho U, Patz A.. The role of capillary perfusion in the management of diabetic macular edema. Am J Ophthalmol. 1973; 76(6): 880–886. - PubMed
Publication types
MeSH terms
LinkOut - more resources
Full Text Sources
Medical
Research Materials
Miscellaneous

